An ab initio study of the C
2
H
2
HF, C
2
H(CH
3
) HF and C
2
(CH
3
)
2
HF
hydrogen-bonded complexes
Mozart N. Ramos
a,∗, Kelson C. Lopes
b, Washington L.V. Silva
b, Alessandra M. Tavares
b,
F´atima A. Castriani
b, Silmar A. do Monte
b, Elizete Ventura
b, Regiane C.M.U. Ara´ujo
baDepartamento de Qu´ımica Fundamental, Universidade Federal de Pernambuco (UFPE),
Rua Jose Simoes Araujo 352 apto 501, 50739-901, Recife (PE), Brasil
bDepartamento de Qu´ımica, Universidade Federal da Para´ıba (UFPB), 58036-300, Jo˜ao Pessoa (PB), Brasil
Received 24 February 2005; received in revised form 27 April 2005; accepted 14 May 2005
Abstract
MP2/6-31++G** and B3LYP/6-31++G** ab initio molecular orbital calculations have been performed in order to obtain molecular geome-tries, binding energies and vibrational properties of the C2H2 HF, C2H(CH3) HF and C2(CH3)2 HF H-bonded complexes. As expected,
the more pronounced effects on the structural properties of the isolated molecules due to complexation was verified for the C C and H F bond lengths, which are directly involved in the H-bond formation. These bond distances increased after complexation. BSSE uncorrected B3LYP binding energies are always lower than the corresponding MP2 values. However, the opposite trend has been verified after BSSE correction by the counterpoise method since it is much lower at B3LYP than at MP2 level. The binding energies for these complexes as well as for the HF acid submolecule modes (the HF stretching and vibrational frequency modes) showed an increasing hydrogen-bonding strength with increasing methyl substitution. The splitting in the HF in-plane and out-of-plane bending modes reflects the anisotropy in the hydrogen-bonding interaction with thesystem of the C C bond. The H F stretching frequency is shifted downward after complexation and it increases with the methyl substitution. The IR intensities of the HF acid submolecule fundamentals are adequately interpreted through the atomic polar tensor of the hydrogen atom using the charge–charge flux-overlap model. The skeletal stretching modes of the Alkyne submolecule are decreased in the complex. The new vibrational modes arising from complexation show several interesting features. © 2005 Elsevier B.V. All rights reserved.
Keywords: Hydrogen bond; Ab initio methods; Infrared spectrum; Substituted alkyne
1. Introduction
A variety of experimental techniques and theoretical cal-culations has been employed in order to understand the hydrogen-bonding interaction with-bonded systems. From the experimental point of view, the ground vibrational molec-ular structures of weakly hydrogen-bonded complexes have been characterized by means of microwave and infrared molecular beam techniques with a Fourier transform[1–7]. Nowadays, it is already well established that the molecu-lar interaction between hydrogen halides as proton donors
∗Corresponding author. Tel.: +55832167438; fax: +55832167437.
E-mail address:[email protected] (M.N. Ramos).
and alkynes or alkenes as proton acceptors produces T-type hydrogen complexes, which are T-shaped near-prolate asymmetric rotors. These complexes yield to X H· · ·
type interactions, i.e., the interaction between the hydro-gen halide molecule HX and the -electron density of a carbon–carbon triple or double bond. For example, Andrews et al.[7]have performed high-resolution FT-IR matrix iso-lation studies to identify a hydrogen-bondedcomplex for C2H2 HX with C2v symmetry through comparison of the
relatively small shifts for the C C stretching frequencies and relatively larger shifts for in-plane fundamental bend-ing frequencies in the acetylene moieties and it was obtained a loss of degeneracy in all observed bending modes. On the other hand, theoretical calculations[8–13]have been partic-ularly useful to estimate binding energies, H-bond lengths
384 M.N. Ramos et al. / Spectrochimica Acta Part A 63 (2006) 383–390
and structural (electrical and vibrational) changes that take place in the isolated molecules after complexation. Moreover, theoretical calculations have been successful in predicting the new low-frequency vibrational modes, which, in gen-eral, show very weak intensities and, therefore, are difficult to characterize experimentally. These modes show several interesting features. However, high-level quantum chemical calculations with electron correlation and large basis set are necessary in order to obtain a proper description of a weakly bound hydrogen-bonded system. Generally, electron correla-tion effects are crucial to take into account dispersion forces. This can be reached through both Møller–Plesset perturbation theory at second-term level (MP2)[14]and density functional theory (DFT)[15]with B3LYP exchange-correlation func-tional. Furthermore, it is now well established that diffuse and polarization functions must be included in the basis set in order to adequately describe the non-spherical atomic den-sities and polarizability effects. This is particularly important in studying long-range electrostatic interactions.
The goal of the present paper is to study hydrogen-bonded complexes of the X H· · · type, with hydrogen fluoride (HF) as proton donor, and acetylene (C2H2), methylacetylene
[C2H(CH3)] and dimethylacetylene [C2(CH3)2] as-charge
centre. The C2H2 HF, C2H(CH3) HF and C2(CH3)2 HF
H-bonded complexes have been previously investigated by Andrews et al.[6]using Fourier transform infrared spectra, including also complexes of the type C2X2 HF with X = F
and Cl[7]. They have shown that methyl substitution gives a stronger hydrogen bond and that halogen substitution gives a weaker hydrogen bond in acomplex involving the halogen. Their investigations consider the vibrational mode of the HF submolecule, leading to the conclusion that the more methyl groups replace hydrogen atoms the stronger the hydrogen bond becomes.
In this paper, a comparative investigation in terms of struc-tural, electronic and vibrational properties of the C2H2 HF,
C2H(CH3) HF and C2(CH3)2 HF H-bonded complexes
have been performed at MP2 and B3LYP levels, with the 6-31++G** basis set.
2. Calculations
MP2/6-31++G** and B3LYP/6-31++G** ab initio calcu-lations were performed by using the Gaussian 98W program
[16]. In this procedure, the molecular geometries of the iso-lated compounds as well as the hydrogen-bonded complexes were fully optimized. The binding energies were computed considering the basis set superposition error (BSSE)[17]due to the super molecule approach using the full counterpoise (CP) method proposed by Boys and Bernardi[18]. It is impor-tant to point out that the procedure to estimate the BSSE correction including the fragment deformation energy in the estimation of BSSE correction to binding energy, as first high-lighted by Ensley et al.[19]and stressed elsewhere[20,21]
is, in general, minimized when the CP method is employed in
conjunction with a large basis set, which is flexible enough to provide a good description of the electrons in both the atomic core and the long-range region of the atoms[22,23].
3. Results and discussion
The molecular geometries parameters of the C2H2 HF,
C2H(CH3) HF and C2(CH3)2 HF complexes and of their
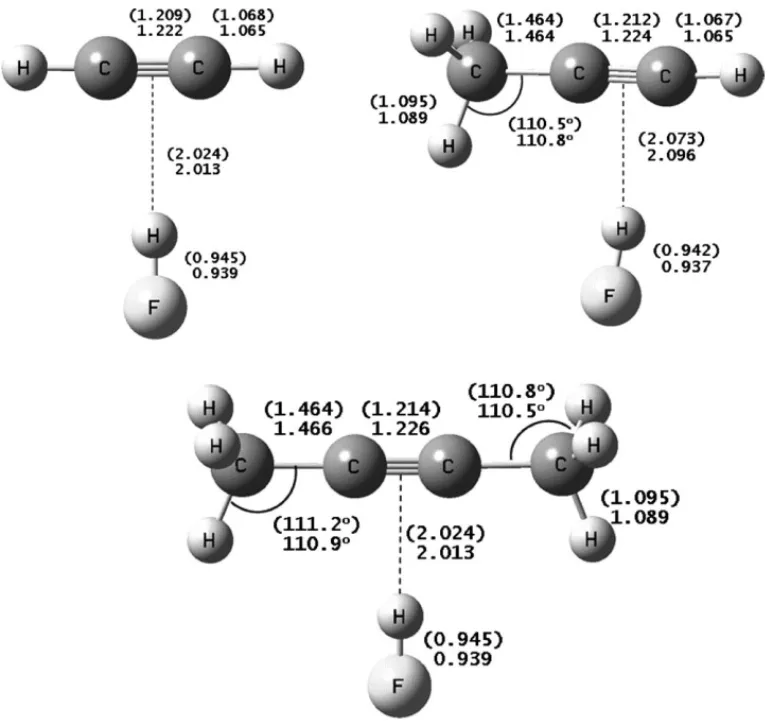
isolated molecules were fully optimized at the MP2/6-31++G** and B3LYP/6-MP2/6-31++G** calculation levels. The results are shown inFig. 1. As expected, the more pronounced effects verified after complexation were obtained for C C and H F bond lengths, which are directly involved in the H-bond formation. Their increments (␦rC Cand␦rH F) are
given in Table 1 as well as the H-bond lengths measured from the fluorine atom of the H F bond to the midpoint of the C C bond of the C2H2 HF and C2(CH3)2 HF
com-plexes. For the C2H(CH3) HF complex, the H-bond distance
is slightly closer to the carbon atom (of the triple bond) bonded to the hydrogen atom, so that the electronic repul-sion between the methyl group and the hydrogen atom in HF is minimized. FromTable 1, we can note that the C C and H F bond distances increments after complexation increase with methyl substitution. For example, B3LYP values con-cerning the increment of H F bond distances (␦rH F) for
the C2H2 HF, C2H(CH3) HF and C2(CH3)2 HF complexes
are 0.010 ˚A, 0.014 ˚A and 0.017 ˚A, respectively. Thus, methyl substitution leads to a progressive increase in the increment of H F bond distance with complexation. Although of smaller magnitude, the same trend holds for C C bond distances, for which␦rC Cvalues are 0.001 ˚A, 0.002 ˚A and 0.003 ˚A for the
C2H2 HF, C2H(CH3) HF and C2(CH3)2 HF complexes,
respectively, at both B3LYP and MP2 levels. On the other hand, the F· · ·||| hydrogen bond length is reduced by 0.07 ˚A on substitution of one hydrogen atom by a methyl group, at both B3LYP and MP2 levels. A second replacement causes a further decrease by the same quantity at MP2 level and by about 0.06 ˚A at B3LYP level. Therefore, our calculations indicate that methyl substitution produces a stronger hydro-gen bond, in agreement with the results obtained by Andrews and Johnson[6,7]. Moreover, it is interesting to note that the hydrogen bond lengths obtained from MP2 results are always longer than the corresponding B3LYP values. For example, the MP2 value forrF···|||is 3.107 ˚A in C2H2 HF, whereas its
corresponding B3LYP value is 3.081 ˚A.
Table 2 shows the binding energies, E, the binding energies including zero point energy and BSSE correction,
Ec, dipole moments (µ) and polarity enhancements (µ)
for the C2H2 HF, C2H(CH3) HF and C2(CH3)2 HF
complexes. µ stands for the dipole moment
dif-ference between the complex and the free molecules (µ=µcomplex−µfree molecules). E was determined by
Fig. 1. MP2/6-31++G** and B3LYP/6-31++G** results for the full optimized geometries of C2H2 HF, C2H(CH3) HF and C2(CH3)2 HF H-bonded
complexes. B3LYP values are given in parentheses. Units in angstr¨oms ( ˚A).
Table 1
MP2/6-31++G** and B3LYP/6-31++G** values of the more pronounced structural changes occurring after complexation and the H-bond lengths
Complexes Level of calculation Structural changes H-bond lengthsrF. . .|||
␦rH F ␦rC C
C2H2 HF MP2/6-31++G** 0.007 0.001 3.107
B3LYP/6-31++G** 0.010 0.001 3.081 (3.075)a
C2H(CH3) HF MP2/6-31++G** 0.010 0.002 3.033
B3LYP/6-31++G** 0.014 0.002 3.015
C2(CH3)2 HF MP2/6-31++G** 0.013 0.003 2.963
B3LYP/6-31++G** 0.017 0.003 2.958
Units in angstr¨oms ( ˚A).
aRefs.[6,7].
Table 2
MP2/6-31++G** and B3LYP/6-31++G** values of the hydrogen bonding energies,E(defined asE=EA+EB−EAB), BSSE, and corrected hydrogen
bonding energies,Ec, which correspond to the binding energy after BSSE and zero point vibration energy correction
Complexes Level of calculation E BSSE Ec (µ) (µ)
C2H2 HF MP2/6-31++G** 19.23 4.39 8.61 2.73 0.64
B3LYP/6-31++G** 18.60 0.59 12.00 2.75 0.76
C2H(CH3) HF MP2/6-31++G** 24.75 4.76 12.96 2.83 0.74
B3LYP/6-31++G** 23.53 0.38 16.97 2.97 0.98
C2(CH3)2 HF MP2/6-31++G** 28.97 5.10 16.89 2.89 0.79
B3LYP/6-31++G** 26.75 0.21 20.23 2.93 0.94
Values in kJ mol−1. Dipole moments and polarity enhancements (µ=µ
386 M.N. Ramos et al. / Spectrochimica Acta Part A 63 (2006) 383–390
E, obtained from the B3LYP results are always slightly lower than the corresponding MP2 values. However, a reverse trend is verified after BSSE correction is applied to the binding energy. Now, B3LYP values become larger than the MP2 values. Corrected B3LYP binding energies (Ec)
are higher than the MP2 values by about of 4.0 kJ mol−1.
Chandra and Nguyen [13] have also verified the same behavior for the C2HX HX (X = F and Cl) complexes. As
expected, our results indicate that lower H-bond lengths are associated with larger binding energies. In this same sense, our results also indicate an increasing hydrogen-bond strength with increasing methyl substitution: Ec
(C2(CH3)2 HF) >Ec(C2H(CH3) HF) >Ec(C2H2 HF)
at both MP2 and B3LYP levels. Moreover, each methyl group leads to an increase of about∼4.0 kJ mol−1 inE
c.
It is interesting to point out that the values of Ec for
C2HF HF obtained by Chandra and Nguyen[13]employing
the MP2/6-31++G** and B3LYP/6-31++G** calculations are 3.51 and 7.48 kJ mol−1, respectively. These results
confirm that methyl substitution gives a stronger hydrogen bond and that halogen substitution gives a weaker hydrogen bond.
Large polarity enhancements due to complexation are found for the C2H2 HF, C2H(CH3) HF and C2(CH3)2 HF
complexes; the values are in the range of 0.6–0.8 D at MP2 level, and 0.8–1.0 D at B3LYP level. These polarity enhance-ments tend to increase with the methyl substitution in the C2X2base molecule.
The vibrational spectrum of a hydrogen-bonded com-plex contains bands due to acid (HF) and base (C2X2)
sub-molecules which differ from the free acid and base sub-molecules depending on the strength and orientation of the hydrogen-bonding interaction. For the above complexes, Andrews et al. [1,2,6,7] have already observed that the strongest acid submolecule modes are the H F stretching fundamental (νstrHF) and the H F deformation fundamentals (ν, in-planeand
ν, out-of-plane), which are split due to an anisotropy of the HF
interaction with the-charge centre. They have also observed that the base submolecule modes are only slightly shifted
by the HF ligand and, therefore, the base molecule may be useful as a model for the base submolecule in the complex. From the theoretical point of view, Chandra and Nguyen
[13]confirm the experimental observations from Andrews and collaborators for the C2HX HX complexes with X = F
and Cl. They have also verified that the H X stretching frequency shift and the intermolecular vibrational frequen-cies are better estimated at B3LYP than at MP2 level, using the 6-31++G** basis set. However, IR intensities have not been considered in both experimental and theoretical stud-ies. Thus, we have listed in Table 3 the MP2/6-31++G** and B3LYP/6-31++G** results of the harmonic frequen-cies, frequency shifts, infrared intensities and intensity ratios after complexation for the HF stretching mode in C2H2 HF,
C2H(CH3) HF and C2(CH3)2 HF complexes. The
previ-ous experimental values obtained from Andrews and Johnson
[6,7]and the theoretical values for C2HF HF obtained from
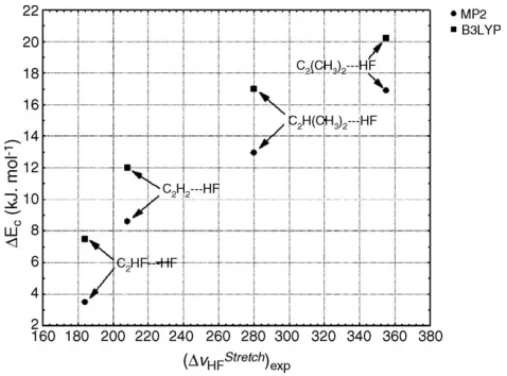
Chandra and Nguyen[13] are given inTable 3. From this table, we can verify that the H F stretching frequency is shifted downward after complexation. Moreover, we can still notice that larger shifts are associated with stronger hydro-gen bonds in considering values ofEcshown inTable 2. In Fig. 2the values ofEcagainst the experimental stretching
frequency shifts are given. The greater shift (νstrHF) is found for the C2(CH3)2 HF system, which corresponds to the more
strongly bound complex, whereas the lower shift is found for the C2HF HF complex that represents the more weakly
bound complex. FromTable 3we can also note that theνstrHF
experimental values are situated between those obtained from MP2 and B3LYP methods. However, they are slightly nearest to the B3LYP ones.
FromTable 3one can see that the H F stretching inten-sity of the proton donor molecule is much enhanced upon H-bond formation. For example, the AstrHF,C/AstrHF ratio in C2(CH3)2 HF is 6.1 and 8.0 at MP2 and B3LYP levels,
respectively. The intensity ratios obtained from B3LYP are always higher than the MP2 ones. Unfortunately, as far as we are concerned, the experimental value for the H F stretching intensity after complexation is unknown. Thus, this prevents
Table 3
MP2/6-31++G** and B3LYP/6-31++G** values of the harmonic frequencies, frequency shifts, infrared intensities and intensity ratios after complexation of the HF stretching
Compounds Level of calculation νHFstr νstr,CHF −νstrHF AstrHF Astr,CHF /AstrHF
HF MP2/6-31++G** 4119 – 126 –
B3LYP/6-31++G** 4068 (3961)a – 114 (77)b –
C2H2 HF MP2/6-31++G** – 161 – 4.7
B3LYP/6-31++G** – 241 (208.3)a – 6.3
C2H(CH3) HF MP2/6-31++G** – 233 – 5.2
B3LYP/6-31++G** – 326 (280.4)a – 7.2
C2(CH3)2 HF MP2/6-31++G** – 308 – 6.1
B3LYP/6-31++G** – 402 (354.9)a – 8.0
C2HF HFc MP2/6-31++G** – 133
B3LYP/6-31++G** – 214 (184)
Experimental values are given in parentheses. Units in cm−1and km mol−1. aRef.[6].
Fig. 2. Values ofEcagainst the H F experimental stretching frequency
shifts in the C2H2 HF, C2H2 HF, C2H(CH3) HF and C2(CH3)2 HF
series.
a direct comparison between calculated and experimental intensity ratios. Nowadays, on the other hand, it is well known that this increase in the H X (X = F, Cl, CN, NC and CCH) stretching intensity is due to the charge-flux term[9,10,12], which is strongly affected by complexation, in contrast to what happens with the hydrogen charge. The latter is always positive whereas the charge-flux is slightly negative in the free molecule and becomes quite positive after complexation. In the complex, the hydrogen charge and the charge-flux term have the same algebraic sign; then, since the HX stretch-ing intensity is proportional to the sum of the squares of these terms, it is enormously increased upon H-bond for-mation. The modified charge–charge flux-overlap (CCFO) model[24,25]for infrared intensities has shown the impor-tance of the charge-flux term in the H X stretching intensity enhancement. Here, we can confirm this behavior through comparison betweenPxxHandPzzHelements of the atomic polar tensor for the hydrogen atom before and after complexation. According with the modified CCFO model, thePxxH element is a measure of the hydrogen atomic charge at equilibrium position whereas thePzzH element measures the sum of the hydrogen atomic charge (PxxH) and the charge-flux term asso-ciated to the H F stretching.Table 4gives the results of the atomic polar tensor for the hydrogen atom (PXH) before and after complexation with C2H2, C2H(CH3) and C2(CH3)2. For
example, thePxxH element in free HF is 0.451e and after com-plexation with C2H2its value is decreased to 0.359e. On the
other hand, thePzzHelement is 0.352e in free HF and becomes 0.765e after complexation, i.e., it is more than twice thePxxH
element in the complex. The modified CCFO model shows that thePzzHelement can be represented by:
PzzH=qoH+(∂qH/∂zH)rHo (1)
whereas thePxxH element is given by:
PxxH =qoH (2)
Table 4
MP2/6-31++G** and B3LYP/6-31++G** values of the atomic polar tensor of the hydrogen atom in free and after complexation with HF
Compounds PxH= PH
xx PyyH
PzzH
PxH=
0.451(0.447)
0.451(0.447)
0.352(0.334)
C2H2 HF PxH=
0.359(0.340)
0.294(0.272)
0.765(0.849)
C2H(CH3) HF PxH=
0.334(0.316)
0.268(0.239)
0.822(0.913)
C2(CH3)2 HF PxH=
0.312(0.296)
0.250(0.221)
0.876(0.954)
Units of electrons,e. B3LYP values are given in parentheses.
Moreover, the H X stretching intensity can be represented by:
AstrHF=K(PzzH)2 (3)
where K = 975 km mol−1 e−2 for values of IR intensities
in km mol−1. These three equations allow us to get a
bet-ter understanding of why the H F stretching intensity is much enhanced after complexation, specially the effect of the charge-flux term (∂qH/∂zH) on its value. For the
H-bonded complexes systems investigated in this work, the charge-flux term changes from 0.334e in free HF to 0.849e in C2H2 HF, to 0.913e in C2H(CH3) HF and finally, to
0.954e in C2(CH3)2 HF complex at B3LYP level. Similar
behavior was obtained at MP2 level. It is also interesting to verify that the charge-flux is negative in the free molecule (PzzH < PxxH,−0.113e for B3LYP and−0.099e for MP2 in HF) and becomes quite positive after complexation (PzzH < PxxH, +0.509e for B3LYP and +0.406e for MP2 in C2H2 HF).
Other important observed feature is that the PzzH element increases with the H-bond strength.
Using the Eq.(3) we can make a self-check of the cal-culated H F stretching intensities. In free HF, the intensi-ties obtained from this equation are 121 and 109 km mol−1,
using the MP2 and B3LYP results forPzzH, whereas the cor-responding values obtained directly from a normal mode analysis are 126 and 114 km mol−1, respectively.
Concern-ing C2H(CH3) HF complex, the values obtained from Eq. (3) together with the polar tensors obtained from MP2 and B3LYP calculations are 659 and 813 km mol−1, respectively,
whereas the corresponding values obtained from a normal mode analysis are 658 and 823 km mol−1, respectively. The
388 M.N. Ramos et al. / Spectrochimica Acta Part A 63 (2006) 383–390
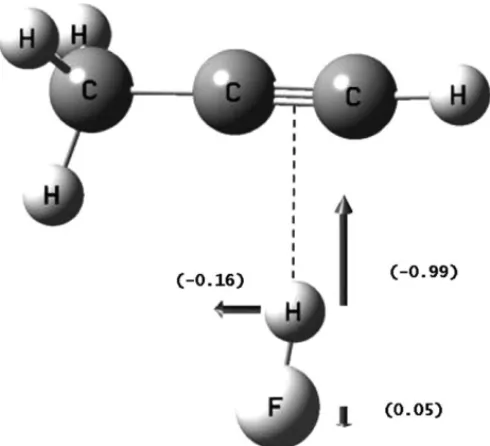
Fig. 3. Normal coordinate for the HF stretching mode using the B3LYP level of calculation.
zCartesian axis. InFig. 3we show the normal mode for the H F stretching in C2H(CH3) HF obtained from the B3LYP
calculation. The relative lengths of the vectors representing the atomic displacements for this normal mode are given in parentheses. It is important to draw the attention to the fact that the hydrogen displacement (−0.16) perpendicular to the
z-axis is due to molecular asymmetry of the-charge centre in C2H(CH3) HF. It does not appear in C2H2and C2(CH3)2.
In contrast to what happens with the HF stretching mode after complexation, the stretching frequencies of the C2X2
moiety are only slightly modified by the HF acid. InTable 5
we can verify that the experimental and B3LYP values for νC H are only−9 cm−1 and−12 cm−1, respectively.
These same displacements are also verified toνC C. Our
results show that the alkyne submolecule stretching modes are decreased after complexation. It is still interesting to note that νC C increases upon methyl substitution: −7 cm−1
for C2H2 HF,−12 cm−1for C2H(CH3) HF and−16 cm−1
for C2(CH3)2 HF, at B3LYP level. Their IR intensities are
very weak in both free molecule and the complex. On the other hand, the C H stretching intensity of the HCCX base molecule both before and after complexation are rel-atively large. For example, the C H stretching intensity is
64 km mol−1in C
2H(CH3) and changes to 85 km mol−1after
complexation. Therefore, itsAstr, CC H/AstrC Hratio is equal to 1.3. The formation of the C2H2 HF, C2H(CH3) HF and
C2(CH3)2 HF complexes gives rise to new vibrational
modes, which the low-frequency ones are given inTable 6.
Fig. 4 shows the schematic representation of these new normal modes in C2H2 HF obtained at B3LYP
calcula-tions. These new modes exhibit several interesting features. (i) Initially, we can verify that the H-stretch frequency follows the order: C2(CH3)2 HF > C2H(CH3) HF > C2
H2 HF > C2HF HF, i.e., 204 cm−1, 157 cm−1, 139 cm−1
and 135 cm−1[13], respectively. Therefore, its value
increases with increasing methyl substitution. Its IR intensity is, in turn, very weak and thus, it is not easy to be characterized from its experimental vibrational spectrum. (ii) The two H F bending modes, which are associated with the in-plane (b2)
and out-of-plane (b1) bending modes, where the proton of the
HF molecule moves along a line which is perpendicular to the H F chemical bond axis, have appreciable intensities. These modes, which are pure rotations in the HF isolated molecule, become infrared-active after complexation. The out-of-plane bending intensity is practically determined by the hydrogen equilibrium charge, i.e., thePxxH element of the atomic polar tensor of the hydrogen atom in HF (Table 4). FromTable 6
we can see that its B3LYP calculated values (from a fre-quency calculation) for the C2(CH3)2 HF, C2H(CH3) HF
and C2H2 HF are 100.9, 76.3 and 95.9 km mol−1,
respec-tively, whereas the values obtained by using the equation:
Aout-of-planeHF =K(PxxH)2 (4)
are 113, 97 and 85 km mol−1, respectively, which are in
rea-sonable agreement with the calculated ones. The in-plane bending mode (ν, in-plane) has also appreciable intensity but
its value is practically half of that relative to the out-of-plane mode. For example, this latter is 100.9 km mol−1 in
C2H2 HF whereas its corresponding value for the in-plane
mode is 56.6 km mol−1. Andrews and Johnson [6,7] have
pointed out that this splitting reflects an anisotropic potential governing the liberation of HF against the-charge centre of the C2X2 base sub molecule. They have also observed
that the in-plane bending mode has the higher potential because of a small contribution from repulsion between the HF acid and acetylenic protons. This split tends to
Table 5
B3LYP/6-31++G** values of the C H and C C stretching frequencies (νi, cm−1) and IR intensities (Ai, km mol−1) for the C2H2and C2H(CH3) molecules
before and after complexation with HF
Assign C2H2 C2H2 HF νiorAiC/Aiis C2H(CH3) C2H(CH3) HF νorAiC/Aiis
C H stretch
νI 3430 (3289) 3419 (3281) −11 (−8) 3484 (3323) 3472 (3312) −12 (−9)
Ai 93 124 1.3 64 85 1.3
C C stretch
νI 2069 (1974) 2062 (1973) −7 (−1) 2227 (2137) 2215 (2128) −12 (−9)
Ai 0 1 9 14 1.6
Table 6
B3LYP/6-31++G** and experimentalavalues of intermolecular harmonic frequencies (ν
i, cm−1) and IR intensities (Ai, km mol−1)
New vibrational modes C2H2 HF C2H(CH3) HF C2(CH3)2 HF
Exp B3LYP Exp B3LYP Exp B3LYP
Hbond-stretch (a1)b
ν 87 139 – 157 – 204
A – 1.1 – 3.3 – 6.1
H F bend (b2)
ν, in-plane 426 499 490 558 552 656
A, in-plane – 56.6 – 43.4 – 51.5
H F bend (b1)
ν, out-of-plane 382 437 432 489 489 530
A, out-of-plane – 100.9 – 76.3 – 95.9
H-bend (b2)
νB – 96 – 61 – 57
AB – 6.3 – 4.8 – 3.7
aRef.[13].
b This mode consists of a combination between a HF stretching and an intermolecular mode (seeFig. 4(b) for details), which approximates the HF and alkyne
molecules.
390 M.N. Ramos et al. / Spectrochimica Acta Part A 63 (2006) 383–390
increase in the series: C2HF HF, C2H2 HF, C2H(CH3) HF
and C2(CH3)2 HF. The experimental values[6,7]for ν (ν, in-plane−ν, out-of-plane) are 30 cm−1, 44 cm−1, 58 cm−1
and 63 cm−1, respectively. (iii) The lowest-frequency mode
of each complex consists of an intermolecular bending vibra-tion, where the atoms in each molecule in the complex move in a direction perpendicular to the respective molecular axis, as shown schematically inFig. 4(a). Its IR intensity is very weak and tends to decrease with the methyl substitution, as well as its vibrational frequency. For example, its B3LYP values for the C2H2 HF, C2H(CH3) HF and C2(CH3)2 HF
complexes are 96 cm−1, 61 cm−1and 57 cm−1, respectively.
4. Conclusions
Our MP2/6-31++G** and B3LYP/6-31++G** calcula-tions have confirmed the previous vibrational spectroscopic evidences obtained by Andrews and Johnson[6,7], that is, the H-bond strength increases in the C2H2 HF, C2H(CH3) HF
and C2(CH3)2 HF series. Their binding energies with or
without zero-point energy and BSSE correction clearly indi-cate this behavior, i.e., an increasing H-bond strength with increasing methyl substitution. This also produces a greater shift on the H F stretching frequency after complexation and an increasing splitting in the H F vibrational modes and the CCH deformation mode. The IR intensities of the HF acid sub molecule modes (the H F stretching and vibrational funda-mental frequencies) are adequately interpreted through the atomic polar tensor of the hydrogen atom in HF. Our calcu-lations also show small red shifts of the base submolecule skeletal stretching modes.
Acknowledgements
The authors gratefully acknowledge partial financial sup-port from the Brazilian funding agencies CNPq, CAPES and FINEP.
References
[1] S.A. McDonald, G.L. Johnson, B.W. Keelan, L. Andrews, J. Am. Chem. Soc. 102 (1980) 2892.
[2] L. Andrews, G.L. Johnson, B.J. Kelsall, J. Chem. Phys. 76 (1982) 5767.
[3] G.W. Bryant, D.F. Eggers, R.O. Watts, J. Chem. Soc. Faraday Trans. 284 (1988) 1443.
[4] A.C. Legon, P.D. Aldrich, W.H. Flygare, J. Chem. Phys. 75 (1981) 625.
[5] P.D. Aldrich, A.C. Legon, W.H. Flygare, J. Chem. Phys. 75 (1981) 2126.
[6] L. Andrews, G.L. Johnson, J. Phys. Chem. 86 (1982) 3380. [7] L. Andrews, G.L. Johnson, J. Phys. Chem. 86 (1982) 3374. [8] T.-H. Tang, W.-J. Hu, D.-Y. Yan, Y.-P. Cui, J. Mol. Struct.
(Theochem) 207 (1990) 319.
[9] R.C.M.U. Ara´ujo, J.B.P. da Silva, M.N. Ramos, Spectrochim. Acta 51A (1995) 821.
[10] K.C. Lopes, F.S. Pereira, M.N. Ramos, R.C.M.U. Ara´ujo, Spec-trochim. Acta 57A (2001) 1339.
[11] A.K. Chandra, P. Sourav, A.C. Limaye, S.R. Gadre, Chem. Phys. Lett. 247 (1995) 95.
[12] K.C. Lopes, F.S. Pereira, R.C.M.U. Ara´ujo, M.N. Ramos, J. Mol. Struct. 565 (2001) 417.
[13] A.K. Chandra, M.T. Nguyen, Chem. Phys. 232 (1998) 299. [14] C. Moller, M.S. Plesset, Phys. Rev. 46 (1934) 618. [15] (a) A.D. Becke, J. Chem. Phys. 98 (1993) 5648;
(b) C. Lee, W. Yang, R.G. Parr, Phys. Rev. B 37 (1988) 785. [16] Frisch M.J., Trucks G.W.; Head-Gordon M., Gill P.M.W., Wong
M.W., Foresman J.B., Johnson B.G., Schlegel H.B., Robb M.A., Replogle E.S., Gomperts R., Andres J.L., Raghavachari K., Bink-ley J.S., Gonzales C., Martin R.L., Fox D.J., Defrees D.J., Baker J., Stewart J.J.P., Pople J.A., Gaussian 98W (Revision A11.2), Gaussian, Inc., Pittsburgh, PA, 2001.
[17] N.R. Kestner, J. Chem. Phys. 48 (1968) 252. [18] S.F. Boys, F. Bernardi, Mol. Phys. 19 (1970) 553.
[19] J. Emsley, O.P.A. Hoyte, R.E. Overill, J. Am. Chem., Soc. 100 (1978) 3303.
[20] L. Turi, J.J. Dannenberg, J. Phys. Chem. 97 (1993) 2488. [21] S.S. Xantheas, J. Chem. Phys. 104 (1996) 8821. [22] D. Feller, J. Chem. Phys. 96 (1992) 6104.
[23] J.J. Novoa, M. Planas, M.-H. Whangbo, Chem. Phys. Lett. 225 (1994) 240.
[24] W.T. King, G.B. Mast, J. Phys. Chem. 80 (1976) 2521.