Ana Bárbara de Sousa Carreira
Licenciada em Bioquímica
Mechanisms underlying intracellular delivery
Dissertação para obtenção do Grau de Mestre em Biotecnologia
Orientadora: Sara Figueiredo, Postdoctoral Research Fellow,
FCT/UNL
Co-orientador: Pedro Viana Baptista, Professor associado com
agregação, FCT/UNL
Júri:
Presidente: Professor Doutor Pedro Miguel Calado Simões Arguente: Doutor Pedro Miguel Martinho Borralho
Vogal: Doutora Sara Rute Carvalhal de Figueiredo
MECHANISMS UNDERLYING INTRACELLULAR DELIVERY
Copyright Ana Bárbara de Sousa Carreira, FCT/UNL, UNL
ACKNOWLEDGEMENTS
This work would not have been possible without the help of people and institutions that contributed to its accomplishment. I would like to specially thank:
Sara Figueiredo, my supervisor, for all the support and guidance, for endless discussions and constant support. For my personal a scientifically growth during this year, for trusting me this project and for believing in me. Thank you, I am grateful for this opportunity.
Professor Pedro V. Baptista, my co-supervisor, for once more giving the opportunity to develop a project in his working group. I would like to thanks for all the support, for my scientific growth he promoted during this project, and above all things for trusting me.
All members of the lab 315, Fábio Carlos, Milton Cordeiro, Raquel Vinhas, Rita Cabral, João Jesus, Ana Sofia, Pedro Pedrosa, Letícia Giestas, Miguel Larguinho, I would like to thank you for the awesome time in the lab, and for all the support and advisors.
Marisa e Rafaela, I would like to thank for friendship and companionship, for the support given in the good and especially in the bad moments. For all of this and much more, thank you!
My friends, for always being there and for all the relaxation moments.
My closest family, I would like to thank you for unconditional support and guidance, for all the patience, and for forgiven for all the time that I had been way.
Luís, for all love and affection, for all support and understanding.
RESUMO
AuNPs são utilizadas como sistemas versáteis em diversas aplicações na área da biomedicina, incluindo em entrega de fármacos e imagem celular. Estes sistemas são responsáveis pelo transporte de moléculas ativas, um passo considerado como um problema crucial em entrega de fármacos. Assim sendo, de forma a desenvolver AuNPs multifuncionais para aplicações específicas e eficientes, é necessário compreender o mecanismo pelo qual as AuNPs interagem com células vivas.
O principal objetivo deste trabalho consistiu na análise do mecanismo de internalização celular de AuNPs esféricas de 14 nm na linha celular A549, através de espectroscopia e microscopia de fluorescência em combinação com análise quantitativa obtida por ICP-MS. As AuNPs marcadas com TAMRA foram caracterizadas por espectroscopia de UV-visível e fluorescência, sendo obtido por DLS um diâmetro hidrodinâmico final de 22.5 ± 0.33 nm. Relativamente aos estudos de internalização celular, as AuNPs apresentaram uma rápida cinética de internalização celular, alcançando o ponto de saturação após 6 horas de incubação na linha celular A549. Estudos adicionais relacionados com o mecanismo de internalização destas AuNPs foram conduzidos utilizando inibidores específicos para cada via de endocitose. A inibição mais pronunciada foi obtida após utilização de clorpromazina, um inibidor de endocitose mediada por clatrina, resultando na diminuição da internalização de AuNPs em 23.5% após 1 hora de incubação. Este resultado preliminar obtido por espectroscopia de fluorescência indica a internalização destas AuNPs predominantemente por endocitose mediada por clatrina, sugerindo que outras vias de endocitose podem estar envolvidas na internalização celular destas AuNPs. Em termos de viabilidade celular, as AuNPs preparadas e os inibidores de endocitose não revelaram efeitos nefastos significativos na viabilidade celular da linha A549.
ABSTRACT
AuNPs are versatile systems used for different biomedical application including imaging, drug and gene delivery. These systems support the intracellular transport of active molecules, a step that is considered one of the crucial problems in drug delivery. Nevertheless, in order to design optimal multifunctional AuNPs for specific and efficient nanomedicine applications, the mechanism by which AuNPs interact with living cells must be fully understand.
The main goal of this work consisted in the assessment of the cellular uptake mechanism of 14 nm spherical AuNPs by A549 cells, through fluorescent spectroscopy and microscopy, in combination with quantitative analysis by ICP-MS. TAMRA labeled AuNPs were characterized by UV-visible and fluorescent spectroscopy and the final hydrodynamic diameter of 22.5 ± 0.33 nm was obtained by DLS. Regarding the cellular uptake studies, the AuNPs presented a fast cellular uptake kinetics reaching a saturation point after 6 hours of incubation in A549 cells. Further investigation concerning the internalization mechanism of this AuNPs was evaluated using specific inhibitors for different endocytic pathways. Optimal inhibition was achieved using chlorpromazine, inhibitor of clathrin-mediated endocytosis, resulting in a 23.5 % inhibition of AuNPs after 1 hour of incubation. This preliminary result obtained by fluorescent spectroscopy suggests that these AuNPs were predominantly uptake by clathrin-mediated endocytosis, meaning that other endocytic pathways must be involved in the cellular uptake of this AuNPs. In what cell viability is concern, the prepared AuNPs and the endocytic inhibitors revealed no significant effect on the cell viability in A549 cell line.
TABLE OF CONTENTS
Acknowledgements ...v
Resumo ... vii
Abstract... ix
Figures Index ... xiii
Tables Index ... xv
Abreviations ... xvii
I. Introduction ... 1
1. Nanotechnology ... 1
1.1. Nanomedicine ... 1
1.2. Gold nanoparticles ... 2
2. Internalization of gold nanoparticles ... 6
2.1. Factors affecting endocytosis of gold nanoparticles ... 6
2.2. Internalization mechanisms ... 7
2.3. Assessment of internalization mechanisms ... 11
3. Objectives ... 12
II. Materials and Methods ... 13
1. Synthesis of Gold Nanoparticles ... 13
2. Functionalisation of gold nanoparticles ... 13
2.1. AuNP@PEG ... 13
2.2. AuNP@PEG@TAMRA ... 14
3. TEM analysis ... 15
4. DLS analysis ... 15
5. UV-visible spectroscopy ... 15
6. Human cell culture ... 15
7. Uptake studies of AuNP@PEG@TAMRA ... 16
7.1. Evaluation of the uptake kinetics of AuNP ... 16
7.2. Fluorescence spectroscopy ... 17
7.3. Fluorescence microscopy ... 17
7.4. ICP-MS analysis ... 17
8.1. Single action of inhibition agents ... 17
8.2. Combinatory action of inhibition agents ... 18
9. Cell viability and cytotoxicity studies of AuNP formulation and pharmacological inhibitors ... 19
9.1. MTS assay ... 19
9.2. Cell count by trypan blue ... 20
9.3. Cell count by nucleus staining ... 21
10. Statistics analysis ... 21
III. Results and Discussion ... 23
1. Gold nanoparticles ... 23
1.1. Synthesis and characterization ... 23
1.2. Functionalization and characterization ... 24
2. Internalization of gold nanoparticles ... 27
2.1. Kinetics of cellular uptake ... 27
2.2. Mecanism of internalization ... 29
3. Cell viability and cytotoxicity of gold nanoparticles and endocytic inhibitors ... 35
IV. Conclusion and future prespectives ... 39
V. References ... 41
FIGURES INDEX
Figure I.1 - Different types of nanoparticles used in nanomedicine ... 1
Figure I.2 - Schematic representation of a multifunctional AuNP... 4
Figure I.3 - Classification of endocytosis based on the proteins that are involved in the initial uptake of particles and solutes ... 8
Figure I.4 - Schematic representation of phagocytosis ... 8
Figure I.5 - Schematic representation of clathrin-mediated endocytosis. ... 9
Figure I.6 - Schematic representation of caveolae-mediated endocytosis ... 10
Figure I.7 - Schematic representation of macropinocytosis ... 10
Figure II.1 - Reaction scheme of EDC coupling reaction ... 14
Figure II.2 - Schematic representations of the experimental protocol of the inhibition studies regarding the single action of inhibitions agents ... 18
Figure II.3 - Schematic representations of the experimental protocol of the inhibition studies regarding the combinatory action of inhibitions agents ... 19
Figure II.4 - Reaction scheme of MTS assy ... 20
Figure III.1 - Characterization of the synthesized AuNPs ... 24
Figure III.2 - Characterization of the pegylated AuNPs by UV-visible spectroscopy ... 25
Figure III.3 - Characterization of AuNP@PEG@TAMRA by UV-visible spectroscopy ... 26
Figure III.4 - Characterization of AuNP@PEG@TAMRA by fluorescence spectroscopy ... 26
Figure III.5 - Cellular uptake kinetics of AuNPs in A549 cell line ... 27
Figure III.6 - Cellular uptake of AuNPs in A549 cell line evaluated by fluorescent microscopy ... 28
Figure III.7 - Induction of AuNP aggregation by amiloride. ... 30
Figure III.8 - Effects of endocytic inhibitors on internalization of AuNPs in A549 cell line evaluated by fluorescent spectroscopy ... 31
Figure III.9 - Effects of endocytic inhibitors on internalization of AuNPs in A549 cell line evaluated by ICP-MS ... 32
Figure III.10 - Effects of combination of endocytic inhibitors on internalization of AuNPs in A549 cell line evaluated by fluorescent spectroscopy ... 33
Figure III.11 - Effects of combination of endocytic inhibitors on internalization of AuNPs in A549 cell line evaluated by ICP-MS ... 34
Figure III.12 - Cell viability in A549 cell after exposure to AuNPs obtained by MTS assay ... 35
Figure III.13 - Cell viability in A549 cell after exposure to AuNPs in presence and absence of endocytic inhibitors obtained by MTS assay. ... 36
Figure III.14 - Cell viability in A549 cell after exposure to AuNPs in presence and absence of endocytic inhibitors obtained by cell count by trypan blue ... 37
Figure III.15 - Cell viability in A549 cell after exposure to AuNPs in presence and absence of endocytic inhibitors obtained by cell count by nucleus staining. ... 37
TABLES INDEX
ABREVIATIONS
A549 Human lung carcinoma cell line AFM Atomic force microscopy AP Adaptor protein
AUC Area under the curve AuNPs Gold nanoparticles CCP Clathrin coated pits CCV Clathrin coated vesicles
CIE Clathrin-independent endocytosis CME Clathrin-mediated endocytosis CT Computed tomography DLS Dynamic light scattering
DMEM Dulbecco’s modified eagle medium EPR Enhanced permeability and retention FBS Fetal bovine serum
FDA Federation of food and administration FRET Förster resonance energy transfer
ICP-MS Inductively coupled plasma mass spectrometry MRI Magnetic resonance imaging
NP Nanoparticle
PEG Poly(ethylene) glycol
PET Positron emission tomography RT Room temperature
SPR Surface plasmon resonance
SERS Surface enhanced Raman spectroscopy SD Standard deviation
I.
INTRODUCTION
1. NANOTECHNOLOGY
Nanotechnology is an interdisciplinary field involving different research areas, namely biology, chemistry, engineering and medicine (Cai et al., 2008). It can be defined as the creation of useful and functional structures, devices and systems by controlling the matter at a nanometer scale (1 - 100 nm) (Daniel and Astruc, 2004). This field is based on the chemical synthesis of controllable size and shape nanoparticles with distinctive optical, electronic and magnetic properties (Chithrani et al., 2006). The development of these new materials with tunable properties prompted the growth of this field, and nanoparticles are nowadays used for a wide range of applications. In particular, the interest in using nanoparticles for biomedical applications, including in therapeutic and diagnostic applications, increased since their size scale is similar to functional components of living cell and biological molecules (ex. DNA and proteins) (Chithrani et al., 2006; Eustis and El-Sayed, 2006). The improvement of biomedical applications by using nanoparticles based systems, such as molecular diagnostics, drug and gene delivery and therapeutics, stimulated the foundation of a new emerge field, nanomedicine (Jain, 2008).
1.1.
NANOMEDICINE
Nanomedicine emerged from the application of nanotechnology to medicine (Jain, 2008), taking advantage of nanoscale size systems to improve diagnostics and therapeutics (Sahay et al., 2010). Liposomes (Park et al., 2004), quantum dots (Cai et al., 2006), carbone nanotubes (Liu et al., 2007), silver and gold nanoparticles (Huang et al., 2007) are examples of nanoparticles used in nanomedicine (Figure I.1).
Figure I.1 - Different types of nanoparticles used in nanomedicine. (A) Liposome; (B) Quantum dot; (C) Carbon nanotube; (D) Gold nanoparticles (Adapted from Cai et al., 2008).
simultaneously. Due to unique optical and physiochemical properties, gold nanoparticles (AuNPs) are one of the most common type of nanomedicines that has being extensively used for a variety of theranostic purposes, including cancer therapy, in vivo imaging and drug delivery. (Boisselier and Astruc, 2009; Cai et al., 2008; Lammers et al., 2011).
1.2.
GOLD NANOPARTICLES
Colloidal AuNPs first appeared in antiquity for decoration purposes due to their optical properties, in particular for staining glass. Scientifically, the first comprehensive studies report to Faraday (1857), which attributed the red color of gold nanoparticles to their colloidal nature, observing that colloidal gold had different properties from the bulk. Since then, colloidal gold gained increasing interest due to its remarkable features, providing the development of new devices and systems with countless potential applications in many biological fields, as molecular diagnostic, imaging, drug delivery and therapeutics (Baptista et al., 2008; Sperlinger et al., 2008; Boisselier and Astruc, 2009).
This increasing interest in study gold nanoparticles (AuNPs) is based on their exceptional characteristics, such as unique optical and electronic properties, high stability and biocompatibility, easy surface functionalization, and controllable size and shape in a scale range of 3 - 200 nm, leading to the development of a wide range of AuNPs based systems (Sperlinger et al., 2008; Boisselier and Astruc, 2009; Vigderman and Zubarev, 2013; Conde et al., 2014).
One of the most important characteristics of AuNPs is their surface plasmon resonance (SPR), resulting in great optical properties. The SPR effect is based on the collective oscillation of conduction electrons at the AuNP surface, generated by the interaction of electromagnetic wave in the electrons at the AuNP surface. This effect translates into high absorption coefficients and scattering properties, allowing the utilization of spectroscopic techniques for optical detection methods and biological imaging by microscopy techniques (Jain et al., 2006; Boisselier and Astruc, 2009). Typically, 14 nm spherical AuNPs present a SPR absorption band around at 520 nm. However, this band highly depends on size, shape, inter-particle distance and dielectric properties of environment of AuNPs (Baptista et al., 2008; Jain et al., 2006).
1.2.1. SYNTHESIS
The most commonly used methods for spherical AuNPs synthesis are based on the citrate reduction method first purposed by Turkevich in 1951 (Turkevich et al., 1951). In this method, citrate is used both as reducer and capping agent, and the AuNP diameter is achieved by carefully controlling the ratio citrate/gold. This method allows the synthesis of AuNPs with diameter within 9 - 120 nm range, where the increase of citrate promotes smaller particles. The citrate also allows the stabilization of AuNPs in solution and permits further functionalization, since it can be easily replaced by molecules with high affinity to gold, such as thiolated biomolecules (Baptista et al., 2008; Tiwari et al., 2011; Vigderman and Zubarev, 2013).
1.2.2. FUNCTIONALIZATION
Functionalization of AuNP enables the increase of their stability, functionality and biocompatibility, by adjusting the surface properties with the attachment of different type of molecules. It is important, however, that these modifications do not interfere with the properties of the AuNPs (DeLong et al., 2010; Conde et al., 2014). For biomedical purposes, AuNPs must be functionalized with other biomolecules, such as DNA/RNA oligonucleotides, fluorescent dye, peptides and/or antibodies, drugs and other molecules depending mostly on the final applications of AuNP-based systems (Conde et al., 2014). For in vitro and in vivo applications, AuNPs should be stabilized against aggregation induced by biological fluids. This stablization allows acquiring long plasma half-lives for improvement of gene and drug delivery. For this purpose, PEG (poly(ethylene glycol)) is the most frequently used macromolecule since it was the advantage to be considered nontoxic and was approved for internal use in humans by Food and Drug Administration (FDA) (Owens III and Peppas, 2006; DeLong et al., 2010; Conde et al., 2014). The attachment of PEG to the AuNP surface by a thiol group, which binds with great affinity to gold, prevents the adsorption of other molecules by steric effect, such as opsins. These plasma proteins are responsible for the recognition of foreign substances, including AuNPs, by macrophages and monocytes from reticuloendothelial system (RES), and consequently responsible for the rapid removal of nanoparticles from circulation. The mechanism of action by which PEG prevents opsonization and increases circulation time is based on the formation of a sterically hindered by the hydrophilic coating, creating a shield against the binding of opsins. Moreover, chain flexibility of PEG induces a flexible and rapidly change of conformation, making difficult the interaction of opsins with the surface of AuNPs (Owens III and Peppas, 2006; Jokerst et al., 2012). By avoiding the adsorption of this type of molecules, pegylated AuNPs (AuNP@PEG) became more stable in biological environments and acquired longer systemic circulation (Sperlinger et al., 2008; Dreaden et al., 2012; Conde et al., 2014).
Through this functionalization, the PEG chains allow further attachment of other biomolecules as for example tumor markers, drugs and fluorescent dyes. The easy surface modification of AuNPs with such different moieties together with their remarkable optical properties make AuNPs outstanding platforms for the development of theranostic systems for multiple applications (Figure I.2) (Conde et al., 2012).
Figure I.2 - Schematic representation of a multifunctional AuNP. These multifunctional systems carry fluorescent dyes that are used for tracking and contrast agents. Nucleic acids (RNA and DNA) for gene silencing and colorimetric assays. Drug molecules and aptamers for delivery applications. PEG and antibodies to improve the AuNP circulation and targeting(Conde et al., 2014).
1.2.3. GOLD NANOPARTICLES IN NANOMEDICINE
Multifunctional AuNPs have been studied for theranostic applications, combining imaging, diagnostics and therapy. The development of these new systems aims to overcome the problems related to traditional drug delivery and therapeutic approaches, including inefficient delivery of the therapeutic agent, and inability to overcome biological barriers. Moreover theranostic nanomedicines allowed a noninvasive assessment of drug delivery and release, in combination with evaluation of therapeutic response and target site accumulation (Lammers et al., 2011; Cabral and Baptista, 2014; Vinhas et al., 2015).
AuNPs had been used in a diverse number of areas, such as in vitro assays, in vitro and in vivo imaging, cancer therapy and drug delivery. Oligonucleotide capped AuNPs had been used for nucleotide and protein detection using differently characterized mechanisms, including colorimetric detection using UV-visible spectroscopy and atomic force microscopy (AFM) (Cai et al., 2008). Moreover, AuNPs had been used as imaging agents for in vitro and in vivo imaging due not only to their intrinsic unique optical properties but also through their ability to be conjugated with contrast agents. Light scattering imaging, x-ray computed tomography (CT), surface-enhanced Raman spectroscopy (SERS) and magnetic resonance imaging (MRI) are some examples of imaging modalities that can use AuNPs as contrast agents (Lammers et al., 2011; Cabral and Baptista, 2014). In cancer therapy area, AuNPs had been used in photothermic therapy for destruction of cancer cells caused by increasing the intracellular temperature up to 70-60 induced by light absorption by AuNPs (Zharov et al., 2006). Additional AuNPs functionalized with small molecules, including TNF-α, tamoxifen and doxorubicin, have been for drug delivery and anti-cancer therapeutics (Cai et al., 2008; Cabral and Baptista, 2014).
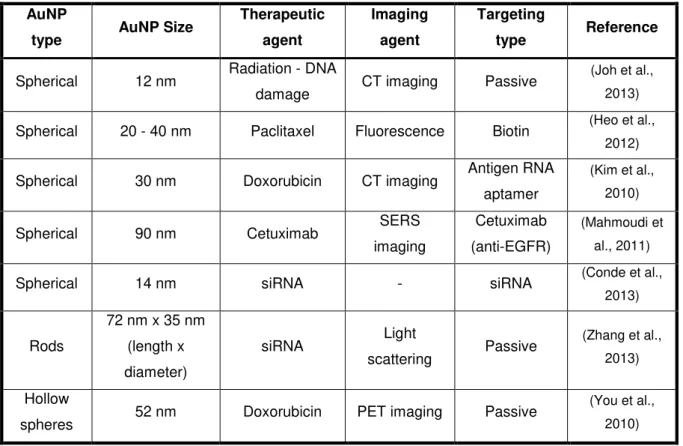
More recently, several AuNPs based systems had been used for theranostic applications. In Table I.1 are listed some examples of AuNP based systems.
Table I.1 - Examples of AuNPs used in theranostic applications. Adapted from Cabral and Baptista, 2014; Vinhas et al., 2015.
AuNP
type AuNP Size
Therapeutic
agent
Imaging
agent
Targeting
type Reference
Spherical 12 nm Radiation - DNA
damage CT imaging Passive
(Joh et al., 2013) Spherical 20 - 40 nm Paclitaxel Fluorescence Biotin (Heo et al.,
2012) Spherical 30 nm Doxorubicin CT imaging Antigen RNA
aptamer
(Kim et al., 2010) Spherical 90 nm Cetuximab SERS
imaging
Cetuximab (anti-EGFR)
(Mahmoudi et al., 2011) Spherical 14 nm siRNA - siRNA (Conde et al.,
2013)
Rods
72 nm x 35 nm (length x diameter)
siRNA Light
scattering Passive
(Zhang et al., 2013) Hollow
spheres 52 nm Doxorubicin PET imaging Passive
(You et al., 2010)
biocompatibility. In order to continue to develop these nanosystems and translate them to clinical approaches, a crucial point is yet necessary to understand - the mechanism by which AuNPs interact with biological systems, in particular with living cells (Cabral and Baptista, 2014; Oh and Park, 2014).
2. INTERNALIZATION OF GOLD NANOPARTICLES
Inappropriate delivery of therapeutic agents by traditional approaches led to inefficient therapeutics. As response, nanomedicine has led to the improvement of this therapeutics, by developing multifunction AuNPs as vectors for drug delivery, diagnostics and imaging applications (Cabral and Baptista, 2014). For drug delivery applications, AuNPs must interact with a specific cell population or with a specific intracellular compartment. To improve the delivery of therapeutic agents with AuNPs, their pharmacokinetics and biocompatibility must be first understood. Furthermore, it is necessary to keep in mind that each AuNP conjugate has unique properties that are directly related to the biocompatibility of AuNPs (Sahay et al., 2010; Cabral and Baptista, 2014).
Therefore, it has become increasingly necessary to understand how AuNPs interact with living cells and biological systems, i.e. the internalization mechanism of AuNPs (Cabral and Baptista, 2014; Oh and Park, 2014). Moreover, it is important to study how to direct AuNPs to a specific intracellular compartment depending on their final application. The study of cellular uptake of these nanomaterials is essential for assessing nanoparticle toxicity, to learn how to improve the accumulation of AuNPs in cells and tumors, and more important how to design more efficient nanoparticles (size, shape and surface chemistry) (Chithrani et al., 2006). The ability to control and manipulate the accumulation of these nanoparticles inside a cell can improve diagnostic and therapeutic efficiency (Chithrani and Chan, 2007). In order to advance nanotechnology for biomedical purposes, quantitative and qualitative studies on internalization mechanism of AuNPs are essential. Research suggests that cellular uptake of nanomaterials is dependent on their physicochemical characteristics, including size, shape and surface chemistry, as well on cell type (Sahay et al., 2010; Oh and Park, 2014).
2.1.
FACTORS AFFECTING ENDOCYTOSIS OF GOLD NANOPARTICLES
2.1.1. SIZE
receptors (Chithrani and Chan, 2007; Zhao et al., 2011). However, to determine the influence of nanoparticles size in their cellular uptake with accuracy, stability and uniformity of size distribution of AuNPs must be guaranteed (Chithrani, 2010; Sahay et al., 2010).
2.1.2. SHAPE
AuNPs’ shape is another property that influences their cellular uptake. A simple comparison between spherical AuNPs and gold nanorods with similar sizes demonstrated that spherical AuNPs are more easily internalized than rod-shaped AuNPs. This circumstance can be attributed to a longer time of membrane wrapping during rod-shaped particles cellular uptake (Chithrani et al., 2006; Zhao et al., 2011).
2.1.3. SURFACE CHARGE
The nanoparticles surface charge can be determined by the biomolecules attached to their surface. AuNPs positively charged had higher uptake efficiency than neutral and negatively charged AuNPs (Cho et al., 2009). The positively charged nanoparticles stick to the negatively charge plasma membrane, improving the cellular uptake. Furthermore, the cellular uptake of AuNPs could be facilitated by the interaction with molecules at the membrane surface (Chithrani, 2010).
2.2.
INTERNALIZATION MECHANISMS
Endocytosis is a crucial process used by all types of mammalian cells to communicate with the biological environment. This is an energy-dependent process through which cells internalize molecules and ions, namely nutrients. However, its function is not restricted to the uptake of nutrients and signaling molecules, playing an important role on cell motility and inter-cell communication (Canton and Battaglia, 2012; Oh and Park, 2014).
The traditional classification of endocytic pathways is divided into two broad categories - phagocytosis, the uptake of large particles (cell eating), and pinocytosis, the uptake of fluids and solutes (cell drinking). The division of pinocytosis pathways is still a topic under ongoing research. The latest division is based on the proteins and lipids involved in the uptake process, being sub-divided into clathrin-mediated endocytosis (CME) and clathrin-independent endocytosis (CIE). This last category is divided in caveolae-mediated endocytosis, macropinocytosis and clathrin/caveolae independent endocytosis (Sahay et al., 2010). Figure I.3 illustrates a schematic representation of the different internalization mechanisms.
Figure I.3 - Classification of endocytosis based on the proteins that are involved in the initial uptake of particles and solutes. Adapted from (Sahay et al., 2010).
2.2.1. PHAGOCYTOSIS
Phagocytosis is an endocytic pathway only performed by specialized phagocytic cells, as macrophages and dendritic cells. This pathway is responsible for the internalization of pathogens, dead cells and cell debris and consists in a non-specific process to internalize fluids and large size particles, generally larger than 5 µm (Oh and Park, 2014). Mechanically, phagocytosis is initiated by the specific recognition of the particles by receptors at the surface of cell membrane. This recognition induces a membrane distortion that surrounds the particle, and engulfs it, resulting on the formation of a phagosome. Then this phagosome matures, fuses with lysosomes leading to degradation - see Figure I.4 (Ivanov, 2008; Sahay et al., 2010; Canton and Battaglia, 2012). One typical biological example of phagocytosis is the attained after the opsonization of foreign bodies and pathogens performed by immune cells (Canton and Battaglia, 2012).
2.2.2. PINOCYTOSIS
2.2.2.1. CLATHRIN-MEDIATED ENDOCYTOSIS
Clathrin-mediated endocytosis is the most studied internalization mechanism, being the principal endocytic pathway responsible for nutrient uptake and allows the internalization of nanoparticles with size up to 150 - 200 nm (Sahay et al., 2010; Zhao et al., 2011). This process is initiated by the binding of particles at the membrane surface, triggered the formation of clathrin coated pits (CCP). After invagination, these coated pits are pinched off from the cell membrane by a small GTPase (dynamin), forming clathrin coated vesicles (CCV). Then clathrin present on these vesicles depolymerizes, and particles become clustered into endosomes. At this point, the endosome containing particles can fuse with lysosome and degradation is initiated. On the other hand, particles can be released to the cytosol and bypass degradation in some cases - see Figure I.5. Clathrin is a cytosolic protein responsible for the formation of the coated pits, in association with adaptor proteins (APs), which are responsible for coordinate the clathrin nucleation near the membrane location where particles are internalized (Ivanov, 2008; Sahay et al., 2010; Canton and Battaglia, 2012).
Figure I.5 - Schematic representation of clathrin-mediated endocytosis. (1) Uptake of nanoparticles into clathrin coated pits; (2) Clathrin coat pit pinched off from plasma membrane by dynamin; (3) Nanoparticle internalization into clathrin coated vesicles; (4) Endosomes; (5) Recycling of coat constituents; (6) Endosome release of nanoparticles; (7) Fuse with lysosome; (8) Degradation.
2.2.2.2. CAVEOLAE-MEDIATED ENDOCYTOSIS
the endosomal cargo into the cytoplasm (Rejman et al., 2005; Sahay et al., 2010; Canton and Battaglia, 2012).
Figure I.6 - Schematic representation of caveolae-mediated endocytosis. (1) Binding of nanoparticles to lipid raft formed by caveolae; (2) Nanoparticle internalization into caveosomes that are pinched off from plasm membrane by dynamin; (3) Endosome; (4) Recycling of caveosome contains; (5) Endosome release of nanoparticles; (6) Fuse with lysosome; (7) Degradation.
2.2.2.3. MACROPINOCYTOSIS
Macropinocytosis is a clathrin/caveolae independent pathway, which is triggered by the tyrosine kinase receptor activation by growth factors (Sahay et al., 2010). This endocytic mechanism can internalize particles with size up to 5 µm (Zhao et al., 2011). This process comprises the engulfment of a large quantity of external fluid through the formation of waving sheet-like extensions of the plasma membrane, forming large vesicles called macropinosomes - see Figure I.7 (Sahay et al., 2010).
2.3.
ASSESSMENT OF INTERNALIZATION MECHANISMS
Currently, three different methods can be used to study the internalization mechanism of nanoparticles: (1) colocalization of intracellular nanoparticles with endocytic markers (Balasubramanian et al., 2009) (2) knockdown of specific endocytic proteins by siRNA (Mayor and Pagano, 2007) and (3) specific exclusion of internalization pathway by endocytic inhibitors.
The assessment of colocalization of intracellular nanoparticles is based on differential labeling of intracellular organelles and compartments, such as endosomes, lysosomes, caveolae and clathrin-coated pits. However, false colocalization can be obtained if the fluorescent markers show continuous areas of fluorescence that overlap with fluorescent signaling from other marker (Iversen et al., 2011). The use of siRNA for knockdown specific endocytic proteins has been used to study a specific endocytic pathway. Nevertheless, the siRNA treatment may be considered time consuming since protocols can take 2-5 days and may result in undesirable cellular changes that can negatively influence the results. Moreover, the down-regulation of one internalization mechanism can lead to up-regulation of another endocytic pathway (Sahay et al., 2010; Iversen et al., 2011).
Although the previous two methods have been performed, the employment of endocytic inhibitors continues to shows several advantages over the molecular biological methods, including exposure of inhibitors to cells for a short period of time (30 min - 1 h), the knowledge that all cell are equally affected by inhibitors, and the fact that the use of endocytic inhibitors are the most affordable approach (Ivanov, 2008). It is known, however, that the use of these inhibitors to study internalization mechanisms of nanoparticles is based on the assumption that each inhibitor has a specific influence on a single endocytic pathway.
Chlorpromazine and potassium depletion are two different approaches frequently used for the inhibition of clathrin-mediated endocytosis. Chlorpromazine is an amphipathic molecule responsible for the loss of clathrin and adaptor protein on the cell surface and consequently the impossibility to assemble the clathrin coated pits at the plasma membrane surface. The method of potassium depletion consists in a hypotonic treatment followed by incubation in potassium-free medium. This approach is responsible for removable of clathrin lattices from the plasma membrane (Ivanov, 2008; Vercauteren et al., 2010). Filipin and nystatin are two inhibitors of caveolae-mediated endocytosis. These inhibitors interact with cholesterol, changing the properties of cholesterol-rich membrane domains, and as result interfering with the formation of flask-shaped invagination responsible for the uptake of nanoparticles (Ivanov, 2008).
Although the use of endocytic inhibitors has several advantages, their specific to a single internalization route has been questioned (Ivanov, 2008; Sahay et al., 2010; Vercauteren et al., 2010; Iversen et al., 2011). Therefore, for more straight results, combination of different methods should be considered.
3. OBJECTIVES
The use of nanoparticles for biomedical applications has increased in the current times. In order to improve the efficiency of intracellular delivery by nanoparticles, the biological interaction between nanoparticles and cells needs to be fully understood. The main goal of this work was to assess the internalization mechanism of AuNPs, a nanosystem whose interest has goon, by fluorescent spectroscopy and microscopy. In order to achieve this objective, several tasks were set:
i. Synthesis of gold nanoparticles.
ii. Functionalization and characterization of AuNPs with PEG and a fluorescent dye. iii. Evaluation of the uptake of the functionalized AuNPs as function of time.
iv. Assessment of the internalization mechanism of the functionalized AuNPs.
II.
MATERIALS AND METHODS
1. SYNTHESIS OF GOLD NANOPARTICLES
The 14 nm AuNPs were synthetized by the citrate reduction method adapted from Lee and Meisel (Lee and Meisel, 1982), as described elsewhere (Conde et al., 2012).
All glass materials used during the synthesis were previously immersed in aqua regia (1:3 HNO3:HCl)
overnight and then washed with distilled H2O and mili-Q H2O (18.2 MΩ.cm-1 at 25 °C). All solutions
were prepared in mili-Q H2O.
In a 500 mL round bottom flask, 250 mL of 1 mM HAuCl4 (Sigma, MW 393.83 Da) were brought to boil
with vigorously stirring. When in reflux, 25 mL of 38.8 mM of sodium citrate (Sigma, MW 294.10 Da) were rapidly added and kept refluxing for 20 minutes with continuous stirring. After that, the solution was left to cool at room temperature (RT) with continuous stirring and then stored in a 500 mL Erlenmeyer, protected from light, at RT.
Synthetized AuNPs were characterized by Transmission Electron Microscopy (TEM) and Dynamic Light Scattering (DLS), and their concentration was determined by UV-visible Spectroscopy.
2. FUNCTIONALISATION OF GOLD NANOPARTICLES
2.1.
AuNP@PEG
AuNPs were functionalized with a hetero-functional PEG (poly(ethylene glycol)) molecule (Iris BIOTECH, MW 458.57 Da) containing a thiol group at one end and a carboxyl group at the other end of the molecule - HS-EG(8)-COOH.
In order to achieve the complete saturation of PEG on the surface of AuNPs, increased concentrations of PEG were added to a fixed amount of AuNPs. Briefly, 10 nM of AuNPs were mixed with a range of concentration of 0 - 0.1 mg.mL-1 PEG and 0.028 % (v/v) SDS (sodium dodecyl sulfate) (Sigma, MW
288.38 Da) in aqueous conditions. Then the samples were left 16 hours at RT with continuous stirring on a GLF 3016 shaker. To remove the excess of PEG chains that did not functionalized the AuNP surface, the mixtures were centrifuged three times for 45 minutes at 14000 g, at 4°C, where the supernatants were removed to new eppendorfs and replaced by mili-Q H2O. The three resulting
supernatants were also centrifuged under the same previously conditions, and then the remaining
thiolated chains of PEG were quantified by Ellman’s assay.
In Ellman’s assay the thiol groups presented in the supernatants react with DTNB (5,5’
-dithiobis-(2-nitrobenzoic acid)), (Sigma, MW 396.35 Da) giving a yellow solution which can be quantified in a spectrophotometer, measuring the absorbance at 412 nm.
and 211.45 mM NaH2PO4 (Sigma, MW 119.98 Da) - and 7 µL of 2 mg.mL-1 DTNB prepared in 0.5 M
phosphate buffer pH 7.0. After this, the plate was left at RT for 10 minutes, and then the absorbance was measured from 290 nm to 600 nm in an Infinite M200 microplate reader (Tecan, Switzerland). Under the same conditions, a calibration curve was set in a range of 0 - 0.5 mg.mL-1 of PEG, in which the
supernatant was replaced by a standard solution of PEG at increased concentrations. The excess thiolated chains in each supernatant can be quantified by interpolating the calibration curve.
In the current work, the AuNPs were functionalized with 0.01 mg.mL-1 of PEG.
The AuNP@PEG were characterized by DLS and, and their concentration determined by UV-visible spectroscopy.
2.2.
AuNP@PEG@TAMRA
AuNP@PEG were further functionalized with a fluorescent dye, TAMRA (tetramethylrhodamine cadaverine) (Life Technologies, MW 514.623 Da) by EDC (1-ethyl-3-(3-dimethylaminopropyl)-carbodiime) and sulfo-NHS (sulfo-hydroxysuccinimide) coupling reaction (Figure II.1).
Figure II.1 - Reaction scheme of EDC coupling reaction. In presence of sulfo-NHS, EDC converts carboxyl groups to amine-reactive sulfo-NHS esters. The addition of sulfo-NHS stabilizes the amine reactive intermediated (Conde et al., 2014).
For this functionalization, a master mix was prepared containing 21 nM AuNP@PEG, 1.25 mg.mL-1
sulfo-NHS (Sigma, MW 217.13 Da) and 0.312 mg.mL-1 EDC (Sigma, MW 191.70 Da) in 2.5 mM MES
buffer pH 5.9 (Sigma, MW 195.24 Da). The master mix was incubated for 30 minutes at RT with continuous stirring, and then centrifuged at 14000 g for 30 minutes at 4°C. The supernatant was removed, and replaced by 2.5 mM MES buffer pH 5.9, in equal volume. Then TAMRA was added to the mixture at a final concentration of 10-7 M, and the final mixture was incubated at RT for 16 hours with
continuous stirring.
in equal volume, and later, supernatants were also centrifuged under the previous described conditions. Excess of TAMRA was quantified in all supernatants by fluorescent spectroscopy. The fluorescent intensity measurements were performed at RT using a Cary Eclipse Fluorescence spectrophotometer at excitation wavelength of 543 nm and recorded in a frequency range of 550 - 700 nm, at 600 nm/min with a photomultiplier potency of 600 V, using quartz cells with 1 cm of excitation path (105.254-QS, Hellma, Germany). Under the same conditions, a calibration curve was prepared in a range of 0 - 10-7
M of TAMRA in 2.5 mM MES buffer pH 5.9, and the fluorescent intensity was measured using the previous settings. Excess TAMRA was quantified by interpolating the calibration curve.
AuNP@PEG@TAMRA were characterized by and DLS and, their concentration determined by UV-visible spectroscopy, and fluorescent intensity was measured by fluorescent spectroscopy.
3. TEM ANALYSIS
TEM analysis were performed in Instituto de Ciência e Engenharia de Materiais e Superfícies (ICEMS/IST), Portugal, with a HITACHI H-8100 microscope operated at 200 kV. Samples were prepared by depositing 10 µL of the prepared colloidal suspensions in carbon copper grids, washed twice with 10 µL of milli-Q H2O and air dried. Particles size and shape were determined by analyzing the TEM pictures
using the image software ImageJ.
4. DLS ANALYSIS
The hydrodynamic diameter of all synthetized AuNPs was determined by DLS using a Nanoparticle Analyser SZ-100 (Horiba Scientific, Japan) at 25 °C, with a scattering angle of 90°. All AuNPs samples were prepared under sterile conditions, at a final concentration of 2 nM. For each sample 6 measures were performed.
5. UV-VISIBLE SPECTROSCOPY
All synthetized AuNP were characterized using an UV-visible spectrophotometer (UVmini-1240, Shimadzu, Germany). Absorbance measurements were carried out using 100 µL of volume quartz absorption cells with 1 cm optical path (105.202-QS, Hellma, Germany).
6. HUMAN CELL CULTURE
flasks (SPL) in a CO2 incubator (Sanyo, Japan) at 37 °C in a 99 % humidified atmosphere of 5 % (v/v)
CO2.
Cell culture medium was renewed at approximately 80 % of confluence. Briefly, culture medium was aspired, 2 mL trypsin (Invitrogen) were added and incubated for 5 minutes at 37 °C in a 99 % humidified atmosphere of 5 % (v/v) CO2. After that, loss of cells adherence was confirmed using an inverted
microscope (Nikon TMS), and 8 mL of DMEM were added to the culture flask to neutralize the trypsin. Approximately 1 mL of this solution was added to a new 75 cm2 culture flask, containing 13 mL of DMEM,
and maintained under the conditions previous described. The remaining cell solution was used in further assays or discarded.
7. UPTAKE STUDIES OF AuNP@PEG@TAMRA
7.1.
EVALUATION OF THE UPTAKE KINETICS OF AuNP
In order to study the uptake kinetics of the functionalized AuNPs, uptake experiments were performed in A549 cells as function of time.
7.1.1. CELL COUNT ASSAY BY TRYPAN BLUE
The number of viable cells was assessed by trypan blue assay. Briefly, a solution containing 40 µL of 0.4 % (m/v) trypan blue (Sigma) and 10 µL of cell suspension was positioned on a hemocytometer (Hirschmann, Germany), and the number of viable cells was determined by visualization on an inverted microscope. Trypan blue is a blue dye that can trespass the plasma membrane of non-viable cells, which plasma membrane is more permeable (Strober, 2001). The resulting cell density was determined according to Equation II.1:
𝑁º 𝑜𝑓 𝑉𝑖𝑎𝑏𝑙𝑒 𝐶𝑒𝑙𝑙𝑠. 𝑚𝐿−1=Ʃ𝑐𝑒𝑙𝑙𝑠 𝑝𝑒𝑟 𝑞𝑢𝑎𝑑𝑟𝑎𝑛𝑡
4 × 10⁴ (𝐶ℎ𝑎𝑚𝑏𝑒𝑟 𝑉𝑜𝑙𝑢𝑚𝑒) × 𝑑𝑖𝑙𝑢𝑡𝑖𝑜𝑛 𝑓𝑎𝑐𝑡𝑜𝑟 (𝐈𝐈. 𝟏)
7.1.2. CELL SEEDING FOR AuNP@PEG@TAMRA
Subsequently to the determination of the number of viable cells, A549 cells were seeded at a density of 2.5 x 10⁴ cells/well in a 24-well plate (SPL) in a total volume of 500 µL. Cells were maintained at 37 °C
in a 99 % humidified atmosphere of 5 % (v/v) CO2 for 24 hours prior to AuNP incubation. After 24 hours,
when cells reached monolayer, medium was removed, and 300 µL of 10 nM AuNP@PEG@TAMRA prepared in DMEM were added to each well.
7.2.
FLUORESCENCE SPECTROSCOPY
After each period of incubation, culture medium containing AuNPs was removed, and cells were washed twice with bicarbonate Krebs-Ringer buffer (Salomon and Ehrhardt, 2010) (KRB, composed of 15 mM HEPES, 116.4 mM NaCl, 5.4 mM KCl, 0.78 mM NaH2PO4, 25 mM NaHCO3, 1.8 mM CaCl2, 0.81 mM
MgSO4 and 5.55 nM glucose, pH 7.4) and lysed with a 1 % (v/v) solution of Triton X-100 prepared in
KRB buffer, pH 7.4.
The fluorescence intensity of each lysate was measured by fluorescence spectroscopy. All measurements were performed at RT, at excitation wavelength of 543 nm and recorded in a frequency range of 550 - 700 nm, at 30 nm/min with a photomultiplier potency of 800 V.
7.3.
FLUORESCENCE MICROSCOPY
A549 cells were seeded at a density of 1 x 10⁵ cells/well in a 24-well plate in a total volume of a 500 µL.
Cells were left to growth for 24 hours as described in Section II.7.1.2. Prior to cell seeding sterilized cover slips were placed at the bottom of each well. After 24 hours, cells were incubated as described in Section II.7.1.2, for the same period of time.
After each incubation period, culture medium was removed, and cells were washed twice with PBS 1x, and then fixed with 4% solution of paraformaldehyde in PBS for 15 minutes. Then, cells were washed three times with PBS 1x and mounted in ProLong Gold Antifade Reagent with DAPI (Invitrogen) to allow nuclear staining. Slides were visualized in a Olymous BX51 fluorescent microscope with an attached Olympus DP50 camera.
7.4.
ICP-MS ANALYSIS
The quantification of gold in cell lysates was evaluated by ICP-MS, performed at Laboratório de Análises - Serviço de Espectroscopia de Emissão Atómica at Departamento de Química at FCT-UNL.
After cellular uptake, cell lysates were digested in fresh aqua regia for 48 hours. All samples were measured only once.
8. INHIBITION STUDIES WITH PHARMACOLOGICAL INHIBITORS
8.1.
SINGLE ACTION OF INHIBITION AGENTS
A549 cells were seeded at the same density and conditions as described in Section II.7.1.2.
After 24 hours, cells were pre-treated with following endocytic inhibitors in DMEM for 30 minutes at 37°C in a 99 % humidified atmosphere of 5 % (v/v) CO2 - 300 nM wortmannin (Sigma, MW 428.43), 1.53 µM
with a solution containing 10 nM of AuNP@PEG@TAMRA in combination with each individual inhibitor (continuous inhibition).
The inhibition studies were carried out for 1, 3 and 6 hours. After these periods, the AuNP uptake was assessed by fluorescence spectroscopy and microscopy, and by ICP analysis, as described in Section II.7.2, Section II.7.3 and Section II.7.4, respectively, - see Figure II.2.
Figure II.2 - Schematic representations of the experimental protocol of the inhibition studies regarding the single action of inhibitions agents. Treatment with endocytic inhibitors 30 min before the addition of AuNPs, followed by the assessment of AuNPs internalization in presence of endocytic inhibitors by fluorescent spectroscopy and ICP.
8.2.
COMBINATORY ACTION OF INHIBITION AGENTS
A549 cells were seeded at the same density and conditions as described in Section II.7.1.2.
After 24 hours, cells were pre-treated with four combinations of the previous endocytic inhibitors in DMEM for 30 minutes at 37 °C in a 99 % humidified atmosphere of 5 % (v/v) CO2 - wortmannin + filipin,
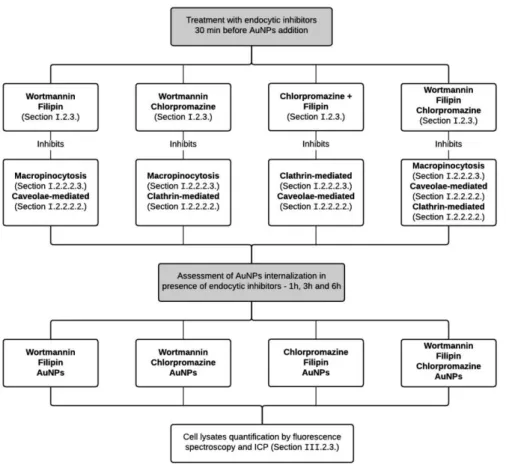
wortmannin + chlorpromazine, filipin + chlorpromazine and wortmannin + filipin + chlorpromazine. Subsequently, the culture medium was removed and replaced with a solution containing 10 nM of AuNP@PEG@TAMRA in addition with each inhibitor combination (continuous inhibition).
Figure II.3 - Schematic representations of the experimental protocol of the inhibition studies regarding the combinatory action of inhibitions agents. Treatment with endocytic inhibitors 30 min before the addition of AuNPs, followed by the assessment of AuNPs internalization in presence of endocytic inhibitors by fluorescent spectroscopy and ICP.
9. CELL VIABILITY AND CYTOTOXICITY STUDIES OF AUNP FORMULATION
AND PHARMACOLOGICAL INHIBITORS
9.1.
MTS ASSAY
The cytotoxicity of the AuNP formulation and endocytic inhibitors was evaluated using the MTS assay (CellTiter 96® Aqueous Non-Radioactive Cell Proliferation Assay, Promega, USA).
Figure II.4 - Reaction scheme of MTS assy. In presence of metabolically active cells, MTS is converted to formazan by metabolically enzymes, a brown product, which formation can be measured spectroscopically.
Therefore, the quantity of formazan produced is directly proportional to the number of metabolically active cells, and so, the cell viability of each sample can be obtained according to Equation II.2.
𝐶𝑒𝑙𝑙 𝑉𝑖𝑎𝑏𝑖𝑙𝑖𝑡𝑦 (%) = 𝐶𝑜𝑛𝑡𝑟𝑜𝑙 𝑎𝑏𝑠𝑜𝑟𝑏𝑎𝑛𝑐𝑒 𝑎𝑡 490 𝑛𝑚 × 100 (𝐼𝐼. 2)𝑆𝑎𝑚𝑝𝑙𝑒 𝑎𝑏𝑠𝑜𝑟𝑏𝑎𝑛𝑐𝑒 𝑎𝑡 490 𝑛𝑚
A549 cells were seeded at a density of 7.5x10³ cells/well in a 96-well plate. Cells were left to growth for
24 hours at 37 °C in a 99 % humidified atmosphere of 5 % (v/v) CO2. After 24 hours, cells were incubated
with a range of AuNP concentrations (0 - 20 nM) for 24 hours at 37°C in a 99 % humidified atmosphere of 5 % (v/v) CO2. Subsequently to this period of incubation, culture medium containing the AuNPs was
removed and replaced by fresh medium, and cells were incubated for another 24 hours at 37 °C in a 99 % humidified atmosphere of 5 % (v/v) CO2. After that, a mixture of DMEM, MTS and PMS in a ratio of
100:20:1 was added to each well and cells were incubate for 40 minutes at 37°C in a 99 % humidified atmosphere of 5 % (v/v) CO2. Then the absorbance was measured by Tecan Infinite F200 Microplate
Reader (Tecan, Switzerland) at 490 nm. The percentage of cell viability for each sample was obtained accordingly to Equation II.2.
To assess the cytotoxicity of the different endocytic inhibitors, A549 cells were seeded at a density of 7.5x10³ cells/well in a 96-well plate. Cells were left to growth for 24 hours at 37°C in a 99 % humidified
atmosphere of 5 % (v/v) CO2. After 24 hours, cells were incubated with AuNP and different endocytic
inhibitors as described in Section II.8.1. Subsequently to this period of incubation, the procedure is equal to the one described above.
9.2.
CELL COUNT BY TRYPAN BLUE
at 37 °C in a 99 % humidified atmosphere of 5 % (v/v) CO2. Next, 300 L of culture medium was added
and the number of viable cells was determined as described in Section II.7.1.1.
9.3.
CELL COUNT BY NUCLEUS STAINING
A549 cells were incubated as mentioned in Section II.8.1. After each incubation period, culture medium was removed, and cells were washed twice with PBS 1X, and then were fixed with 4% solution of paraformaldehyde in PBS for 15 minutes. Then, cells were washed three times with PBS 1x and mounted in ProLong Gold Antifade Reagent with DAPI (Invitrogen) to allow nuclear staining.
In order to assess the cell viability, every nucleus with normal morphology was counted.
10. STATISTICS ANALYSIS
III.
RESULTS AND DISCUSSION
1. GOLD NANOPARTICLES
Noble nanoparticles are considered a key tool to a variety of biomedical applications, including diagnostic assays (Baptista et al., 2008; Selvan, Yang et al., 2010) and drug and gene delivery (Yavuz et al., 2009). In particular AuNP-based systems can be used simultaneously for diagnostic and therapeutic - theranostics (Xie et al., 2010). This noble metal exhibits broad distinctive characteristics, such as great optical properties, easy to synthetize and easy surface functionalization with biocompatible polymers that enhance their in vivo circulation necessary for therapeutic applications (Bhattacharyya et al., 2011). Therefore, AuNPs are becoming an interesting system and so the understanding of their internalization mechanism and cellular interactions is essential to enhance the expected outcome.
1.1.
SYNTHESIS AND CHARACTERIZATION
Stable AuNPs were successfully synthetized by the citrate reduction method (Lee and Meisel, 1982). In this method, citrate molecules are used both as reduction agent and capping agent. In this work, 14 nm spherical AuNPs synthetized were characterized by UV-visible spectroscopy, dynamic light scattering (DLS) and transmission electron microscopy (TEM).
UV-visible spectroscopy allows the characterization of the AuNPs optical properties as result of their surface plasmon resonance (SPR). The SPR effect depends on the size, shape and inter-particle distance, and also on the surrounding media (Hu et al., 2006). This property gives AuNP high absorption coefficients with a typical SPR absorption band centered around 519 nm for spherical 14 nm AuNPs (Jain et al., 2006). As Figure III.1C shows, the obtained AuNP dispersion displayed a single absorption band with a maximum plasmon peak at 518 nm, typical of spherical 14 nm AuNPs. Also, the obtained absorption spectrum is symmetrical at the SPR peak (518 nm) indicating the presence of monodisperse spherical AuNPs in the colloid solution (Shi et al., 2012). This data also allows the quantification of the AuNPs concentration by the Lambert-Beer law, assuming an absorption coefficient of 2.33 x 10⁸ M-1.cm -1 for the SPR maximum peak (Baptista et al., 2005).
Moreover, DLS analysis also provides information about the AuNP size distribution through the polydispersity index. The AuNPs synthetized showed a polydispersity index of 0.17 ± 0.06 which indicates a high monodisperse population.
The final technique used to characterize the AuNPs was transmission electron microscopy (TEM), providing direct visualization of morphology and size distribution profile of AuNPs. TEM images (Figure III.1A and Figure III.1B) confirmed the high monodispersing and spherical shape of the synthetized nanoparticles. In order to determine the AuNP size, a total of 262 AuNPs were measured using the software Image J. AuNPs showed an average diameter of 13.66 ± 2.10 nm, which was in accordance to UV-visible characterization.
Figure III.1 - Characterization of the synthesized AuNPs. (A) Transmission electron microscopy (TEM) imaging (scale bar 50 nm); (B) Size distribution of AuNPs from counting 262 particles; (C) UV-visible spectrum of AuNPs in wavelength range of 400 - 700 nm, with a maximum absorption of the SPR band centered at 518 nm.
1.2.
FUNCTIONALIZATION AND CHARACTERIZATION
1.2.1. POLY(ETHILENE) GLICOL
In order to increase biocompatibility, stability and also provide further chemical functionalization, the citrate capped AuNPs were coated with PEG molecules. This hydrophilic polymer creates an inert hydrophilic surface, preventing unspecific binding of other molecules, such as opsins. This is an important feature for in vivo applications (Sperling and Parak, 2010).
The citrate coated AuNPs were functionalized with a bi-functional PEG molecule (SH-EG(8)-COOH), with a thiol group at one end to be attached to the AuNP core, and a carboxyl group at the other end to enable further chemical functionalization. The final AuNP@PEG were coated with a 100% saturation of PEG molecules, corresponding 0.01 mg.mL-1. The determination of the degree of saturation is in
Appendix A1.
After functionalization, AuNP@PEG were characterized by visible spectroscopy and DLS. By UV-visible spectroscopy is possible to notice a 2 nm shift of the SPR band from 518 to 520 nm, meaning an increasing in the AuNP size due to the attachment of the PEG molecules (Figure III.2). Moreover, a minor enlargement of the SPR band can be seen, which can indicate an enhancement of the polydispersity.
Figure III.2 - Characterization of the pegylated AuNPs by UV-visible spectroscopy. UV-visible spectrum of the previously synthetized AuNP@Citrate and AuNP@PEG, enlightening the SPR shift from 518 nm to 520 nm and the minor enlargement of the SPR band.
The DLS analysis determined an increase of the hydrodynamic diameter of 18.17 ± 0.64 to 21.78 ± 3.92 nm, a 3.61 nm increment that indicates a replacement of the citrate coat by a monolayer layer of PEG chains. Since the size of a single molecule of PEG is 3.25 nm (www.iris-biotech.de), it was expected an enhancement of hydrodynamic diameter in about 6.5 nm. However, DLS analysis only shows a 3.61 nm increase that can be due to the high flexibility of PEG chains that might influence the Brownian motion of the AuNPs. Also, the polydispersity index increased from 0.17 ± 0.06 to 0.21 ± 0.03, in concordance with the characterization by UV-visible spectroscopy.
1.2.2. TAMRA
In order to produce an AuNP able of been tracked by fluorescent spectroscopy and microscopy during cellular uptake, it was necessary to attached a fluorophore molecule to the AuNP@PEG previously synthetize. Therefore, the AuNPs were functionalized with TAMRA dye, a rhodamine-based fluorophore, by an EDC/NHS coupled reaction, taking advantage of carboxyl groups of PEG chains already attached to the AuNP surface, and primary amine groups from TAMRA dye.
Figure III.3 - Characterization of AuNP@PEG@TAMRA by UV-visible spectroscopy. UV-visible spectrums of the synthetized AuNPs (AuNP@Citrate), AuNPs coated with PEG (AuNP@PEG) and coated with PEG and TAMRA (AuNP@PEG@TAMRA) in a wavelength range of 400 - 700 nm. Inset presenting the maximum of the SPR band shift through all functionalization.
This nanoconjugate was also characterized by fluorescent spectroscopy, in order to determine the number of TAMRA molecules attached to the AuNPs and to assess the fluorescent properties of AuNP@PEG@TAMRA. After quantification of the TAMRA molecules present in supernatants, a AuNP:TAMRA ratio of 1:4 ± 0.3 was achieved. Figure III.4 shows the fluorescent profile of the prepared AuNPs, which is indicative of the attachment of the TAMRA dye to the AuNP surface.
Figure III.4 - Characterization of AuNP@PEG@TAMRA by fluorescence spectroscopy. Emission spectrum of 5 nM of AuNPs coated with PEG (black line) and 5 nM of AuNPs coated with PEG and TAMRA (grey line) at excitation wavelength of 543 nm and recorded in a frequency range of 550 - 700 nm, at 30 nm/min with a photomultiplier potency of 800 V.
E m i s s i o n w a v e le n g t h ( n m )
a
.u
.
6 0 0 6 5 0 7 0 0
0 5 1 0 1 5
A u N P @ P E G
A u N P @ P E G @ T A M R A W a v e le n g t h ( n m )
A
b
s
4 0 0 5 0 0 6 0 0 7 0 0
0 .0 0 .5 1 .0
A u N P @ C it r a t e
A u N P @ P E G
2. INTERNALIZATION OF GOLD NANOPARTICLES
In order to continue the development of AuNPs with improved therapeutic efficacy is necessary to acquire an intense knowledge of their interactions with living cells and biological systems. More precisely, the internalization mechanism by which AuNPs are taken up by cells with minimal toxicity.
2.1.
KINETICS OF CELLULAR UPTAKE
As mentioned before, the characterization of the prepared AuNP@PEG@TAMRA showed the presence of fluorescent properties that make the formulation suitable for tracking during the cellular internalization by fluorescent spectroscopy. In this work, spectroscopy and microscopic techniques have been selected to evaluate the cellular uptake - fluorescent spectroscopy and ICP-MS to quantification two different elements of the nanoconjugate, and fluorescent microscopy to enable the visualization of AuNP localization inside cells (Elsaesser et al., 2010; Rothen-Rutishauser et al., 2014).
To determine the kinetics profile of the cellular uptake of this formulation, A549 cells (human lung carcinoma) were incubated with 10 nM of AuNP@PEG@TAMRA for 1 - 24 h. After the incubation period, A549 were lysate as mentioned in Section II.7.2, and the fluorescent intensity of each lysate was measured by fluorescent spectroscopy. The lysates were also analyzed by ICP-MS, in order to quantify the cellular uptake by measuring the concentration of Au and compare it to the intensity of TAMRA, proportional to the quantity of AuNPs, by fluorescent spectroscopy.
Figure III.5 - Cellular uptake kinetics of AuNPs in A549 cell line. (A) Cellular uptake of 10 nM of AuNPs as function of incubation time quantified by fluorescent spectroscopy. The data is relative to the average of four independent assays each one of them in triplicate and error bars are correspondent to standard deviation (SD). (B) Cellular uptake of 10 nM of AuNPs as function of incubation time quantified by ICP-MS.
Figure III.5 shows the cellular uptake kinetics of AuNPs evaluated by fluorescent spectroscopy (A) and by ICP-MS (B). The uptake of AuNPs significantly increased during the first 6h of incubations, but gradually slowed a reached a plateau after 6h of incubation as represented in Figure III.5A, results that are in agreement with literature reports (Wilhelm et al., 2002; Chithrani et al., 2006). The saturation plateau that is observed is not associated to low quantity or absence of AuNPs in the medium, but probably due to the exocytosis of AuNPs or even due to the distribution of AuNPs between cells following
T i m e ( H o u r s )
F lu o r e s c e n c e I n te n s it y ( a .u .)
0 2 4 6 8 1 0 1 2 1 4 1 6 1 8 2 0 2 2 2 4
0 5 0 1 0 0 1 5 0
T i m e ( H o u r s )
A u p e r l y s a te ( n g )
0 2 4 6 8 1 0 1 2 1 4 1 6 1 8 2 0 2 2 2 4
0 2 0 0 4 0 0 6 0 0
cell division (Kim et al., 2012). Indeed, the fluorescent data is in agreement with the results obtained by ICP-MS analysis. Although these were not performed in triplicate, a similar kinetics profile was obtained as showed by Figure III.5B. Hence, the similarity between the two analyses ensure that measuring the signal intensity of TAMRA is, in fact, proportional to the quantity of AuNPs present in each lysate. The cellular uptake kinetics was also evaluated by fluorescent microscopy. However, this technique demonstrated that the AuNPs did not had enough fluorescent intensity capable of distinguish the increment of the AuNPs uptake overtime. This limitation can be to the properties of the fluorescent dye chosen for the attachment to the AuNPs. The emission spectrum of TAMRA dye (572 nm) overlaps with the absorption spectrum of the AuNPs (400 - 700 nm), resulting in a decrease of the fluorescence intensity of TAMRA. This is a known energy transfer mechanism, named Förster Resonance Energy Transfer (FRET) (Park et al., 2012).
Nevertheless, Figure III.6 shows the evaluation of cellular uptake of AuNPs after 24h of incubation by fluorescent microscopy, in order to demonstrate the presence of AuNPs inside the cells.
Control 24h AuNPs 24h Control 24h AuNPs 24h
DAPI DAPI
TAM
RA
Dark
F
ie
ld
DAPI +
T
AM
RA
DAPI +
Da
rk
Fi
e
ld
Figure III.6 - Cellular uptake of AuNPs in A549 cell line evaluated by fluorescent microscopy. Images acquired of A549 cells incubated with 10 nM of AuNP@PEG@TAMRA for 24h and the correspondent control (without AuNP incubation. (A) Cellular uptake based on TAMRA fluorescent intensity, (scale bar 50 µm). (B) Cellular uptake based on scattering (dark field) of the gold core, (scale bar 100 µm).
The images were acquired using two different fluorescent filters, a blue one to visualize DAPI stain (imaging of cell nucleus) and a red filter to visualize the TAMRA signaling. Figure III.6A show images of control cells (without AuNPs) and of 24h incubation of AuNPs. The merged image demonstrated the
inside endocytic vesicles or free in the cytosol, previous studies demonstrated that PEG-coated nanoparticles have a higher tendency to appear free within the cytosol. The possible explanation for PEG-coated nanoparticles appear free in the cytosol could be related to PEG high solubility in cell membranes, which can lead to a transmembrane passage of particle from vesicles to cytosol (Brandenberger et al., 2010). The uptake can also be verified in Figure III.6B, where the signaling of TAMRA was replaced by the light dispersion driven by the gold core of this nanoparticles.
Based on the results obtained for the cellular uptake kinetics of the AuNPs, further inhibition studies were performed upon 1, 3, and 6 h of incubation. This time points are set before the saturation plateau of AuNPs cellular uptake. This way, further internalization inhibition results do not be influenced by the exocytosis of AuNPs. Moreover, in this period of time, A549 cells had not yet reached to their doubling time, i.e. the time necessary for double the entire cell population, and the number of cells do not significantly change. Besides, if a primary internalization mechanism is blocked for long periods, cells will attempted to contrary this process, and secondary endocytic pathways will be activated, which can negatively influenced the results from further inhibitions assays.
2.2.
MECANISM OF INTERNALIZATION
Different methods have been used to analyze the mechanism of internalization of nanoparticles (Iversen et al., 2011), with one of the most commonly used being the selectively inhibition of the different endocytic pathways through the utilization of pharmacological endocytic inhibitors. A variety of studies have been performed using these endocytic inhibitors in order to assess the internalization mechanism of different types of nanoparticles (Vercauteren et al., 2010; Saha et al., 2013; Rothen-Rutishauser et al., 2014).
To further evaluate the uptake mechanism of the AuNPs prepared, four different endocytic inhibitors, chlorpromazine, filipin, wortmannin and amiloride were used, concerning the three major endocytic pathways, clathrin mediated endocytosis, caveolae mediated endocytosis and macropinocytosis. So A549 cells were treated with the four endocytic inhibitors in separate, 28.14 µM of chlorpromazine - inhibitor of clathrin mediated endocytosis, 1.53 µM of filipin, inhibitor of caveolae mediated endocytosis, and 300 nM of wortmannin and 1.5 mM of amiloride, inhibitors of macropinocytosis. The cells were treated with these inhibitors for 30 min prior to AuNP incubation, in order to initiate the blockage of each endocytic pathway before the incubation of AuNPs. After this, AuNPs were incubated in presence of each inhibitor to pursue the blockage of each endocytic pathway.
The concentrations of endocytic inhibitors used were based on previous reports, as well as the time of cell treatment with inhibitors before the incubation with AuNPs (Saha et al., 2013; Yang et al., 2013; Rothen-Rutishauser et al., 2014). After incubation, all cellular lysates were measured by fluorescent spectroscopy, in order to determine the TAMRA signal intensity.