Ana Isabel dos Santos Franco
Licenciada em Bioquímica
Stabilizing High Energetic States of
Pharmaceutical Drugs
Dissertação para obtenção do Grau de Mestre em Bioquímica para a Saúde
Orientador: María Teresa Viciosa Plaza, Post-Doc, IST-IUL
Co-orientador: Maria Madalena Alves Campos de Sousa
Dionísio Andrade, Prof. Auxiliar, FCT-NOVA
iii
Ana Isabel dos Santos Franco
Licenciada em Bioquímica
Stabilizing High Energetic States of
Pharmaceutical Drugs
Dissertação para obtenção do Grau de Mestre em Bioquímica para a Saúde
Orientador: María Teresa Viciosa Plaza, Post-Doc, IST-IUL
Co-orientador: Maria Madalena Alves Campos de Sousa
Dionísio Andrade, Prof. Auxiliar, FCT-NOVA
Júri:
Presidente: Prof. Doutora Maria Teresa Nunes Mangas Catarino Arguente: Doutora Ana Sofia Diogo Ferreira
Vogal: Doutora María Teresa Viciosa Plaza
Faculdade de Ciências e Tecnologia da Universidade Nova de Lisboa
v
Copyright © Ana Isabel dos Santos Franco, Faculdade de Ciências e Tecnologia, Universidade Nova de Lisboa, Instituto de Tecnologia Química e Biológica António Xavier e a Universidade Nova de Lisboa
O Instituto de Tecnologia Química e Biológica António Xavier, a Universidade Nova de Lisboa e a Faculdade de Ciências e Tecnologia têm o direito, perpétuo e sem limites geográficos, de arquivar e publicar esta dissertação através de exemplares impressos reproduzidos em papel ou de forma digital, ou por qualquer outro meio conhecido ou que venha a ser inventado, e de a divulgar através de repositórios científicos e de admitir a sua cópia e distribuição com objetivos educacionais ou de investigação, não comerciais, desde que seja dado credito ao autor e editor.
vii
Agradecimentos
Começo por agradecer às minhas orientadoras por terem aceite trabalhar comigo e por me deixarem fazer parte deste projeto. Nem sempre foi um percurso fácil, mas pude sempre contar com o apoio e compreensão de ambas.
Obrigada à Professora Madalena, pela disponibilidade, por toda a ajuda e por querer que fosse sempre mais além no trabalho.
À Maite (María Teresa Viciosa Plaza), obrigada por toda a ajuda no tratamento de dados, por me ter dado a conhecer o IST, por todo o entusiasmo e positivismo ao longo de todo o trabalho e por toda a disponibilidade.
Obrigada à Teresa Cordeiro, que esteve sempre disponível para esclarecer qualquer dúvida e ajudar, mesmo que muitas vezes isso significasse parar o seu próprio trabalho.
Agradeço à Drª. Ana Matias por me ter recebido no iBET para realizar os ensaios de citotoxicidade e à Carolina Pereira, por me ter acompanhado e ajudado no tempo em que decorreram os ensaios.
Aos meus colegas de laboratório, Vital, Piedade e Rita, obrigada pelo tempo bem passado, ajuda e companheirismo. Tudo é mais fácil quando se trabalha num bom ambiente.
Aos meus pais, irmão e cunhada, por acreditarem sempre em mim e por me ajudarem a realizar os meus sonhos e objetivos, por aceitarem todas as minhas ausências, falta de paciência e stress, sem se queixarem, obrigada! Para a minha mãe em especial. À minha avó, pelo apoio durante estes 5 anos.
À Carolina, por 4 anos de companheirismo. O verdadeiro significado de amizade e carinho. Aquela pessoa que vive comigo e que me acompanha quase 24 horas por dia e está presente em todos os momentos da minha vida. Obrigada por tudo, pela ajuda, pelo apoio e por tudo o que me ensinou.
Ao Tiago, que fez parte do percurso todo. E acreditou sempre.
Aos meus amigos mais próximos, obrigada por todo o apoio e compreensão, em particular, Teresa, Rúben, Babá, Débora, André, Inês e as Beatriz, Vieira, Rodrigues e Esteves.
Às meninas da TunaMaria, por todas as horas de diversão e música que me proporcionaram. Não há palavras para descrever os momentos, aventuras e histórias que vivemos por todos palcos e locais por onde passámos. Foi um prazer.
E finalmente, um obrigada à minha treinadora, por todas as energias negativas que transformou em positivismo e calma. Pelos conselhos, por todas as vezes que me pressionou para escrever a tese e aturou o meu mau humor. E em especial, um obrigada pela capacidade de me fazer sair da minha zona de conforto e tentar superar-me.
ix
Dedicatória
xi
Resumo
A amorfização de fármacos tem sido adotada como estratégia promissora para aumentar a sua solubilidade, uma vez que o estado amorfo é caracterizado por uma maior desordem que facilita a solubilização do material. No presente trabalho, foi preparado e caracterizado um compósito com o objetivo de melhorar a solubilidade aquosa de uma droga, após amorfização, e suscetível de ser utilizado como sistema de libertação controlada.
O fármaco alvo, sinvastatina (SIM), pertence à família das estatinas, utilizada para reduzir os níveis de colesterol no sangue, e com alta eficiência na regeneração óssea. Para a amorfização, o fármaco foi incorporado em duas matrizes de sílica mesoporosas (SBA-15), uma não modificada e outra com superfície metilada. A análise por espectroscopia de ressonância magnética nuclear e de infravermelho, bem como termogravimetria, evidenciam inclusão eficiente nas matrizes e ausência de interações fortes SIM-sílica.
As transformações de fase da SIM nativa foram estudadas por calorimetria diferencial de varrimento, permitindo identificar a temperatura de fusão ~ 140 ºC. A cristalização é evitada no arrefecimento e a SIM solidifica no estado vítreo. A transição vítrea, detetada claramente no aquecimento subsequente, é observada a uma temperatura (Tg.mid) de 33 ºC. Nos compósitos, a transição vítrea também é detetada sem registo de fusão, indicando amorfização da droga que exibe Tg.mid a temperatura superior relativamente a SIM nativa. A mobilidade molecular sondada por espectroscopia de relaxação dielétrica, indica que os movimentos moleculares se encontram mais impedidos na presença da matriz de sílica, de acordo com o aumento calorimétrico de Tg. Os ensaios de citotoxicidade foram realizados utilizando células Caco-2 confluentes e não diferenciadas. Os resultados demonstram que nos compósitos a citotoxicidade da SIM, a concentrações superiores, diminui. Os ensaios de libertação, a pH 6,8 para simular condições semelhantes ao fluido intestinal e monitorizados por espectroscopia UV-Vis, demonstram que a sinvastatina é facilmente libertada de ambas as sílicas. Resultados preliminares sugerem uma libertação mais rápida da sílica não modificada. Ambos os ensaios permitem concluir que os compósitos estudados são promissores para serem utilizados como sistemas de libertação de fármacos.
O trabalho foi aceite para comunicação em painel no Chempor 2018.
xiii
Abstract
Modification of the physical state of low soluble drugs, as amorphization, is a promissory strategy to increase their solubility, since this intrinsically disordered state promotes solubilisation. In the present work, a composite has been prepared and characterized aiming to improve the aqueous solubility of a drug by amorphization, and able to be used for controlled drug delivery.
Simvastatin (SIM) is the target drug, belonging to statins family, used to reduce the levels of cholesterol in blood and with high efficiency in bone regeneration. To achieve SIM’s amorphization, it was incorporated in unmodified and surface treated by methylation SBA-15 mesoporous matrices. Nuclear magnetic resonance and infrared spectroscopy together with thermogravimetric analysis evidenced efficient inclusion in matrices and the absence of strong guest-host interactions. Native SIM’s phase transformations were studied by differential scanning calorimetry, allowing the identification of melting close to 140 ºC. After cooling from the melt, crystallization is avoided and SIM solidifies in a glassy state. The glass transition, detected in subsequent heating, is clearly seen with a midpoint temperature (Tg.mid) of 33 ºC. In the composites the glass transition is also detected showing that the drug is in the amorphous state, however emerging at higher temperature compared with the native drug. Dielectric Relaxation Spectroscopy results of incorporated SIM indicate that molecular motions are hindered by the presence of the silica matrix, in agreement with the calorimetric Tg’s increase.
Cytotoxicity assays were performed using confluent and non-differentiated Caco-2 cells. The results demonstrate that at higher concentrations simvastatin is less cytotoxic when incorporated in the silica pores.
Release assays were done to simulate drug delivery in the organism using conditions similar to intestinal fluid such as pH 6.8. Monitoring by UV-Vis spectroscopy revealed that simvastatin is easily released from both silicas. Preliminary results suggest a faster release from the unmodified silica. Both assays allow concluding that the studied composites are promissory to be used as drug delivery systems.
The work here reported was accepted to be presented as a poster communication in Chempor 2018.
xv
Contents
Introduction ... 1
Motivation ... 1
Drug ... 1
1.2.1 Simvastatin ... 1
Phase transitions ... 3
Crystallization, melting and glass transition ... 4
Amorphization ... 5
Mesoporous silica matrices ... 6
Experimental techniques ... 7
1.7.1 Differential Scanning Calorimetry... 7
1.7.2 Dielectric relaxation spectroscopy (DRS) ... 8
Experimental Section ... 11
Materials ... 11
2.1.1 Drug ... 11
2.1.2 Mesoporous silica SBA-15 ... 12
Methods ... 15
2.2.1 Drug Loading ... 15
2.2.2 Nuclear Magnetic Resonance spectroscopy (NMR) ... 16
2.2.3 Attenuated Total Reflectance Fourier Transform Infrared Spectroscopy (ATR-FTIR) ... 18
2.2.4 Differential Scanning Calorimetry (DSC) ... 18
2.2.5 Dielectric Relaxation Spectroscopy (DRS) ... 19
2.2.6 Thermogravimetric Analysis ... 19
2.2.7 Drug Release Experiments ... 20
2.2.8 Cytotoxicity Assays ... 20
Results and Discussion ... 23
ATR-FTIR ... 23
Differential Scanning Calorimetry (DSC) ... 25
xvi
Dielectric Relaxation Spectroscopy (DRS) ... 29
Release assay ... 35
Cytotoxicity assay ... 37
Conclusions ... 39
xvii List of Figures
Figure 1 – Cholesterol synthesis pathway evidencing the step where simvastatin acts. ... 2
Figure 2 – Human metabolism of simvastatin... 3
Figure 3 – Changes in thermodynamic properties.. ... 4
Figure 4 – Phases diagram.. ... 5
Figure 5 –Processes of silica’s synthesis16. ... 6
Figure 6 – Heat flux DSC23. ... 7
Figure 7 – DSC profile.. ... 8
Figure 8- Frequency response of dielectric mechanisms. ... 9
Figure 9 – Chemical structure of Simvastatin. ... 11
Figure 10 - SBA-15 characterized by SEM... 13
Figure 11 - SBA-15 characterized by TEM. ... 14
Figure 12 - Experimental setting up for thermal activation of the silicas. ... 15
Figure 13 – a) The 1H NMR spectrum of the simvastatin in DMSO at 303 K. b) 1H NMR spectrum of SIM and SBA-15_SIM measured in this work. ... 17
Figure 14 – Comparison of the 1H-NMR (pH=13) spectra for SBA-15 and SBA-15_F. ... 18
Figure 15 –Schematic representation of the dialyses membrane and quartz cuvette used for monitoring drug release. ... 20
Figure 16 – ATR-FTIR spectra of simvastatin, SBA-15, SBA-15 functionalized, SBA-15-simvastatin and SBA-15 functionalized-SBA-15-simvastatin. ... 23
Figure 17 – Scale up from region around 1670-1820 cm-1. ... 24
Figure 18 – Thermograms of simvastatin... ... 25
xviii Figure 20 – Comparison of the thermogram obtained for SBA-15_SIM with ageing (green line) and SBA-15_SIM (blue line). ... 27 Figure 21 – a) Graph corresponding to the degradation by TGA of the pure simvastatin and simvastatin loaded silica samples. b) graph corresponding to mass derivative of SIM and SBA-15_SIM. ... 28 Figure 22 – Isochronal representation of 𝜀" taken at 104 Hz. ... 29 Figure 23 – Isothermal measurements at the frequency of 104 Hz of SBA-15_SIM and SIM. .. 30 Figure 24 – Scale-up evidencing the shift of the main process between the two scans. ... 31 Figure 25 – Isothermal representation of: a) 𝜀"and b) M’’ for spectra collected from 0 ºC to 150
ºC every 5 ºC. ... 32 Figure 26 –M” vs T at 𝑓 =104 Hz for a) native simvastatin and b) SBA-15_SIM. ... 32 Figure 27 –Dependence of logarithm of relaxation times obtained from the fitting of M” vs. T
by the superposition of Gaussian functions with temperature reciprocal.. ... 33 Figure 28 – UV-Vis absorbance spectra obtained for bulk simvastatin. ... 35 Figure 29 – Dialysis membrane. ... 35 Figure 30 – Solubility and release profiles of bulk simvastatin, SBA-15_SIM and SBA-15_F_SIM
obtained at λ=238 nm. ... 36
xix List of tables
Table 1 – Characteristics of Simvastatin ... 11
Table 2 – Textural information about mesoporous silicas. ... 13
Table 3 – Drug loading conditions. ... 16
Table 4 – Activation Energy and pre-exponential of processes presents in SBA-15_SIM. ... 34
xxi List of Abbreviations
ATR-FTIR – Attenuated Total Reflectance - Fourier Transform Infrared Spectroscopy API – Active pharmaceutical ingredient
ASD – Amorphous solid dispersions DRS – Dielectric Relaxation Spectroscopy DSC – Differential Calorimetry Scanning NMR – Nuclear magnetic resonance PBS – Phosphate Buffered Saline SIM – Simvastatin
SBA-15_SIM – Simvastatin loaded in SBA-15
SBA-15_SIM_F – Simvastatin loaded in SBA-15 functionalized SBA-15 –Santa Barbara Amorphous 15
SBA-15_F –Santa Barbara Amorphous 15 functionalized
SC – Supercooled
SEM – Scanning Electron Microscope TEM – Transmission Electron Microscopy TEOS – Tetraethyl orthosilicate
Tf– Fusion Temperature
Tg– Glass Transition Temperature
Tg.mid - Midpoint Glass Transition Temperature Tm– Melting Temperature
1
Introduction
Motivation
Many marketed drugs and novel drug candidates remain poorly water soluble1,2 and this has been a cause of concern to the pharmaceutical industry. Lower solubility of compounds results in reduced bioavailability and an increase in drug concentration is necessary to ensure the desired therapeutic effect, resulting in economic issues to pharmaceutical industry, rising drug’s costs and also it could be non-beneficial to either the patient or the environment3.
Amorphization of the active pharmaceutical ingredient (API) is one promissory approach, since the amorphous state is highly disordered, has higher internal energy and presents an increase in mobility that can potentiate solubility comparatively to the crystalline state4.
However, as the amorphous solid is out of thermodynamic equilibrium and hence it is unstable, it tends to convert to a thermodynamically stable crystalline state.
A way to promote and stabilize the amorphous form is to load the drug in mesoporous silica matrices5. Since they have large surface areas and their pore dimensions can be tuned over a variety of sizes, silica matrices can retain drugs in the amorphous state, increasing the guest stabilization time in such a way that it becomes useful for the application. Also, they are able to release drugs over different periods of time, giving rise to controlled drug delivery systems.
Drug
1.2.1 Simvastatin
The lipid-lowering drugs, as statins, are 3-hydroxy-3-methylgulutaryl-coenzyme A (HMG-CoA) reductase inhibitors, being used for prevention and treatment of elevated concentrations of total and low-density lipoprotein cholesterol (LDL), apolipoprotein B and triglycerides in blood serum, associated to hypercholesterolaemia, hypertriglyceridaemia and cardiovascular diseases.
Cholesterol’s biosynthesis is mainly regulated by HMG-CoA reductase, catalysing the conversion of HMG-CoA in mevalonate, a rate limiting step in synthesis6. Inhibition of HMG-CoA reductase by statins decreases intracellular cholesterol biosynthesis in the liver and extrahepatic tissues7.
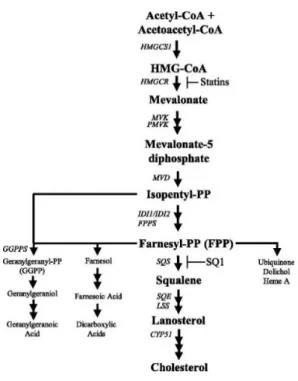
2 Therefore some effects of statins could be related to the capacity of blocking the synthesis of isoprenoid intermediates9. Figure 1 illustrates cholesterol synthesis, including the action of statins.
Figure 1 – Cholesterol synthesis pathway evidencing the step where simvastatin acts.10
At the same time, the use of statins for bone regeneration is a promising area of research, since statins can affect the process of bone turnover and regeneration, acting on important cell types, such as mesenchymal stem cells, osteoblasts, endothelial cells, and osteoclasts11. Osteoporosis is characterized by a decrease in bone mineral density (BMD), weakening the bones. Simvastatin is an activator of bone morphogenetic protein (BMP2) which accounts for major osteo inductive potential of bone12, making it a potential drug towards osteoporosis and other bone disorders management. The successful use of simvastatin to promote bone formation is depending on local concentration, being fundamental to find an appropriate delivery system13,14.
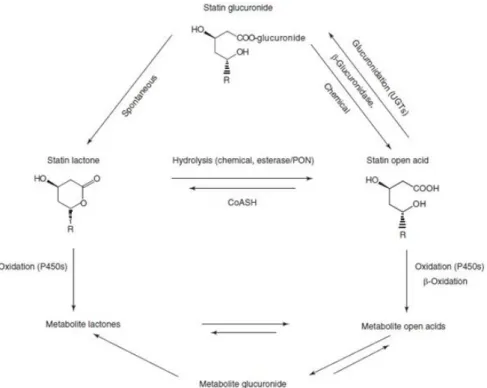
3 acid and simvastatin, undergoes oxidative metabolism by isoforms of cytochrome P450. Only active form is able to inhibit HMG-CoA.
Figure 2 – Human metabolism of simvastatin; Simvastatin and the lactone metabolites are inactive; they all exist in vivo in equilibrium with the corresponding pharmacologically active acids15.
Phase transitions
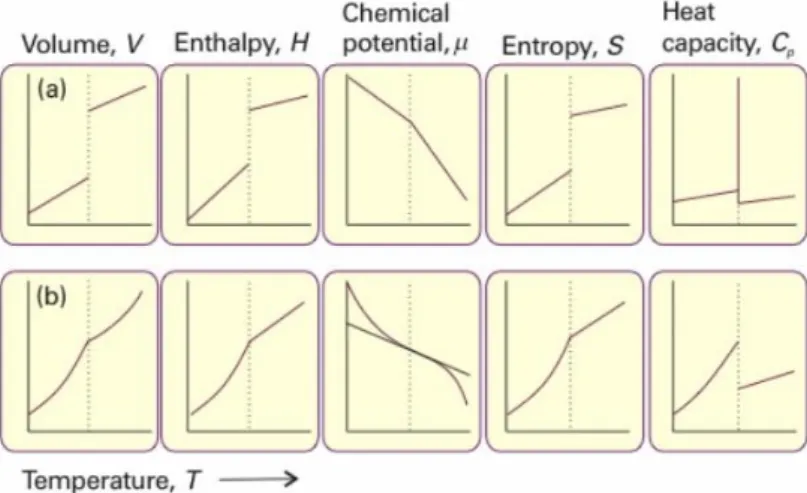
Phase transitions could be classified according to the Ehrenfest classification16 as first, second or higher order transitions as function of their thermodynamic properties as entropy, enthalpy or volume. The classification depends on how the temperature derivative of the thermodynamic property behaves at the transition point.
4 transition while thermodynamic state change occurs. Melting and crystallization are two phenomena that are first order transitions16.
Second order transitions, as the name suggests, have the discontinuity in the second derivate while the first one is continuous; these transitions have no associated latent heat16 (Figure 3b). An example of second order transition is vitrification.
Figure 3 – Changes in thermodynamic properties associated a) first order and b) second order phase transitions17.
Crystallization, melting and glass transition
Melting was given as an example in the previous section of a first order transition, occurring in a single step that only depends on thermodynamic factors. During melting, the crystal transforms to a liquid by an endothermic process18.
On the other hand, crystallization is an exothermic process, depending on thermodynamic and kinetic factors. It occurs in two different steps, nucleation and crystal growth18,19.
In the context of the pharmaceutical science, it is relevant the knowledge and understanding of both crystallization and melting processes, since it enables to direct thermodynamics properties of drugs. Since diverse crystalline structures (polymorphism) exhibit distinct therapeutic activities20, the crystallization, the main process for compounds formation in pharmaceutical industry, can be controlled in order to assure that the desired form is the one adopted by the drug during crystallization. Therefore, the major challenge is to control such processes to maintain the stability, efficiency and drug release properties of drug.
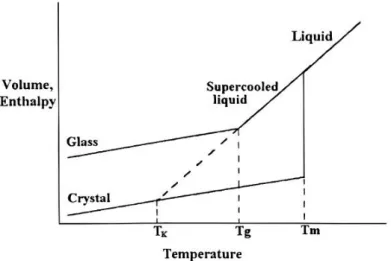
5 cooling rate is fast enough, implying that molecules not have time to rearrange and form a crystalline environment. On that point, the material is below a supercooled liquid state. With further cooling, the continuous increase of viscosity leads to solidification of material in a vitreous state (Figure 4). This change occurs at the glass transition21.
The glass transition is a second order transition in which not only thermodynamic but also kinetics factors are involved. As consequence, the cooling/heating rate and the time spend at temperatures below the glass transition can influence the properties of material19.
Figure 4 – Phases diagram showing the dependence of volume and enthalpy in function of temperature19.
Amorphization
Nowadays, there are an emergence of methods and techniques which the aim is to improve bioavailability of drugs. The avoidance of crystallization, i.e. amorphization, is now one of the most promisor strategies to address low drug solubility2.
It is known that the amorphous state is not stable or structurally ordered when compared to the crystalline state. Its higher energy and the fact that is a not at equilibrium state, leads to a tendency to crystallization, being one of the major challenges for its use in the pharmaceutical industry its stabilization in order to take advantage of this state. Its internal bonds are also weaker compared to the crystalline form, providing a better dissolution process of the drug in the organism, which may enhance bioavailability19.
6
Mesoporous silica matrices
The amorphous solid dispersion (ASD) is the most successful method to improve drug dissolution and stabilize the amorphous state5.
Mesoporous silica exhibits a wide range of porous sizes, from 2 to 50 nm. These materials have properties such as a high specific surface area, ordered pore network and high pore volume that are extremely advantageous for drug loading. Its biocompatibility with the organism and high stability also promotes the use in delivery systems2.
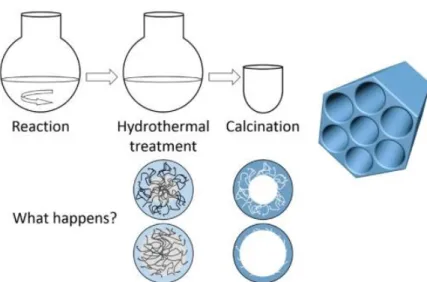
In this work SBA-15 (Santa Barbara Amorphous No.15) was used as host. It is characterized by hexagonal arrays that are organized in tubular channels. Silica SBA-15 was synthetized by the work group and its pore size is around 6 nm22,23.
Another advantage of these silica is the presence of silanol groups (Si-OH) at surface that allows interaction between the matrix and the guest molecules by van der Waals forces or hydrogen bonds. Silanol could be functionalized in order to improve drug loading and release. In the present work, it was functionalized and substituted by methyl groups.
7
Experimental techniques
1.7.1 Differential Scanning Calorimetry
Differential Scanning Calorimetry (DSC) is a thermal analysis and this term includes techniques in which physical parameter of the system is determined as function of temperature. In this case, DSC enables to characterize physical phase transformations of systems, based on heat flow measurement24.
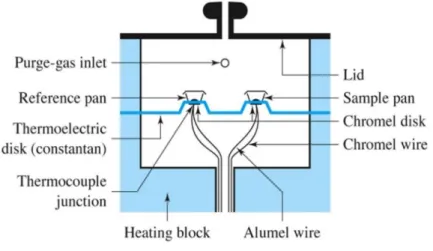
A differential calorimeter measures the heat of sample relative to a reference, with a linear temperature ramp and both the reference and the sample are at the same temperature during all the experience. The difference between the amount of heat necessary to change the temperature of sample and of reference is originated by a thermal transformation occurring in the sample that could suffer an exothermic process, as crystallization or an endothermic process, as melting. Figure 6 is a schematic representation of the DSC equipment.
Figure 6 – Heat flux DSC24.
As it is possible to observe, the equipment has two pans: the reference that is empty and the sample, placed on thermoelectric disk. Both pans are heated at a constant rate to avoid differences in temperature, since the material inside each one is different. The equivalent distribution of heat is assured by the flow of purge gas that is liquid nitrogen (N2).
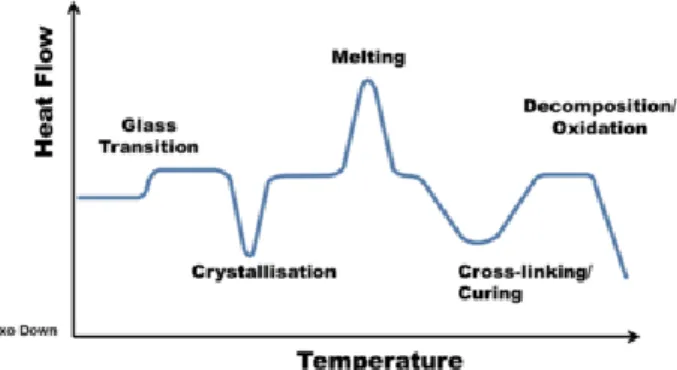
8 Figure 7 – DSC profile where the exothermic heat flow is measured vs. temperature; illustration of the transitions
that a material can undergo in DSC analysis25.
1.7.2 Dielectric relaxation spectroscopy (DRS)
Dielectric relaxation spectroscopy is a technique that operates in a range of frequencies from 10-6 to 109 Hz26 that is commonly applied in the study of molecular motion and is also indicated to analyse the vitreous dynamics and charge transport of a compound. Movements responsible for molecular dynamics can be ascribed for instance by small parts of a molecule, such as functional groups.
Once an oscillating electric field is applied to a certain dielectric material, the molecular charges will shift from their equilibrium positions originating a phenomenon called polarization, which consists in a forced orientation of the charges according to an applied electric field. All dielectric measurements require the presence of molecular dipoles.
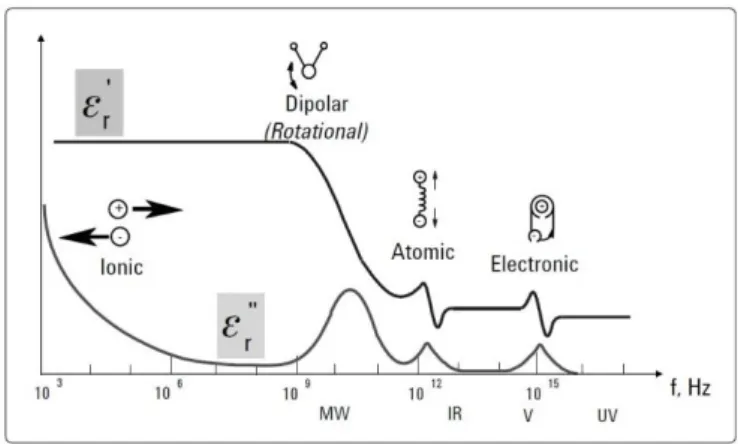
There are three polarization mechanisms27 (Figure 8):
• Electronic or induced polarization, which responds to field changes at all frequencies used
almost instantaneously. In this type of polarization are involved resonance effects.
• Dipole or orientational, that describes the movements of the dipoles which, depending on the
frequency at the dielectric is subjected, will be able to follow all the displacements associated with field polarizations. The response to the electric field is not immediate due to the resistance imposed to the dipole moment and to an irreversible loss of the free energy in the form of heat. • Interfacial polarization that occurs when charges are blocked at the interface between different
9 Figure 8- Frequency response of dielectric mechanisms27.
It should be noted that, in addition to these mechanisms of polarization, there are also translational movements of charges that originate the conductivity that will be induced also by the applied electric field.
The relationship between the electric field (stimulus) and polarization (response) is given by the complex dielectric constant 𝜀∗. This gives rise to different processes, fluctuations of molecular dipoles, propagation of moving charges or separation of interface charges that cause additional polarization and is expressed as follows27:
𝜀∗(𝜔) = 𝜀′(𝜔) − 𝑖𝜀"(𝜔) Equation 1
The angular frequency (𝜔) is given by 𝜔 = 2𝜋𝑓. The real part (𝜀′) of the dielectric constant, called permittivity, is related to the energy stored by the material and the imaginary part (𝜀") refers to the energy dissipated. Complex numbers are one way of expressing the lag between the stimulus and the response, since relaxation results in a delayed response to a variant stimulus.
Each relaxation has an associated time that depends on the mobility of the molecules (dipoles) that constitute a material. The relaxation time (τ) corresponds to the time during the polarization created in the material by the external electric field decays a factor of 1/e, where e is
the Neper number, after the field is removed. Thus, the relaxation time quantifies the process during which the distribution of the previously oriented dipoles returns to equilibrium, being randomly arranged28.
10 too fast to influence the dipoles oscillation and the orientational polarization disappears completely29.
In order to obtain the relaxation time (τ) of each process, it is used the isochronal representation of 𝜀" , i.e. for a fixed frequency, 𝜀" is represented as function of temperature and
the maximum of each peak position is calculate by fitting the data with a Gaussian function. With
τ (𝜏𝑚𝑎𝑥 = 1/2𝜋𝑓𝑚𝑎𝑥) it is possible to construct the relaxation map that consists in a
representation of log (τ) as function of the inverse of temperature (1/𝑇).
The temperature dependence of the relaxation time for each peak observed in 𝜀"vs. T
represents the dynamic fingerprint of the compound. The molecular mobility originated by localized dipolar reorientations usually exhibits an Arrhenius temperature dependence, 𝜏(𝑇) = 𝜏∞𝑒𝑥𝑝(𝑅𝑇𝐸𝑎). Otherwise, long length scale cooperative movements diverge from Arrhenius
function, the relaxation time obeying the Vogel-Fulcher-Tamman-Hesse law (VFTH): 𝜏(𝑇) = 𝜏∞𝑒
𝐵
𝑇−𝑇0 Equation 2
11
Experimental Section
Materials
2.1.1 Drug
Simvastatin ( [(1S,3R,7S,8S,8aR)-8-[2-[(2R,4R)-4-hydroxy-6-oxooxan-2-yl]ethyl]-3,7-dimethyl-1,2,3,7,8,8a-hexahydronaphthalen-1-yl] 2,2-dimethylbutanoate, the methylated form of lovastatin, is a white crystalline powder30.
Simvastatin is classified as a Class-II compound by Biopharmaceutics Classification System (BCS), with a poor water solubility and permeability through biomembranes31. Otherwise, it is highly soluble in chloroform, methanol and ethanol30. The table below shows main characteristics of simvastatin.
Table 1 – Characteristics of Simvastatin
Name Simvastatin
Molecular Formula C25H38O5
No. CAS 79902-63-9
Melting Point 135-138 °C
Molecular Weight 418.574 gmol-1
Stability depends on storage conditions, which for Simvastatin should be at a temperature between 5-30ºC in a well closed container. Therefore, the substance is stable for 24 months after the manufacture date32. Figure 9 shows simvastatin structure, evidencing the presence of carboxyl functional group (COOH) that together with the molecule high size, could explain its low solubility.
12 Simvastatin was a kind gift from Mepha Lda. “Investigação, Desenvolvimento e Fabricação Farmacêutica” (Porto Salvo, Portugal). The purity was higher than 99% in accordance with the supplier.
2.1.2 Mesoporous silica SBA-15
Synthesis
Mesoporous SBA-15 was synthesized during the work according to the method described by Gao et al.33. The first step was to prepare a solution of the template by dissolving 0.2 g of P123
triblock copolymer (poly(ethylene glycol)-block-poly(propylene glycol)-block-poly(ethylene glycol)) (Sigma-Aldrich) in 60 mL of 2 M aqueous hydrochloric acid (Riedel de Haën) and 15 mL of deionized water. The solution was stirred and 4,4 g of tetraethyl orthosilicate was added dropwise. The solution was stirred for 24 hours at 40 ºC, after the temperature was raised to 100 ºC and the mixture was transferred to Teflon-lined autoclave for 24 hours. The precipitate obtained was filtered under vacuum, washed with distilled water, air-dried and calcined at 500 ºC for 5 hours with a heating ramp of 10 ºCmin-1, to remove the template.
Functionalization – Methylation of Si-OH groups
The silicas was functionalized following the procedure reported in the literature34. The functionalization involves the substitution of silanol groups by methyl groups, using methyltrimethoxysilane [CH3Si(OCH3)] as the silylation agent used. Powder SBA-15 (~0.5 g), previously dried at 100 ºC overnight, was mixed with 150 mL dried toluene (dried with molecular sieves) and 2.5 mL of methyltrimethoxysilane in a nitrogen atmosphere. The solution was stirred at 80 ºC for 5 hours. The resulting precipitate was filtered under vacuum and washed with 50 mL of toluene and 50 mL of ethanol. The solid product was dried at 500 ºC overnight and denoted as SBA-15_Functionalized (SBA-15_F).
Characterization
13
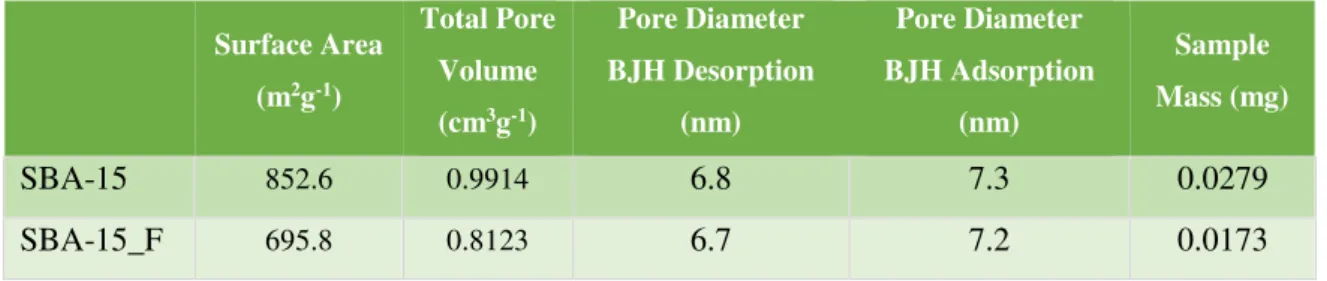
Table 2 – Textural information about mesoporous silicas.
Scanning Electron Microscopy – SEM
A scanning electron microscope (SEM) scans a fixed electron beam that interacts with the sample. The signals produced can be used to obtain information about the surface topography, texture, orientation and composition of the material analysed. The SEM images for SBA-15 (Figure 10) where obtained using Hitachi S2400 with Bruker light elements EDS detector (MicroLab, Instituto Superior Técnico).
Figure 10 - SBA-15 characterized by SEM.
Surface Area
(m2g-1)
Total Pore
Volume
(cm3g-1)
Pore Diameter
BJH Desorption
(nm)
Pore Diameter
BJH Adsorption
(nm)
Sample
Mass (mg)
SBA-15 852.6 0.9914 6.8 7.3 0.0279
SBA-15_F 695.8 0.8123 6.7 7.2 0.0173
14
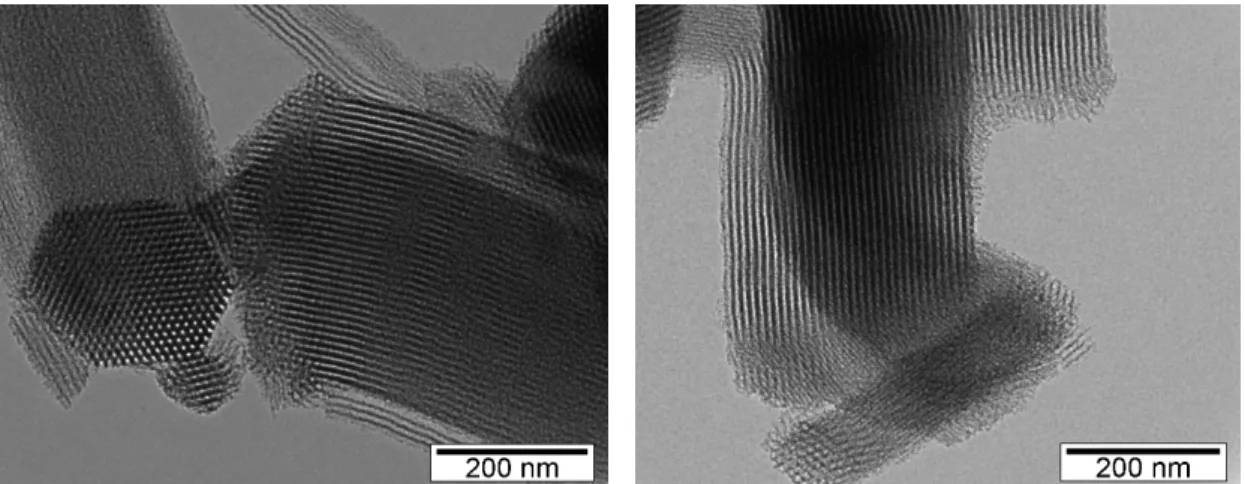
Transmission Electron Microscopy – TEM
This technique was also performed in Microlab, Instituto Superior Técnico (Hitachi 8100 with ThermoNoran light elements EDS detector and digital image acquisition) and it was used to observe the structure, shape, form and size of the pore. In TEM a beam of electrons is conducted through a specimen and the image is formed from interaction between electrons and atoms from sample. In this case it was possible to confirm the hexagonal structure of ordered pores (Figure 11).
15
Methods
2.2.1 Drug Loading
The objective of this procedure was to load simvastatin inside of porous of silica mesoporous SBA-15 and SBA-15_F. A first step of cleaning was required, to remove water and impurities from silicas. Therefore, ~150 mg of each silica was placed in a self-supported cells (Figure 12) and subjected to a temperature of 150 °C and a pressure of 10-4 bar for 7 hours, by connecting to a vacuum line and placed inside an electrical oven. After 7 h the oven was turned off and the silicas were left cooling under vacuum to room temperature overnight. On the next day, cells were heated for 2 h and then cooled at room temperature once again, under vacuum.
Figure 12 - Experimental setting up for thermal activation of the silicas.
The total pore volume of SBA-15 and SBA-15_F influences the amount of simvastatin loaded into silica. For the mass of silica used, it was estimated the pore volume available using the parameters obtained from BET analysis, i.e. for 150.1 mg of silica it corresponds to
0.1501(𝑔) ∗ 0.9914(𝑐𝑚3𝑔−1) = 0.148809𝑐𝑚3 of available volume (0.9914 cm3g-1 is the value taken from Table 3). On the other hand, the mass of simvastatin, 170.3 mg, corresponds to a volume of 0.154818 cm3, since for the crystalline structure of simvastatin, the density was 1.1 g/cm335 of form I, the most stable at room temperature.
From the calculi 0.1703(𝑔)
1.1(𝑔𝑐𝑚−3)= 0.154818𝑐𝑚3it can be concluded that the mass of
16 silica + 170.3 g of simvastatin = 320.4 g), simvastatin’s mass corresponds to ~53.2 % of the sample. In volume, this mass would correspond to ~84.3 % of the available volume.
Table 3 – Drug loading conditions.
To facilitate the drug loading process, Simvastatin was dissolved in 3 mL of chloroform. The solution was added to the cell that contains silica, under vacuum. To inject into the silica, the valve was opened, breaking the vacuum and allowing the mixture to get in the silica’s porous by
capillary wetting. The resulting mixture was left for 24 to 48 h at room temperature and under stirring until the solvent evaporates and it becomes a powder.
2.2.2 Nuclear Magnetic Resonance spectroscopy (NMR)
Nuclear Magnetic Resonance spectroscopy was used to identify and quantify simvastatin in composites.
Solution proton NMR data were collected on a Bruker Avance III 400 spectrometer (Bruker BioSpin GmbH, Rheinstetten, Germany) operating at 400 MHz. Samples were prepared by dispersing 5 mg of composites and simvastatin in 400 µL of D2O/NaOH (pH 13) and 100 µL of trioxane in D2O. This procedure was applied following literature36. The NMR tubes with SBA-15, SBS-15_F and SIM were sonicated for 1 hour and the NMR experiments were performed immediately. A known amount (100 µL) of 1, 3, 5-trioxane was added as internal standard.
Mass of silica (mg)
Mass of SIM (mg)
Available pore
volume (cm3)
Volume of crystalline
SIM (cm3)
SBA-15 150.1 170.3 0.149 0.155
17 Figure 13 – a) The 1H NMR spectrum of the simvastatin in DMSO at 303 K. The signals of solvent-DMSO (2.5 ppm)
and residual D2O (3.7 ppm) are marked by asterisks37; b) 1H NMR spectrum of SIM and SBA-15_SIM measured in
this work.
The study was preceded by the spectral analysis of the native drug in dimethyl sulfoxide (DMSO)38, which is an efficient solvent for water-insoluble compounds. In Figure 13 a), it is represented the spectrum retired from literature for simvastatin; figure b) shows the acquired 1H NMR spectrum with deuterated water (the peak of D2O was removed for clarity). The comparison allowed assigning the different protons in simvastatin structure (numbered in the scheme inserted in Figure 13 a) to the 1H NMR signals detected in a chemical shift spanning the range from 6 to 0.5 ppm.
Additionally, in Figure 13 b) the spectrum of SBA-15_SIM was included. The emergence of NMR signals found for native simvastatin allows confirming the incorporation of the drug in the silica matrix. The peaks come with a lower resolution due to the overlapping with the adjacent signals originated by the silica framework protons. The low resolution does not allow quantifying the amount of loaded simvastatin by comparison with the trioxane peak, located at 5.22 ppm.
Besides the peaks corresponding to simvastatin, also additional peaks due to protons belonging to the silica network were detected. Figure 14 presents the 1H NMR spectra of both silicas collected in identical conditions. As expected, a good superposition of most peaks is observed, however for SBA-15_F it is possible to identify three new peaks (see arrows in Figure
a)
18 14). In fact, it is reported that protons present in the organic groups bound to the surface because of matrix functionalization, are found in a chemical shift region between 0 and 4 ppm. Indeed, they are detected in the functionalized silica missing in the unmodified one and therefore acting as an indication of successful surface chemical modification/methylation.
Figure 14 – Comparison of the 1H-NMR (pH=13) spectra for SBA-15 and SBA-15_F; the arrows indicate the peaks
only detected in functionalized matrix.
2.2.3 Attenuated Total Reflectance Fourier Transform Infrared Spectroscopy (ATR-FTIR)
Fourier transform infrared (FTIR) spectra over the range 400-4000 cm-1 were collected at room temperature using a PerkinElmer Spectrum Two IR Spectrometer equipped with a diamond attenuated total reflectance (ATR). All the spectra were recorded via ATR method with a resolution of 1 cm-1 and 16 scans.
2.2.4 Differential Scanning Calorimetry (DSC)
19 were conducted under dry helium (at flow rate of 50 mLmin-1) to improve the thermal conductivity. The temperature is measured with a precision of ± 0.01 °C. Experiments were carried out using the software Universal Analysis 2000 from Thermal Analysis.
The sample is subject to different thermal treatments that include alterations in some experimental conditions like temperature and heating-cooling rate.
A sample in the crystalline form after heating will melt above a certain fusion temperature (Tf) and it is possible to observe a solid-liquid transition. Whereas, if the sample is cooled down, it can occur in a way that avoids crystallization, entering a supercooled liquid state. If the cooling proceeds, the viscosity is continuously increasing until it becomes comparable to a solid, i.e. the sample is in the glassy state. Even with high viscosity, like solids, the intrinsically disorder is similar to a liquid state.
2.2.5 Dielectric Relaxation Spectroscopy (DRS)
Dielectric relaxation spectroscopy was used to analyse the sample SBA-15_SIM, in a range frequency from 10-2 to 106 Hz. Results from sample simvastatin where previously obtained. A small amount of the composite was placed between two gold-plated electrodes with 10 mm of diameter of a parallel plate capacitor, BDS 1200, with two 50 μm-thick silica spacers. The sample cell was mounted on a BDS 1100 cryostat and exposed to a heated gas stream evaporated from a liquid nitrogen dewar.
The temperature control was confirmed by Quatro Cryosystem and performed within ±0.5 °C. Novocontrol Technologies GmbH supplied all these modules. The dielectric measurements were carried out using the ALPHA-N impedance analyzer from Novocontrol Technologies GmbH.
2.2.6 Thermogravimetric Analysis
20
2.2.7 Drug Release Experiments
The solution media for drug release was composed by phosphate buffer at 6.8 pH and ethanol in the w/w ratio of 90:10. Ethanol was chosen due to the high value of solubility that SIM in this medium35. Baseline was done with two quartz cuvettes with 3 mL of the PBS:ethanol solution (see Annex 3).
UV-Vis absorbance measurements were done with a Jasco V-660 UV-Vis spectrophotometer equipped with a programmable temperature control system (4 to 100 ºC) fully integrated with the software. Drug release was monitored following the procedure described in literature39. In a dialysis device containing the sample it was added 0.2 mL of buffer media. This set was inserted on the top of a quartz cuvette previously filled with 2.8 mL of the same solution media (see Figure 15). Sample temperature was controlled at 25 ºC in the sample holder (the sample temperature was around 29 ºC) and agitation of the cuvette solution was kept under continuous stirring at 400 r.p.m. Note that the use of dialyses membrane for monitoring drug release has been also applied in different conformations what shows the interest existing in design an easy and adaptable method for this aim40.
Figure 15 –Schematic representation of the dialyses membrane and quartz cuvette used for monitoring drug release.
UV-Vis spectra were collected during the first four hours every two minutes, and then every 8 or 10 minutes until complete 24 hours.
2.2.8 Cytotoxicity Assays
23
Results and Discussion
ATR-FTIR
This technique is used to confirm the presence of the drug on the composites, by comparing the specific bands of the native drug with those observed in the loaded silica. The ATR-FTIR spectra collected between 400 and 4000 cm−1 are presented in Figure 16, for the neat drug, unloaded and loaded silicas.
Figure 16 – ATR-FTIR spectra of simvastatin, SBA-15, SBA-15 functionalized, SBA-15-simvastatin and SBA-15 functionalized-simvastatin.
Simvastatin (red line) has a typical sharp band centred at 3548 cm-1 that corresponds to oxygen-hydrogen stretch vibration43. This band is not observed in loaded silicas probably due to a superposition with the OH band due to the presence of water; moreover, in the presence of hydrogen bonds this band could become broader which difficult the identification. Hydrogen bonding can also affect the bands located in the wavenumber region around 1670-1820 cm-1, making it of particular interest; a scaled up is presented in Figure 17. In this region, there is no evidence of free C=O which characteristic wavenumber should appear at 1760 cm-1 as a sharp line44 for both native and loaded simvastatin. Concerning crystalline simvastatin, where the molecules are linked by hydrogen bonds between the hydroxyl groups and the ester groups of the
24 molecule it is expected the appearance of the CO band at a lower wavenumber45. In respect to the loaded drug the band emerges with a lower resolution however in the same wavenumber region, besides intermolecular hydrogen bonding between SIM-SIM molecules also SiOH-SIM interactions can occur.
Figure 17 – Scale up from region around 1670-1820 cm-1; evidencing free C=O region.
Another broad and structured band is observed in pure and loaded SIM around 2960 cm-1 corresponding to carbon-hydrogen stretch vibration. This band is also affected in a small extension as compared with the one detected in the native drug, which can be taken as indication that C-H groups do not participate significantly in guest-host interaction. According to the chemical structure of simvastatin both hydrophilic and hydrophobic interactions are possible, the first trough the carbonyl and hydroxyl groups and the latter trough the decalin ring. However, the type of interaction with the silica matrix seems to be relatively weak compared with SIM-SIM interactions, since no strong deviations in the wavenumbers of the absorption bands are detected. The functional groups containing silicon atoms absorb mainly around 1000 cm−1, due to
the asymmetric stretching vibration (Si−O−Si); the corresponding symmetric stretch is registered at ∼800 cm−1and the bending Si−O−Si vibration at ∼500 cm−1 detected in 15 and SBA-15_F.
25
Differential Scanning Calorimetry (DSC)
As mentioned before, DSC was used to study phase transformations of simvastatin and simvastatin in SBA-15 and SBA-15_F.
Figure 18 – Thermograms of simvastatin obtained on heating from -90 to 160 ºC at 10 ºCmin-1: blue line is the first
of original sample; orange line is the second heating after cooling from the melting. Inset: enlarged region of second heating in the glass transition region, showing the auxiliary lines (dotted) used to determine the onset, midpoint and
endset of this transition.
In order to study simvastatin, cooling and heating cycles were programmed between -90 ºC and 40 ºC and subsequently the following heating cycles were up to 160 ºC, to verify the sample melting.
In the first temperature range studied, i.e. between 40 and -90 ºC, during cooling two
exothermal peaks are observed; in the subsequent heating, at similar temperatures two endothermic peaks are detected (see vertical arrows in Figure 18). These reversible peaks have been identified in literature46 with the transformations between three different crystalline structures (polymorphism).
26 The onset of this transition has been estimated at 31.8 ºC (heating rate 10 ºCmin-1), a value that is in accordance with the glass transition temperature (Tg) indicated in literature46. It seems important to note that no signal of recrystallization of the sample is detected on cooling as well as on heating, what is a clear indication of the total amorphization of the sample.
Figure 19 – Thermogram of simvastatin impregnated in SBA-15 obtained according to the graphic.
Concerning to simvastatin in SBA-15, the sample was submitted to two cooling/heating cycles from -90 to 160 ºC. In the first heating, a broad peak with minimum around 75 ºC is observed (orange line in Figure 19) caused by the exit of water that could be present in the sample. The percentage estimated of loss water was approximately 5.4% w/w.
No peak corresponding to melting of simvastatin was observed (also no signal of polymorphic transformations), being this issue an indicator that simvastatin in SBA-15 no longer has the same behaviour as the pure drug.
In the second cycle, both cooling and heating thermograms do not exhibit any thermal event (see for example blue line in Figure 19). Since no signal of crystallization was observed in the two cycles, it is reasonable to expect that the sample was in the amorphous state and the presence of the silica difficult the visibility of the glass transition. For this reason, it was conducted an ageing experiment consisting in keeping isothermally the sample at a temperature
27 ageing experiment was conducted at 45 ºC for 2 hours (see inset of Figure 20). The sample was immediately cooled down to -90 ºC and next heated at 20 ºCmin-1 up to 160 ºC. The thermogram obtained was included in Figure 19 (green line).
Figure 20 – Comparison of the thermogram obtained for SBA-15_SIM with ageing (green line) and SBA-15_SIM (blue line). Representation of Tg in SBA-15_SIM with ageing.
Concerning the SIM-SBA15_F, similar results were observed, i.e. simvastatin is in the
28
Thermogravimetric Analysis (TGA)
The loss of mass by degradation of simvastatin is done in two steps, the first one with onset at 210 ºC is the most significant, corresponding to the degradation of almost 90% of the sample. A second degradation step begins at 330 ºC and extends to 450 ºC (see Figure 21 a)).
Figure 21 – a) Graph corresponding to the degradation by TGA of the pure simvastatin and simvastatin loaded silica samples, both performed at nitrogen atmosphere at 10ºC/min; b) graph corresponding to mass derivative of SIM and
SBA-15_SIM.
For sample SBA-15_SIM, the exit of water is observed up to approximately 110 ºC, corresponding 5.33 % of the mass of the sample.
The degradation of supported simvastatin is done in three steps, beginning at 110 °C that is approximately 100 °C below the onset of pure simvastatin. The second and third steps of the degradation occur at temperatures similar to those observed in the pure simvastatin as can be seen by the mass derivative % (Figure 21 b)). The fact that no significant shift to higher temperatures occurs for the composite decomposition seems to reinforce the hypothesis that no strong guest-host interactions occur.
In the end of the analysis a value of 53 % is registered which is relative to the initial hydrated material. Taking in account the water content in the starting material, this means that 47.67 % of the sample did not degrade which corresponds to the silica’s percentage in the composite. Therefore, simvastatin is present in the composite with a percentage of 47 (w/w).
a)
29
Dielectric Relaxation Spectroscopy (DRS)
Having in mind DSC and TGA results which indicate that the sample SBA-15_SIM is not completely dried, the first dielectric measurements were done in order to remove water without inducing any additional changes to the sample. With this purpose, the sample in the BDS cell was heated up from -120 ºC to 60 ºC in two successive scans carried at a rate of 10 ºCmin-1 being kept at this temperature during 30 minutes in each scan, in a total of 1 hour drying. In Figure 22, are compared the permittivity values obtained at 104 Hz of two different scans taken after each thermal treatment at 60 ºC green squares (1st heating) and orange circles (2nd heating) of SBA-15_SIM.
Figure 22 – Isochronal representation of 𝜀" taken at 104 Hz on heating before and after drying thermal treatment.
After this procedure, two successive series of isothermal spectra covering the frequency range from 10-1 to 106 Hz
were collected on heating from -120 ºC to 150 ºC in steps of 5 ºC.
30 Figure 23 – Isothermal measurements at the frequency of 104 Hz of SBA-15_SIM and SIM. Data obtained from
isothermal measurements at the frequency of 104 Hz of both isothermal series are shown in function of temperature,
in which is called an isochronal (same time/frequency) plot; the values obtained for native simvastatin are included for comparison. In the following text a description of the results is carried out.
At the lowest temperatures a wide and low intense peak is observed, as found after the thermal treatment up to 60 ºC. By comparing with native simvastatin, it can be assigned to the sub-glass dielectric response of the drug, however, losing some resolution. While in native SIM two secondary processes, named and β in increasing order of temperature, can be found, in the composite only one broad process is observed. Moreover, its magnitude in the 2nd scan, taken after heating up to 150 ºC, is reduced which indicates that the thermal treatment up to 60 ºC was insufficient to remove the more strongly bounded water molecules either to the drug itself or to the silica matrix. Remembering Figure 19, the endotherm of water evaporation of the unloaded silica extends up to 120 ºC, therefore an efficient water removal was only achieved after attaining such high temperature.
31 being the reason why the frequency of 104 Hz is used. In the composite, this peak is shifted ~30 ºC to higher temperatures in coherence with the deviation observed in the main step of the glass transition of the composite seen by DSC (remember Figure 20). This could be due to SIM-silica interactions hindering motional rearrangements. Furthermore, after a more efficient water removal, in the second scan up to 150 ºC, a slightly shift of the main process to lower temperatures occurs; a scale-up evidencing the shift of the main process between the two scans is included Figure 24. Since statins in general are known by their amphiphilic nature having both hydrophilic and hydrophobic regions47, water can interact via hydrogen bonding with the more polar hydroxyl and carbonyl moieties. After water elimination these interactions are suppressed rendering the guest drug slightly more mobile, however to confirm this hypothesis more experiments should be done.
Figure 24 – Scale-up evidencing the shift of the main process between the two scans.
32 Figure 25 – Isothermal representation of: a) 𝜀" and b) M’’ for spectra collected from 0 ºC to 150 ºC every 5 ºC.
Two different relaxation peaks in 𝜀"vs.𝑓 can be observed in SBA-15_SIM which shift
to higher frequencies upon temperature increasing; this is an expected result since heating enables molecular mobility that is probed by the reorientational motion of dipoles. Additionally, at the highest temperatures the contribution of conductivity, i.e., translational motion of charge carriers,
is clearly distinguished in the low frequency side of the spectra. While in the 𝜀"(𝑓) plot, the conductivity emerges as a low frequency tail, in the M” representation, this contribution arises as another peak (see for example, isotherm at 150 ºC).
In order to extract information about the dynamic behaviour of simvastatin in this composite, peaks observed in the isochronal representation of M”, (see Figure 26), has been individually analysed. To simplify, the secondary relaxations has been not considered for this study, and only data concerning the supercooled liquid (above the glass transition temperature) has been investigated.
Figure 26 – M” vs T at 𝑓 =104 Hz for a) native simvastatin and b) SBA-15_SIM; the Gaussians functions used for
the fitting procedure are included besides the overall global fit.
The simulation of the peaks in the isochronal plot was made with the help of a sum of Gaussian functions. Only processes detected above Tg will be analysed. The fit of data represented vs. temperature was done by superposition of Gaussians functions, as it is exemplified in Figure
a) b)
33 26 (analysis done with the software Origin® 8). Each Tmax corresponds to a specific frequency that will be here designated as 𝑓𝑚𝑎𝑥. Since the relaxation time is related with frequency according to 𝜏𝑚𝑎𝑥 = 1/2𝜋𝑓𝑚𝑎𝑥 (Equation 3) a relaxation time can be estimated. This was carried out for the two series in a temperature/frequency range where the peaks associated with the α-process are observed (~between 53 ºC and 143 ºC). Having all the set of (Tmax, 𝜏𝑚𝑎𝑥), a relaxation map was drawn by representing –log10 ( 𝜏𝑚𝑎𝑥) vs. the temperature reciprocal (1/ Tmax). This plot is used to provide the dynamical fingerprint of a system being represented in Figure 27 for the two series; the equivalent plot for native simvastatin is included for comparison (open circles). It obvious the significant shift of the relaxation times towards higher temperatures, as already seen in the isochronal representation at 104 Hz (remember Figure 22), denoting the hindrance of molecular mobility of SIM in the silica matrix relative to native SIM. Furthermore, the second series is deviated to lower temperatures relative to the first one as previously discussed. This shift could be explained by inefficiency of the initial treatment at 60 ºC that was not enough to remove residual water.
Figure 27 – Dependence of logarithm of relaxation times of the different relaxation processes detected in SBA_15-SIM sample. Filled symbols correspond to 1st heating series and cross symbols refers to 2nd heating series. Data from
native simvastatin for the e processes have been also included for comparison in open symbols. Solid lines correspond to the respective Arrhenius and VFTH fits. The Tg value included corresponds to that obtained from the
34 In Table 4 the activation energies and pre-exponential factors of all the processes detected in SBA-15_SIM are summarized. Also the Tg values estimated for the τ = 100 s were included.
Table 4 – Activation Energy and pre-exponential of processes presents in SBA-15_SIM.
Ea (kJmol-1) τ0 (s)
α-process 246,1 4,96E-39 Heating 1 peak 1 177,3 7,47E-26
peak2 186,9 2,39E-25
α-process 241,7 2,90E-39 Heating 2 peak 1 169,9 1,71E-25 peak2 159,9 5,97E-22
These results concurs with the glass transition detected by DSC in which a shift of ~20 ºC to higher temperatures was observed in comparison with the native amorphous drug.
As happen with the main α-process, also conductivity is largely shifted towards higher temperatures meaning that i) a correlation exists (as found for several glass forming systems)48 between the structural α-process and the charge transport mechanism and ii) charge transport is highly impaired in the composites.
35
Release assay
Solubility of native simvastatin was also monitored under identical conditions described in (2.2.7 Drug Release Experiments) during 48 hours. Some representative spectra taken at different
times are shown in Figure 28 showing as the characteristics peaks of SIM become clearer defined with time.
Figure 28 – UV-Vis absorbance spectra obtained for bulk simvastatin: until pink line, taken every hour and next every eight hours. Vertical line indicates λ = 238 nm which has been taken as reference for posterior analysis. The
mass of simvastatin placed in the membrane was 0.45 mg.
It is important to note that after 48 hours of experiment it was observed that SIM is still in the membrane (Figure 29), indicating that the release was not complete.
Figure 29 – Dialysis membrane after finishing the solubility assay of 0.45 mg of simvastatin.
36 A similar procedure was applied for monitoring the simvastatin release from the silicas. The masses of these samples placed in the membranes were close to 0.7 mg, taking into account the TGA results that indicate approximately 50% of SIM in composites, the mass used in the experiments would correspond to approximately 0.45 mg of native simvastatin and 0.45 mg of silica. In that way, the influence of the mass was minimized facilitating the direct comparison between results from composite and native drug.
In Figure 30 it can be seen the evolution of its concentration as well as the SIM release obtained from the SBA-15_SIM and SBA-15_F_SIM composites.
Figure 30 – Solubility and release profiles of bulk simvastatin, SBA-15_SIM and SBA-15_F_SIM obtained at
λ=238 nm.
Since simvastatin in solubility assay is in crystalline state, the higher concentration obtained from the SBA-15_SIM and SBA-15_F_SIM is a clear indication that the amorphous state increases the solubility.
37 From the concentration vs. time plot it was possible to estimate the quantity of simvastatin
released. At the end of 24 hours this corresponds to around 1% in both silicas and less than 0.8% in native simvastatin.
In Zhang, P. et al, the release profile of simvastatin from polycaprolactone microspheres
was monitored during 30 days (at 37 ºC) that can be taken as an indication of the slow release50. Also in Huang, X. et al, it was shown as simvastatin loaded in calcium sulphate scaffolds needs
more than two weeks for a complete release51.
Cytotoxicity assay
The recommended daily dose of simvastatin is 40 mg, which can go up to a maximum of 80 mg in exceptional cases and a minimum dose of 10 mg52. In this work, the calculations to define the concentrations to be tested (Table 5) were made having as base litres of blood of an adult person that are 6 litres53.
Table 5 – Tested concentrations in cytotoxicity assay.
In the Table 5 are represented the results from cytotoxicity assay with concentrations ranging from 0.0078 to 1 gL-1. It is usually considered that samples present cytotoxicity if the cell viability is below 70%.
Figure 31 – Cytotoxic evolution of SBA-15, SBA-15_SIM and SIM on Caco-Co2 cells. Results are expressed as mean
± SD of three independent experiments performed in triplicate.
Concentration (gL-1)
38 According to Figure 31 it is possible to observe that SBA-15 is not cytotoxic for organism, since the cell viability is always above from 70%.
Otherwise, simvastatin when tested in concentrations near from de maximum dose (80 mgL-1 = 0.08 gL-1) is cytotoxic. Once incorporated in SBA-15, there is not verified any signal of cytotoxicity. Even more, the 70% (for instance) of mortality is only achieved when ~0.25 gL-1 is used. This can represent a good advantage in using this system in the bone regeneration, one of the applications of statins that have been gaining a growing interest. For this application, it is required to the local levels of simvastatin those at high concentration and for an extended periods of time54, factors that in light of these results could be obtained.
Moreover, this composite could be used for longer times since it can be observed that there is a controlled delivery even using higher concentrations of SIM. In fact the encapsulation of the drug inside the silica matrix retains the drug in such a way that permits the use of higher concentrations for longer times which is not possible with free drug. In this sense, the efficiency
39
Conclusions
Among the different strategies developed by the pharmaceutical industry to turn more soluble the existing drugs, the modification of its physical state is a promissory way, namely their amorphization, since the amorphous state is characterized by a high intrinsic disorder that promotes higher solubility. In the present work, a drug delivery system has been prepared and characterized with the aim to improve the water solubility of a drug taking advantage of the amorphous state.
The studied drug, simvastatin, is frequently used to reduce the levels of cholesterol in blood but also with high efficiency in the bone regeneration. Besides drug’s amorphization, which
was accomplished by incorporation inside SBA-15 mesoporous matrices, the work also envisaged to correlate guest-host interactions with the drug delivery profile. Therefore, unmodified (SBA-15) and functionalized by methylation (SBA-15_F) mesoporous silica matrices were synthesized and used as drug carriers. The characterization of the silicas surface was performed by scanning electron microscopy and transmission electron microscopy; their pore sizes were estimated by textural analysis as 6.8 nm for SBA-15 and 6.7 nm for SBA-15_F.
Attenuated total reflectance, NMR and thermogravimetric analysis gave evidence efficient inclusion in matrices. By TGA a loading percentage of 49 % (w/w) in the composite was determined corresponding to a pore filling of 98 % (v/v) unmodified silica matrix.
Native SIM’s phase transformations were studied by differential scanning calorimetry (DSC), allowing identifying melting as an exothermic peak centred at 140 ºC. Upon cooling from the melt, crystallization is circumvented and SIM vitrifies. The glass transition, is detected in subsequent heating, is clearly seen with a midpoint temperature (Tg,mid) of 33 ºC. In the composite SBA-15_SIM, the glass transition is also detected at 59 ºC with no endothermal event being registered due to melting. By one side, this shows that the drug is in the amorphous state and, by other side, it reveals an increase in the glass transition temperature relative to the native drug, i.e.,
the drug becomes less mobile inside pores. To have an insight in the molecular mobility of SIM inside SBA-15 pores, dielectric relaxation spectroscopy (DRS) was used. Results indicate a shift of the spectral response to lower frequencies meaning that molecular motions relax at a lower rate compared with native SIM, as deduced from calorimetric results. The mobility hindrance is due to interactions with the inner surface of the silica matrix, although ATR-FTIR and TGA analysis gave no evidence of strong interactions.
40 Release essays were done to simulate drug delivery in organism using conditions similar to intestinal fluid such as pH 6.8. Monitoring by UV-Vis spectroscopy showed that simvastatin is easily released from both silica. Preliminary results show that the release from both types of drug carriers is highly enhanced relatively to the native drug dissolution and suggest a faster release from the unmodified silica, most probably due to a lower extent of guest-host interactions. The absence of cytotoxicity and the ability to release the incorporated drug, allow concluding that the studied composites are promissory to be used as drug delivery systems.