Departamento de Química
Dynamic and Interaction of Cytochrome c with Pf1 Virus
Por: Patrique Nelson Ramos Nunes
Dissertação apresentada na Faculdade de Ciências e Tecnologia da Universidade Nova de Lisboa para
obtenção do grau de Mestre em BioOrgânica.
Orientador: Doutor Francisco Jorge Caldeira
Juri:
Doutor João C. Lima, assistido por Franciso J. Caldeira e presidido por Pedro J. Abreu
Dynamic and Interaction of Cytochrome c with Pf1 Virus
Copyright em nome de Patrique Nelson Ramos Nunes, da FCT/UNL e da UNL,
A faculdade de Ciências e Tecnologia e a Universidade Nova de Lisboa têm o direito, perpétuo e sem
limites geográficos, de arquivar e publicar esta dissertação através de exemplares impressos
reproduzidos em papel ou de forma digital, ou qualquer outro meio conhecido ou que venha a ser
inventado, e de a divulgar através de repositórios científicos e de admitir a sua cópia e distribuição
com objectivos educacionais ou de investigação, não comerciais, desde que seja dado crédito ao autor
Acknowledgments
Muito são aqueles a quem devo uma palavra de apreço e gratidão por todo o apoio, e principalmente
pela sua constante presença durante a realização desta tese. No entanto, não posso deixar de referir
algumas pessoas. Ao professor Jorge Caldeira, quero agradecer ter-me aceite desde logo para a
realização do estágio no seu laboratório. Quero ainda agradecer o incentivo e apoio constante que me
deu ao longo destes últimos tempos, a disponibilidade para discutir qualquer resultado experimental e
a informação transmitida para por exemplo efectuar um cuidadoso planeamento de experiencias, e
ainda toda a sua amizade.
To Professor Peter Eaton, I want to express my gratitude for receiving me in his lab and for all the
enthusiasm and information transmitted me over the last year or so.
Ao Prof. Dr. Nuno Santos, Marco Domingos e seus colaboradores, quero agradecer as instalações e
equipamentos disponibilizados assim como toda a ajuda e o muito que apreendi com eles em na área
de espectrofotometria (DLS e Potencial Zeta mais precisamente). A Ana Teresa toda a ajuda
prestadada para a realização deste trabalho.
Um muito obrigado ao grupo de NMR; Eurico Cabrita, Maria do rosário e em especial para o Aldino
pelas respostas às inúmeras perguntas que me foram surgindo.
Aos meus colegas e por último quero agradecer á minha família e amigos o constante incentivo a sua
Aos meus pais e irmãos
Resumo
Palavras-chave: Citocromo c; vírus Pf1; Complexo Estequiometrico; interacção electrostática; Força
iónica, DOSY-NMR.
O Citocromo c é uma proteína positiva e a superfície do Pf1 virus é negativa formando fortes
complexos electrostáticos. Quando o rácio crítico de concentrações entre o Citocromo c e o vírus Pf1 é
atingido surge a formação espontânea do seu complexo, cerca de 1.700 moléculas de citocromo c para
uma partícula de Pf1. O efeito da concentração de sais no complexo formado foi medido por dispersão
dinâmica de luz, Com o aumento da concentração de sal monovalente o complexo desagrega.
A dissociação gradual do agregado permite a obtenção dos espectros de RMN do citocromo c.
Dependendo da relação vírus/Citocromo c ou da força iónica é possível a partir de proteínas e vírus
livre em solução mudar para estado de ligação transiente ou formar um complexo totalmente
imobilizado. A análise da variação dos deslocamentos químicos durante a titulação de sal permitiu
mapear as regiões mais afectadas do citocromo c junto do co-factor hemico oxidado, devido à ligação
ao vírus Pf1.
Amostras desidratadas e em estado de líquido com citocromo c e Pf1 em diferentes proporções e pHs
foram observadas por microscopia de força atómica.
Acima da concentração de sal crítica de dissociação do complexo observou-se a diminuição gradual do
coeficiente de difusão do citocromo causado pelo maior teor de vírus Pf1 em solução –(RMN
DOSY-PGSE). Concluímos que existe uma forte correlação eletrostática entre o vírus PF1 e o Citocromo c
Abstract
Keywords: Cytochrome c; Pf1 virus; Stoichiometry Complex; Electrostatic Interaction; Ionic Strength;
NMR-DOSY.
Cytochrome c is a positive protein and the Pf1 virus surface is negative forging strong electrostatic
complex. When a critical ratio concentration of Cytochrome c and Pf1 virus is achieved a spontaneous
complex is formed. The maximum association upon addition of cytochrome c to Pf1 solutions is about
1700 cytochrome c molecules to one Pf1 virion particle. The effect of univalent salt concentration on
protein-polyelectrolyte complex formation was measured by Dynamic Light Scattering. Complex
disaggregation occurred when monovalent salt concentration increased.
The assembly process was also observed by NMR at low salt concentration in the system. The
aggregate can be gradually dissociated in order to enable NMR spectra acquisition. Depending on
virus/cytochorme c ratio or ionic strength concentration we could shift from free protein and virus in
solution to transient binding or fully immobilized complex. It was possible to map the most affected
regions of the oxidized heme cytochrome c, with chemical shift variation due to the binding to Pf1
virus, during salt titration.
Dry and liquid samples of Cytochrome c and Pf1 at different ratios and pH were studied and evaluated
by Atomic Force Microscopy.
The system was also studied above the critical salt concentration of complex dissociation by
PGSE-DOSY NMR. A gradual decrease in the translational diffusion coefficient of cytochrome was caused
by higher content of Pf1 virus in solution. We conclude that a strong electrostatic correlation between
Table of Figures
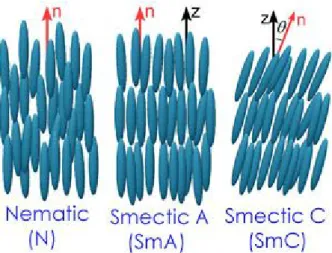
Figure 1.1: Ordered phases of a t hermot ropic liquid cryst al arranged from left t o right in order of increasing order and decreasing temperat ure. ___________________________________________________________ 20
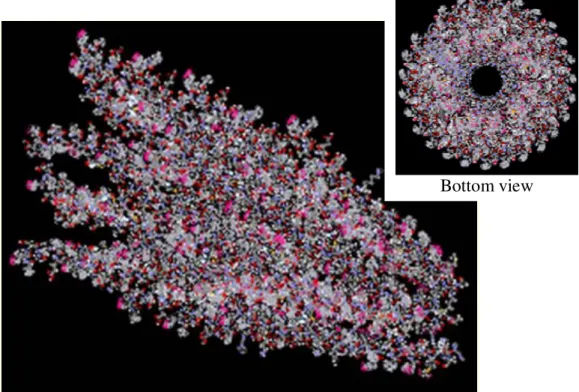
Figure 1.2 - representation of Pf1 bacteriophage capsid structure models coloured by Cβ side-chain order paramet ers, show ing a mixture of dynamic (green and yellow ) and st atic (blue) sit es mapping to t he out er surface of t he virion exposed to solvent. The view s are of only a small sect ion of the entire Pf1 virion. ______ 21
Figure 1.3 – Represent ation of horse heart cytochrome c st ruct ure (green- aminacid chain; in the cent er t he Heme __________________________________________________________________________________ 24
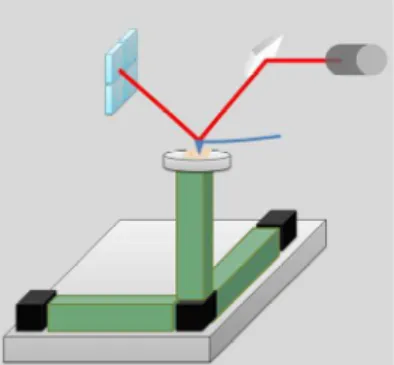
Figure 1.4 - Light Lever Sensors AFM Block diagram of the elect ronics employed for vibrating mode AFM scanning. The signal used for feedback can be select ed by sw it ch a, b or c. Swit ch is for DC feedback, b for phase feedback, and c for amplitude feedback. ______________________________________________________ 25
Figure 1.5 - The light scat tered at an angle of det ermined angle is combined w ith t he reference beam. This produces a fluct uat ing intensity signal w here the rat e of fluct uation is proportional to t he speed of the part icles. A digit al signal processor is used t o ext ract t he charact erist ic frequencies in t he scat t ered light. ___________ 26
Figure 1.6 a) Right - Schematic of t he elect rical double layer and t he line represent the elect rical double layer dist ribution. The elect rical pot ent ial dist ribution (0; bulk) on t he bulk solut ion can be described by t he Poisson dist ribut ion by Gouy model. b) Left – Zoon in of t he pot ential dist ribut ion w ere: (0) surface pot ent ial; () St ern pot ent ial and () Zet a pot ent ial ______________________________________________________ 27
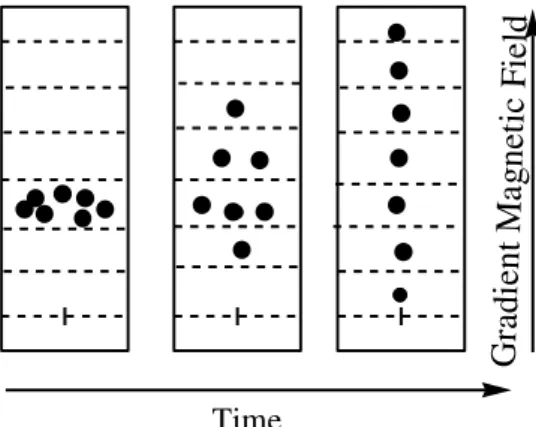
Figure 1.7 – Representat ion of labeled part icles samples motion on a NM R tube applying a gradient of M agnet ic field in function of t ime (diffusion t ime). _______________________________________________________ 29
Fig 2.1 - Cytochrome c absorbance in t he supernat ant (aft er cent rifugation of the precipitat ed complex) det ermined by UV-Visible spect roscopy at 410nm. Cytochrome c w as st epw ise added in order to have increasing cyt ochrome c concent rat ion in the cuvet te, w it h tw o Pf1 virus concent rations: (■) 0.6mg/ ml and (□) 0.25mg/ ml. _______________________________________________________________________________________ 30
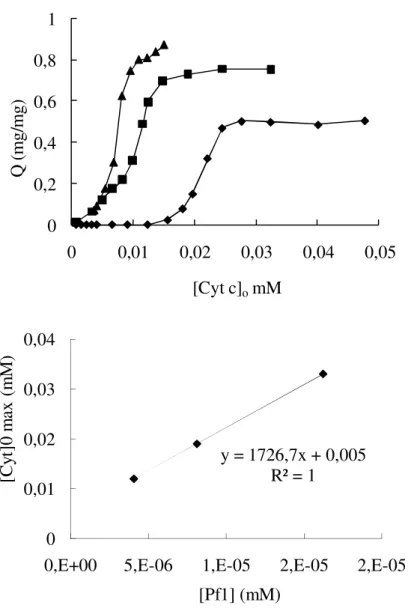
Fig. 2.2 - a) Amount of complexed cytochrome c per mol of t he Pf1 virus against the init ial concent ration of cyt ochrome c in solution. Phosphat e buffer 2mM , pH 7, Pf1: (▲) 0.15mg/ ml, (■) 0.25mg/ ml and (♦) 0.6mg/ ml. The concent rat ion of cyt ochrome c corresponding t o t he highest value of capacity Q on each plot w as visually det ermined, and it was plot t ed in b) as a funct ion of Pf1 concent rat ion. The result of a linear fit is shown. ___ 31
Fig. 2.3 – NaCl and NH4CH3COO effect on Pf1/ Cytochrome c complex st abilit y. Concent rat ed salt solution w as added in order t o set the final ionic st rength. Cyt c/ Pf1 mass rat ios show ed in: (1) Fig. a): () 1/ 1, () 7/ 1, () 15/ 1, (♦) 30/ 1 and (2) Fig. b): (○) 2/ 1, () 9/ 1, () 44/ 1 (♦) 87/ 1. ____________________________________ 32
Fig. 2.4 - Relat ionship bet w een Cyt ochrome c/ Pf1 rat io and t wo different salt dissociation were used: () Amonium acetat e (■) Sodium chloride. ________________________________________________________ 32
Fig. 2.5: Dynamic Light Scat t ering Int ensit y (%) of Pf1 virus (0,1mg/ ml) w ith Cytochrome c (10-100ug/ ml) at pH 7.0 w it h different Pf1/ Cyt c mass rat ios: (○) 8/ 1; (∆) 6/ 1; (■) 4/ 1. ___________________________________ 33
Fig. 2.6: Zet a Pot ent ial varying Pf1/ Cytochrome c virus mass rat ios keeping t he virus concent rat ion at 0.1mg/ ml, pH w as adjust ed using Phosphate buffer at 7.0. ________________________________________ 34
Figure 2.7: Est imat ed charge over pH range, w ere dashed point represent t he product bet w een Cyt c and Pf1; t he black line the Cyt / Pf1 rat io; Red line is t he Cyt ochrome c and at blue t he Pf1 virus. __________________ 35
Figure 2.9: Surface representat ion of the samples obtained from figure 2.9, w ith the possible t wo cyt ochrome c molecules bet w een t wo Pf1 rod virus environment s. _____________________________________________ 36
Fig. 2.9 (A) - Left - Low field Cytoct home c NM R signals of t he of Cyt ochrome c/ Pf1 virus on mass ratio 1:1 (20mg/ ml) of the tit rat ion wit h NaCl salt [3.3 to 350]mM. (B) - Right - Same condit ions and procedure w ithout Pf1 virus. Heam - HM 8(×), HM 3:(), HA71(○); His18 – HB1(■), H4(▲), () and maybe (); H2(-); M et 80 HB1(□) and/ or (* ),().. ___________________________________________________________________________ 37
Fig. 2.10 - Comparison bet w een the 1H-NM R peaks int ensit y of Cyt c wit h Pf1 at rat io 1:1 increasing NaCl concent rat ion. Haem - HM 8(■), HM 3(), HA71(), HA72(▲); His18 – HB1 (), H4 (* ), () and/ or (○); M et 80 – HB1(□). ________________________________________________________________________________ 38
Fig. 2.11 Colored ident ified peak show the chemical shift s deviat ions bet w een 0,19 t o 3,7 ppm on a logarit hmic scale. The heme, along wit h amino acids w ith assigned peaks are show n in gray. ______________________ 39
Figure 2.12 – Self diffusion of Cyt ochrome c in presence of Pf1 at various rat ios. At left YY axis (○) Diffusion coefficient and at right the calculat ed equivalent (■) Hydrodynamic radius. ___________________________ 40
Figure 2.13 - t op (or bot tom) view represent ation of t he maximum prot ein packing about t he virus surround knowing t he perimet er for t he circle: _________________________________________________________ 40
Figure 2.14 - Left : Hexagonal and square packing w ere t he rect angle rod represent ed as t he Pf1 virus. Rigt h: square and t riangular geomet ric representat ion result ing of t he hexagonal and square packing of Cytochrome c around the Pf1 virus. ______________________________________________________________________ 41
Figure 2.15 – Represent ation of the cyt ochrome quant ity around Pf1 perimet er. _______________________ 41
Table of Contents
Acknowledgments ... 3
Resumo ... 5
Abstract ... 7
Table of Figures ... 9
Table of Contents ... 11
Abbreviations and Symbols ... 13
1. INTRODUCTION ... 14
1.1.
Nanomaterials Fabrication Techniques ... 16
1.2. Molecular Assembly Models ... 18
1.3. Liquid Crystal ... 19
1.4. Magnetic field orientation ... 20
1.5. Pf1 -Bacteriophage ... 21
1.6. Horse Heart Cytochrome c ... 23
1.7. Analytic techniques ... 24
1.7.1. Atomic Force Microscopy (AFM) ... 25
1.7.2. Dynamic Light Scattering (DLS) ... 25
1.7.3. Zeta Potential ... 27
1.7.4. NMR - Diffusion Ordered SpectroscopY (DOSY) ... 28
2. RESULTS ... 30
2.1. Complex stoichiometry of the Pf1/ Cyt c mass ratio ... 30
2.2. Effect of salt addition on Pf1-Cytochrome c stability ... 31
2.3. The size of Pf1/Cytochrome c aggregates ... 33
2.4. Zeta potential measurements... 34
2.5. pH influence on Cytochrome c /Pf1 complex ... 34
2.6. Atomic Force Microscopy ... 35
2.7. NMR titration of Pf1 / Cytochrome c sample with NaCl. ... 36
2.9. Mass ratio calculation of Cytochrome c and Pf1 virus... 40
2.9.1. Geometric calculations of the ideal mass ratio Cyt c versus Pf1 ... 40
3. DISCUSSION ... 43
3.1. Stoichiometry of Pf1 virus cytochrome c complex ... 43
3.2. Ionic strength ... 43
3.3. DLS discussion (force; size;polydisperse)... 44
3.4. Zeta potential discussion ... 45
3.5. pH discussion ... 46
3.6. Chemical shift discussion ... 46
3.7. DOSY discussion ... 47
3.8. Discussion; AFM and geometric mass ratio calculations ... 47
4. CONCLUSIONS and FUTURE WORKS ... 49
5. MATERIALS and METHODS ... 50
5.1. MATERIALS ... 50
5.2. METHODS ... 50
Abbreviations and Symbols
Ø –diameter
l - Length
AcAm – Amonium Acetate
AFM - Atomic Force Microscopy
CNT - Carbon NanoTube
CPMV-Cowpea Mosaic Virus
Cyt c – Cytochrome c
D
eff– Effective Diameter
DLS - Dynamic Light Scattering
DOSY – Diffusion Ordered SectroscopY
EDL – Electrical Double Layer
EPR – Electronic Paramagnetic Ressonance
F-Actin – Actin filament
fd – Filamentous bacteriophage
HR-MAS - High Resolution Magic Angle Spinning
HRTEM - High-Resolution Transmission Electronic Microscopy
I. p. – Isoelectric Point
LbL - The Layer by Layer technique
LC – Liquid Crystal
M13 - The M13 Filamentous Virus
MT – Microtubules
NaCl – Sodium chloride
NMR – Nuclear Magnetic Ressonance
PALLES software to predict sterical molecular induction alignment.
PEG - Poly(Ethylene Glycol)
PEMs - PolyElectrolyte Multilayers
Pf1 – Pseudomonas phage Pf1
PGSE – Pulse Gradient -field Spin-Echo
RDC – Residual Dipolar Couplings
RNA & DNA – RiboNucleic Acid and DeoxyriboNucleic acid
SEM - Scanning Electron Microscope
Sm - Smectic phase
SMA - Shape Memory Alloy
SmA - Smectic A phase
SmC - Smectic C phase
STEM - Scanning Transmission Electron Microscope
TEM - Transmission Electron Microscopy
1. INTRODUCTION
Nature provides inspiration for designing materials and systems that derive their functions from highly organized structures. In organisms, molecular recognition of metals by proteins control interactions and is following by the self-assembly to create major organization. Proteins could also be used in controlling materials formation in practical engineering via self-assembled, hybrid, functional materials structures. The matter manipulating on an atomic and molecular level means that all existent structure organization on nature can be called nanotechnology. Whether metallic for example Shape-Memory Alloys (SMA) are metals that, after being strained, at a certain temperature or electric field revert back to their original shape. A change in their crystal structure above their transformation temperature causes them to return to their original shape. SMA have applications in medical, and aerospace industries; whether organic like the fabrication of highly oriented carbon nanotube (CNT) on liquid-crystalline solution arrays to be used for thin-film transistors,.1or even organo-metalics.
Over the past decades, self-assembly has attracted a lot of research attention and transformed the relations between chemistry, materials science and biology leading to self-assembly techniques. Three different research programs of self-assembly in nanotechnology in order to characterize their implications are: Hybridization (using the building blocks of living systems for making devices and machines; Biomimetics (making mimicking nature) and both of them used simultaneous2,3. Under certain conditions the molecules organize themselves into structures based on the principle of the weak interactions such as: hydrogen bridges; hydrophobic interactions; electrostatic and Van der Waals forces. There are a number of theoretical approaches on electrostatic binding, the most relevant effect is the counterion condensation theory expressed by the Poisson-Boltzmann equation4. The counterion distribution can be explained by a competition between thermal and electrostatic potential energy which regulate the counterion dissociation in the solution. The density charge of the ionic environment can be well described, considering the ion as a point charge at a distance (radius) in which like-charged objects such as polyelectrolytes electrostatic interactions between like-charged surfaces in water are dominated by counterion behavior.
nearest-neighborhood charge spacing on the polyion is sufficiently close, so that two or more groups can cooperate in holding the counterion. The larger the association constant, the larger will be both the number of associated counterions and the stability of each binding. Specific and nonspecific counterion binding occurs simultaneously while one can be the dominant.
One interesting material with unique properties of spontaneous self-assembly are the virus particles. Virus particles consist of a viral genome surrounded by a protein capsid. The genome can be single-stranded or double-single-stranded, composed of RNA or DNA, and stored in one or more polynucleotide chains. The surrounding capsid is assembled by the association of the repeat units of similar or identical proteins5. Experiments using genetic modifications of the M13 virus and synthesis of a heterobifunctional linker molecule were designed to specifically bind each modified virus end, leads to amazing 1D ring structure6. This genetic modifications set out to explore the possibility of encoding size and shape information into self-assembling other viruses. This kind of genetic modification provides a way to induce construction on a particular design or order. One end of the M13 virus was also genetically modified to nucleate or bind to a desired semiconductor material by A. Belcher group. These nanocrystal-functionalized viral building blocks were grown into ordered hybrid self-supporting films. In order to align other materials, anti-streptavidin viruses were the virus first selected to bind streptavidin protein units. This allows a universal handle for the virus to pick up any material that has been covalently conjugated to streptavidin. Then the self assembling nature of this anti-streptavidin virus can be exploited to make organized hybrid materials and the anti-streptavidin M13 viruses having specific binding for the streptavidin7.
Genetic engineering also take advange of the protein repetitions to form the capsid virus, modifying substrate specificity of peptides to include some metals (ZnS, CdS; CoPt; FePt) for the synthesis of single-crystal, and chemically ordered nanowires. M13 has about 2700 copies of the gP8, which was genetically modified, and during nanoparticle nucleation peptides can been expressed on the highly ordered filamentous capsid of the M13 bacteriophage. The incorporation of specific, nucleotide peptides provides a viable template for the directed synthesis of semiconducting and magnetic materials or individual crystalline nanowires.8
1.1.
Nanomaterials Fabrication Techniques
The Layer by Layer (LbL) technique is based upon the alternate adsorption of oppositely charged species from aqueous solution, and possesses unprecedented control of materials selection (e.g. polyelectrolytes, clays, nanoparticles, proteins), materials properties (e.g. conductivity, glass-transition temperature) and architecture (e.g. blends, stratified-layers, pores). These advantages make LbL assemblies excellent candidates for use in batteries, electrochromic devices, solar cells, sensors and drug delivery control. A. Belcher group worked on pharmacological drug delivery systems. These systems made possible to control the concentration to deliver the desired substances using LbL interfaces material. The same group use biological and non-biological assembly methods for fabricating and positioning small battery components that may enable high performance microbatteries with complex architectures10. Polyelectrolyte multilayers deposited by electrostatic LbL assembly techniques and others nanostructure electrodes or multidimensional architectures of new battery designs have an improvement on electrochemical performance. A self-assembled layer of virus-templated cobalt oxide nanowires serving as the active anode material in the battery anode was formed on top of microscale islands of polyelectrolyte multilayer´s serving as the battery electrolyte, and this assembly was stamped onto platinum microband current collectors. The resulting electrode arrays exhibit full electrochemical functionality. This versatile approach for fabricating and positioning electrodes may provide greater flexibility for implementing advanced battery designs and microelectrodes or 3D architectures. With an ever-increasing need for thin, flexible and functional materials in electrochemical systems, the LbL technique provides a simple and affordable route in creating new, active electrodes and electrolytes.
molecule architectures, requiring a deep understanding of individual molecular building blocks, their structures, assembly proprieties and dynamic behaviours. The chemical complementarities and the structural compatibility confer the weak and noncovalent interactions that bind building blocks during self-assembly13. Using the “bottom-up” method it is possible to prepare functional polymeric materials (semiconducting, metallic, and magnetic nanowires) based on self-assembly of polymeric supramolecules. The techniques constitute a general platform for constructing materials that combine several properties that can be tuned separately.
macromolecules are negatively charged, rodlike in shape, and lateral association is induced by a number of cations such as divalent and trivalent metal ions and homopolymers of basic peptides19.
Wong and co-workers have used genetically engineered lysozyme with different monodisperse net charges to understand and manipulate the stability of self-assembled actin–lysozyme complexes (actin, an anionic polyelectrolyte, and lysozyme, a cationic globular protein). They discovered that in the presence of salt there was a high interaction between osmotic and electrostatic effects, showing that complexes between actin and lysozyme are stable with very high salt concentration. The existence of this counterintuitive like-charge attraction cannot be explained within the approaches such as the Poisson–Boltzmann theory. This fact is related to the osmotic pressure of the ion that is essential for the electrostatic bonds between particles of opposite charge. The changes in system energy translate thermodynamically in enthalpy changes. The explanation of the competition between thermal and electrostatic potential energy as a reason for counterion binding. For the stronger binding of multivalent ions onto polylelectrolytes the reason is not the stronger electrostatic force, but it is due to entropic effects which keep the free energy of this process negative (as it occurs spontaneously)20,21.
Mixing solutions of polyanions and polycations leads to spontaneous aggregation under release of counterions. The level of aggregation depends on the nature of the components, on the medium and external conditions. For free polyelectrolyte chains the low molecular mass counterions are more or less localized near the macroions in the case of high charge densities, particularly because of counterion condensation. However, other interactions such as hydrogen bonding hydrophobic steric effect may play an additional part to order particles organization22.
1.2. Molecular Assembly Models
ordered arrays of charged rods in equilibrium with a bulk salt solution corresponding. Alexander P. Lyubartsev have done calculations of the electrostatic osmotic pressure for a closely packed phase of laterally ordered rodlike fd or M13 virus particles at equilibrium with a bulk salt solution. This direct application of simulation to a specific experimental system is made possible by performing the Monte Carlo simulations within the grand canonical ensemble and the calculations agree with the results from light scattering measurements, salt titrations and NMR result in this work which sensitively detect the formation of laterally ordered virus aggregates,24.
Self-organization of molecules can be obtained by applying an external field, such as electric, magnetic or mechanic. Self-assembly of two building blocks affinities is the beginning in order to create structures but is it has been demonstrated that several types of rod-shape viruses form well-controlled liquid-crystalline phases like tobacco mosaic virus or M13 virus. Fibers made from liquid crystalline suspensions with M13 virus solution just passing through a micrometer diameter capillary to a cross-linking solution resulting in a nematic ordered morphologies due to flowing forces with 10-20um diameter25. These nanocrystal-functionalized building blocks were grown into hybrid ordered self-supporting films. The resulting nanocrystal hybrid film was also ordered including the chiral effects of virus building blocks and providing strong evidence that virus-based film are organized into chiral scemetic C structures (see Fig. 1.1)26.
1.3. Liquid Crystal
Liquid Crystal (LC) materials are a state of matter that share properties of the liquid and crystalline states of matter where molecules have no positional order (like a fluid), but point in a particular direction on average or molecules may form layers in one direction, like a crystal. A LC may flows like a liquid, but its molecules may be oriented like a crystal. The possibilities are nearly endless, with different arrangements of layers, columns, twists and turns coexisting with fluid movement.
Figure 1.1: Ordered phases of a thermotropic liquid crystal arranged from left to right in order of increasing order and decreasing temperature27.
We can define a direction perpendicular to the layers' plane, known as the layer normal, z. There are two basic smectic phases (although many more exist): the smectic A phase (SmA) where the director n points in the same direction as the layer normal, z; and the smectic C phase (SmC) where the director, n, points at some angle to the layer normal, z.
Materials may display one or more of these liquid crystal phases and in general the phases occur in the following order with decreasing temperature: isotropic liquid, nematic, smectic A, smectic C, crystal. Liquid crystals have very sensitive electrical and optical, or electro-optic, properties. It is possible, for example, to orient rod-like liquid crystal molecules by applying an electric field: the field induces a separation of charge in the molecules, producing a torque which tries to align the molecules with the direction of the field.
Functionalized liquid-crystalline materials using virus might provide various pathways to build well-ordered and well-controlled two and three-dimensional structures for the construction of next generation optical, magnetic materials and electronic devices. Even in the presence of multivalent cations, strongly charged anionic polyelectrolytes such as DNA and F-actin can assemble into densely packed aggregates with a behavior of a liquid crystal28.
1.4. Magnetic field orientation
by the use of an applied magnetic field. Many particles orientation was observed by Atomic Force Microscopy such as radial or paralleled geometries organization29.
In solution molecules with an anisotropic magnetic susceptibility will align with the static magnetic field to an extent that is proportional to the magnitude of the susceptibility anisotropy and the square of the magnetic field strength. As a result, by NMR experiments, dipolar couplings have a residual, non-zero value, and chemical shifts depend on B0. This means magnetic field dependent chemical shifts therefore are potentially quite useful as constraints in macromolecular structure determination. Experiences with protein backbone amide 15N nuclei from a DNA fragment were carried with good correlation with the dipolar couplings and the field dependence of the 15N shifts30.
1.5. Pf1 -Bacteriophage
Filamentous bacteriophages have been used to fabricate interesting materials such as robust fibers thin films, genetically engineered to attached quantum dots to produce nanowires31 for fuel cells32. Pf1 bacteriophage (Figure 1.2) has been intensively studied regarding their liquid crystal thermodynamic properties33 derived from their peculiar rod shape34 (l=2µm, ø=6,7 nm), virus capsid protein are strongly negatively charged (-0,472e-/nm2) (I. p. =4.0), due to the presence of 3 aspartic acid and no other charged residues35.Their semi rigid nature ( persistent length 2,2µm)36 and molecular mass 37 MDa, monodispersity and 3D structure with high resolution37.
Figure 1.2 – Representation of Pf1 bacteriophage capsid structure models coloured. Sites mapping to the outer
Its tubular structure has ~4700 protein capsid subunits of 46 aminoacids in the outside with a single strand DNA inside (one subunit per DNA Base) plus some terminal proteins. Due to its high molecular mass Pf1 virus particles are not observable in liquid state NMR. When in the presence of a strong magnetic field39 (>7 Tesla, NMR spectrometer range) the Pf1 virus have an order parameter S higher than 0.9, indicating that the rod virus particles are mostly aligned in a direction parallel to the applied magnetic field. This effect in caused by the sum of the magnetic anisotropy of each capsid protein subunit that is arranged along the virus axis. This liquid crystalline order is also favored at high concentration (>10-15 mg/ml) due to the reduction of exclude volume in solution40. However the strongly negative charged nature of the virus contraries the parallel packing since it maximize electrostatic repulsion, making the perpendicular arrangement of the virus the most favorable electrostatic arrangement.
The influence of the electrostatic field that causes virus-virus repulsion can be more easily pictured with the help of the effective diameter Deff concept41. Since the electrostatic field is a dependent on pH and salt this experimental parameter are easy to control the magnitude of Deff . The Deff can range from (6,7nm) of the bare virus diameter (at high ionic strength or I.p. pH) to much larger (up to 60 nm) at low (~ 1mM) ionic strength42 and neutral pH. The liquid crystalline properties of this solution are therefore critically controlled by these experimental parameters. Detailed theoretical and experimental study of their liquid crystalline properties regarding, pH, ionic strength, applied mechanic or magnetic field are described43. The virus spontaneously tendency to form fibers enabled the determination of their X-ray diffraction44 and solid state NMR45 three-dimensional derived structure. With the generalized application of residual dipolar couplings (RDC) in NMR46 a great deal of research was done in order to find suitable aligning matrix for molecules in solution. Pf1 virus is one of the most versatile aligning media and their results can be predicted with PALES software47.
1.6. Horse Heart Cytochrome c
Cytochrome c is a highly conserved protein across the spectrum of species, found in plants, animals, and many unicellular organisms in other words, every eukaryotic cell living on earth. This protein is associated with the electron transport chain inner membrane of the mitochondrion. Cytochrome c is a small size (molecular weight about 12,000 daltons) and highly soluble protein, unlike other cytochromes, with a solubility of about 100 g/L makes it useful in studies of cladistics. Its primary structure consists of a chain of about 100 amino acids. Many higher order organisms possess a chain of 104 amino acids49.
It is known that cytochrome c is a soluble protein with a positively charged lysine rich region around the exposed heme edge that constitutes the binding domain based on electrostatic interactions with both reaction associates. However, proteins carry positive and negative charges on their surface depending on the functional groups present in the molecule and may be regarded as polyampholytes. Their behaviour in solutions of electrolyte as the function of the pH can be understood on this basis50 The net charge on the protein is affected by pH of their surrounding environment and can have a net positive or negative charge which is balanced at the isoelectric point. As a result, proteins can interact with linear polyelectrolytes of opposite charge in solution.
Figure 1.3 – Representation of horse heart cytochrome c structure (green- aminacid chain; in the center the
Heme52
1.7. Analytic techniques
1.7.1. Atomic Force Microscopy (AFM)
AFM is a technique that measures the three dimensional image of any solid surface of a sample using a sharpened probe, (Figure 1.4).
Figure 1.4 - Light Lever Sensors AFM Block diagram of the electronics employed for vibrating mode AFM scanning. The signal used for feedback can be selected phase or amplitude53.
This instrument can measure images at atomic range.It is essentially composite by a computer, electronics control and a controlled sample position. The diagram on figure 1.4 illustrates a circuit with phase/amplitude detection in the AFM. A laser light is reflected of the back side of a cantilever into a 4 section photodetector. When the probe interacts with the surface the reflected light path will change. The force is then measured by monitoring the change in light entering the 4 quadrant photo-detector. Geometrically, the deflection at the end of the cantilever is equal to the motion of the laser beam across the face of the photo detector. In addition, mechanically modulate, or vibrate the cantilever is often to be a great advantageous to AFM, comparing the modulated signal phase or amplitude to the drive frequency. Summarizing there is several ways to convert electronic signals into images. These signals have different source of the same images: the voltage that goes to the Z piezoelectric ceramic, after the feedback controller; the output of the light lever photo-detector; the measures the displacement of the z ceramic and the amplitude and phase demodulator5455.
Theretofore, dry samples were a requirement for this technique, but more recently liquid cells were developed consisting to put the sample and the tip (sample/probe) in an isolated liquid environment and scanning the particles that are on silica surface. Liquid cell bring enormous advantages since samples can be analyzed keeping the chemical interactions on the know solution conditions. In really, is possible to see the particle behaviour that are attached to the surface when interacting with the solution molecules.
1.7.2. Dynamic Light Scattering (DLS)
Figure 1.5 - The light scattered at an angle of determined angle is combined with the reference beam. This produces a fluctuating intensity signal where the rate of fluctuation is proportional to the speed of the particles. A digital signal processor is used to extract the characteristic frequencies in the scattered light.57
This instrument consist on analyze the light scatters that change in all directions (Rayleigh scattering) when a monochromatic laser light hits small moving particles. This change is related to the size of the particle. The light laser passes through a lens and then hits the cell with the solution. The light is scattered and detected by a photomultiplier that transform a variation of intensity into a variation of voltage (photoelectric effect).
The experiment’s theory is based essentially on two assumptions. The first condition is that the particles are in Brownian motion, as in this situation we know the probability density function. The second assumption is that the beads used in the experiment, are spherical particles with a diameter equivalent to the molecular dimensions. If it is, then it is possible to apply the Stoke-Einstein relation and hence have a formula that easily gives the diffusion coefficient constant (see NMR DOSY section)58.
To fit the autocorrelation data have been generated (e. g. the autocorrelation function) numerical methods are used, based on calculations of assumed distributions, different mathematical approaches can be employed. Analysis of the scattering is facilitated when particles do not interact through collisions or electrostatic forces between ions. 59,60
function available in software packages. One of the most common methods is the cumulative method (far less affected by experimental noise). The first order correlation function of laser light scattered by polydisperse solutions of macromolecules can be written as a sum or distribution of exponentials, with decay rates proportional to the diffusion coefficients of the solute molecules. It is shown that the logarithm of this correlation function is formally equivalent to a cumulant generating function61.
1.7.3. Zeta Potential
Zeta potential is just a technique to obtain more information about the system using the same supporting DLS equipment. Zeta potential is based on dynamic light scattering, with the advantage of characterize “particles charges”. Sized colloidal particles and biological macromolecules typically become charged due to; the dissociation of ionic groups at the particle surfaces into the solution; receive charge is by ion adsorption or by unequal dissolution of the oppositely charged ions of which the particles are composed.62
Figure 1.6 a) Right - Schematic of the electrical double layer and the line represent the electrical double layer
distribution. The electrical potential distribution (0; bulk) on the bulk solution can be described by the Poisson distribution by Gouy model.63
b) Left – Zoom in of the potential distribution were: (0) surface
potential; () Stern potential and () Zeta potential
When a particle moves (ex.: due to an applied electrical field), ions within the boundary move with it, but any ions beyond the boundary do not travel with the particle. This boundary is called the surface of hydrodynamic shear or slipping plane. The potential that exists at this boundary is known as the zeta potential (Figure 1.6 b) that is possible to be calculated, using theoretical models or can be experimentally. From the instrumental viewpoint applying an electric field across the dispersion, particles within the dispersion with a zeta potential will migrate toward the electrode of opposite
charge with a velocity proportional to the magnitude of the zeta potential. The receiving optics is focused so as to relay the scattering of particles in the cell. The frequency shift or phase shift of an incident laser beam caused by these moving particles is measured as the particle mobility, and this mobility is converted to the zeta potential60.
The values of the -potential can give a great contribution to understand the dynamic of a particles aggregation system. If all the particles in suspension have a large negative or positive zeta potential then they will tend to repel each other and there is no tendency to flocculate. However, if the particles have low zeta potential values then there is no force to prevent the particles coming together and flocculating. i. e., attraction exceeds repulsion and the dispersion will break and flocculate. A value of 30 mV (positive or negative) can be taken as the arbitrary value that separates low-charged surfaces from highly-charged surfaces64. Summarizing zeta potential indicates the degree of repulsion between adjacent, similarly charged particles in dispersion. Zeta potential is particularly dependent of the pH and we can easily deduce the ζ-potential vs pH curve. (Positive at low pH and lower or negative at high pH).65, 66, 67
1.7.4. NMR - Diffusion Ordered SpectroscopY (DOSY)
Diffusion Ordered Spectroscopy is a non invasive or destructive technique that gives precious information about the dynamics of particles on solution. Simultaneously with the theory of molecular mobility this technique was developed and able to measuring diffusion coefficients or self-diffusion68. Similar to DLS this technique, it considers that the molecules motion have Brownian molecular motion and the diffusion behaviour is a measure of the translational motion of a molecule. It depends on several parameters like: size; shape of the molecule, as well as physical properties of the surrounding environment such as viscosity, temperature, etc. Assuming a spherical shape, size of the molecule the diffusion coefficient D is described by the stokes-Einstein equation
s
r
kT
D
6
(eq. 1.1)Were k is the boltzman constant, T the absolute temperature, η the viscosity of the liquid and rs the hydrodynamic radius of the molecule. The study of self-diffusion by NMR can be performed by use of gradient field that can spatially labelled molecules, i.e. marked depending on their position in sample tube. As the gradient increase the diffusion signal intensity drop off, is attenuated depending on the diffusion time ∆ and the gradient parameters (g, ). This intensity change is described by:
3 2 0 3 0 exp 2 2
2
q D I I e I I g D (eq.1.2)
length of gradient, and ∆ the diffusion time.69. When a 1H-NMR spectra is acquired each nuclear spin is identified by its larmor precession frequency (0) which is dependent of the Magnetic field applied. By measuring nuclear spins special positions at two distinct time’s information about their displacement. The first gradient field applied can spatially label the nuclear spins (coding) keeping the duration of gradient (δ) constant. After waiting the diffusion time (Δ) the second opposite gradient pulse is applied, to refocus the nuclear spins give to us some information about the quantity of spins that really are refocusing which means that the molecules that have moved on the diffusion time (Δ) are not in position to refocus their magnetization on the decoding phase. 70
This technique is definitely a great progress as a way to separate different compounds in a mixture based on the differing translation diffusion coefficients of each chemical species in solution. In a certain way, it can be regarded as a special chromatographic method for physical component separation, but unlike those techniques, it does not require any particular sample preparation or chromatographic method optimization and maintains the innate chemical environment of the sample during analysis. (Figure 1.7).
Time
Gra
di
ent M agne tic F
ie
ld
2. RESULTS
2.1. Complex stoichiometry of the Pf1/ Cyt c mass ratio
The results of the assay of complex formation in mixtures of cytochrome-c and Pf1 solutions are presented in Figure 2.1 where the dependency of the residual absorbance (free cytochrome c not involved in the precipitation) on the composition of the mixture is shown. Values of absorbance at 410nm were measured to account for cytochrome c concentration remained in solution after its aggregation with Pf1 virus and centrifugation of the pellet. As we can see, for 0.6mg/ml and 0.25mg/ml Pf1 concentrations, the highest aggregate formation appeared at 0.15mg/ml and 0.3mg/ml cytochrome c concentrations, respectively.
0 0,5 1 1,5 2
0 0,1 0,2 0,3 0,4 0,5
[Cytochrome c]o (mg/ml)
A
bs
@
410nm
Figure 2.1 - Cytochrome c absorbance in the supernatant (after centrifugation of the precipitated complex) determined by UV-Visible spectroscopy at 410nm. Cytochrome c was stepwise added in order to have increasing cytochrome c concentration in the cuvette, with two Pf1 virus concentrations: (■) 0.25mg/ml and (□) 0.6mg/ml.
0
0,2
0,4
0,6
0,8
1
0
0,01
0,02
0,03
0,04
0,05
Q
(m
g/
m
g)
[Cyt c]o
mM
y = 1726,7x + 0,005
R² = 1
0
0,01
0,02
0,03
0,04
0,E+00
5,E-06
1,E-05
2,E-05
2,E-05
[C
yt
]0
m
ax
(
m
M
)
[Pf1] (mM)
Figure 2.2 - a) Amount of complexed cytochrome c per mol of the Pf1 virus against the initial concentration of cytochrome c in solution. Phosphate buffer 2mM, pH 7, Pf1: (▲) 0.15mg/ml, (■) 0.25mg/ml and (♦) 0.6mg/ml. The concentration of cytochrome c corresponding to the highest value of capacity Q on each plot was visually determined, and it was plotted in b) as a function of Pf1 concentration. The result of a linear fit is shown.
The slope value of 1727 indicates that about 1700 cytochrome c molecules were restricted to near the Pf1 surface per one Pf1 particle. This result is on suitable agreement with the isoelectric aggregate, comparing to the charge balance.
2.2. Effect of salt addition on Pf1-Cytochrome c stability
0 0,5 1
0 50 100 150 200 250 300 350
O .D .@ 7 5 0 n m NaCl (mM) 0 0,5 1
0 50 100 150 200 250 300 350
O .D .@ 7 5 0 n m [NH4CH3COO] mM
Figure 2.3 – NaCl and NH4CH3COO effect on Pf1/Cytochrome c complex stability. Concentrated salt solution was added in order to set the final ionic strength. Cyt c/Pf1 mass ratios showed in: (1) Fig. a): () 1/1, () 7/1,
() 15/1, (♦) 30/1 and (2) Fig. b): (○) 2/1, () 9/1, () 44/1 (♦) 87/1.
A series of light-scattering measurements was performed to illustrate the stability of bundle formation as a function of ionic strength. First, concentrated cytochrome c was added into Pf1 solution and then salt was sequentially added into the solution. This enables to find the critical concentrations of salt required to disrupt the complex. The ionic strength-dependent behaviour is shown in Fig. 2.3, for both NaCl a) and Ammonium Acetate b).
0
20
40
60
80
100
0
100
200
300
C
y
t/
P
f1
[Salt]
crit. Conc.(mM)
Experimental data show a sharp decrease in the light scattering signal for a specific NaCl or AmAc concentration (critical concentration) depending on Cytochrome c/Pf1 ratio. This critical concentration was determined by the first derivative of the curves in Figure 2.3 (inflection point). The critical salt concentration that defines the stability of the complex has a dependence with the Cytochrome c/Pf1 ratios, as shown in figure 2.4.
2.3. The size of Pf1/Cytochrome c aggregates
Dynamic light scattering spectroscopy was used to measure the size of the aggregates of Pf1/Cytochrome c. The hydrodynamic diameter values reported in this study are based on the size distribution by scatter intensity. The DLS intensity was measured versus particles diameter for different Pf1/Cytochorme c mass ratios, Figure 2.5. As cytochrome c concentration increases, an aggregate with a hydrodynamic diameter of around 1000 nm become dominant with a decrease of the component with smaller hydrodynamic radius (Pf1 particles).
The Pf1 virus alone polydispersity index were 0.463 ± 0.021 and show one smaller population which can correspond to the broken virus71. The polydispersity index grow up to 1.000 when Pf1/Cytochrome c mass ratio were 3/1; 2/1; 1/1, suggesting nano-structures variation with a high molecular weight increasing. At this ratios huge aggregations were detected behind 5000nm, even “visible” to the eye, suggesting larger assemblies of macromolecules in solution.
0 2 4 6 8
0 400 800 1200 1600
Diameter. nm
In
te
n
si
ty
%
2.4. Zeta potential measurements
Figure 2.6 shows apparent zeta potential increasing as Pf1 virus/Cytochrome c decreases ranging from 9/1 to 1/2. Pf1 and the mixtures were found negative charged between 1/1 and 9/1. As Pf1/Cytochrome c mass ratio decreases from 2/1 to 1/2, zeta potential grows up to approximately the same native zeta potential value of Cytochrome c alone (+6mV). In good aggrement with previously works72. The iso-electric point was exhibited around 0.6 (Pf1/Cyt c). Both protein and virus alone exhibit positive and negative zeta-potential respectively. This should not be surprising, as measurements were taken at pH 7.0, where that aggregation was observed at Pf1/Cytochrome c around 1/1 ratio .This seems to indicate that Pf1 have some of its negative surface charge characteristics changed by the cytochrome c influence.
-60 -50 -40 -30 -20 -10 0 10
0 1 2 3 4 5 6 7 8 9
Pf1/Cyt c
Z
e
ta
P
o
te
n
ti
a
l
(m
v)
Figure. 2.6: Zeta Potential varying Pf1/ Cytochrome c virus mass ratios keeping the virus concentration at 0.1mg/ml, pH was adjusted using Phosphate buffer at 7.0.
2.5. pH influence on Cytochrome c /Pf1 complex
To have an idea of charge behaviour of the particles involved in the aggregation, the pI was estimate assuming all residues to have pKa values that are equivalent to the isolated residues (Figure 2.7). For a folded protein this is not valid. However, this rough value can be useful for planning protein purfications.73.
Figure 2.7: Estimated charge over pH range, were dashed point represent the product between Cyt c and Pf1; the black line the Cyt/Pf1 ratio; Red line represents the overall charge of the Cytochrome c and at blue the Pf1 virus.
Similar UV visible experiment were realized that supporting, were aggregations occur between pH 5.5 and 8.0 as expected, and at higher pH no complexes as been seen.
2.6. Atomic Force Microscopy
Figure 2.8 Atomic force microscopy images of Pf1 and Cytochrome c using the liquid cell with mass ratio 1:2 and 6mM ammonium acetate pH 6.8.
Results shows some regularity geometric forms and the distance value obtained between the two higher pick surfaces were 13.5 nm since cytochrome is about 3.3 nm diameter with is about half of the virus diameter (6.7 nm). So if we have two cytochrome c by sides and two virus (Figure 2.10), it is possible to explain the experimental obtained distance.
13.5 nm
3.35nm 3.3
nm 3.3 nm 3.35nm
Figure 2.9: Surface representation of the samples obtained from figure 2.9, with the possible two cytochrome c molecules between two Pf1 rod virus environments.
2.7. NMR titration of Pf1 / Cytochrome c sample with NaCl.
A NMR sample prepared with 1:1 mass ratio of Cyt c: Pf1 virus at low ionic strength displayed aggregated complex suspension, expected for this experimental conditions. The complex stochiometry implies an 1/3 mass of cytochrome is not bounded to the aggregate.
12 18 24 30 36
50 150 250 350 [NaCl] mM C h e m ic a l S h if t (p p m ) 12 18 24 30 36
50 150 250 350
[NaCl] mM C h e m ic a l s h if t (p p m )
Figure 2.10 (A) - Left - Low field Cytocthome c NMR signals of the of Cytochrome c/Pf1 virus on mass ratio
1:1 (20mg/ml) of the titration with NaCl salt [3.3 to 350]mM. (B) - Right - Same conditions and procedure
without Pf1 virus. Heam - HM8(×), HM3:(), HA71(○); His18 – HB1(■), H4(▲), () and maybe (); H2(-); Met 80 HB1(□) and/or (*),()74.
In the low salt content conditions we see a low intensity NMR spectra, with resonances significantly deviated to the ones observed in the cytochrome c sample without Pf1 virus. The stepwise increases of added salt (NaCl) induce dramatic variations in terms of both chemical shifts, linewidths and spectra intensity. (Figure 2.10 and 2.11). A control salt titration (without Pf1 - figure 2.10 B) show that the variation of NaCl concentration don’t affect the spectra of Cyt c spectra.
The increase in the spectra intensity is due to the dissociation of the aggregates that release of cytochrome from the complex (see figure 2.11).
50
150
250
350
[NaCl]m M
In
te
n
si
ty
(
a
.u
.)
Figure 2.11 - Comparison between the 1H-NMR peaks intensity of Cyt c with Pf1 at ratio 1:1 increasing NaCl concentration. Haem - HM8(■), HM3(), HA71(), HA72(▲); His18 – HB1 (), H4 (*), () and/or (○); Met80 – HB1(□).
Fig. 2.12 Colored identified peak show the chemical shifts deviations between 0,19 to 3,7 ppm on a logarithmic scale. The heme, along with amino acids with assigned peaks are shown in gray.
2.8. DOSY – Titration of Cytochrome c with Pf1 virus at 150 mM
In high salt constant concentration conditions, the stepwise increases of added Pf1 induce a dramatic apparent self diffusion decrease of the cytochrome c with significantly deviated to the one observed in the cytochrome sample without Pf1 virus. With the approach of the Cyt c/Pf1 stoichiometry inversely the apparent hydrodynamic radius calculated increase (see Eq. 1.1). In fact the real radius of cytochrome c do not increase. But the proteins interaction with the Pf1 virus change their free mobility following a tendency to look like the PF1 virus mobility, that is invisible to NMR spectroscopy - due to the high tumbling time. It is important to keep in mind that at this ionic force no aggregation/sedimentation can occur between the proteins and particles.
2,1-4
1.1-2 0.6-1
0,31-0,5
0,19-0.3
>3ppm
10
15
20
25
30
35
40
1
3
5
7
9
11
Cyt c/Pf1
H
r
A
º
0
3E-11
6E-11
9E-11
1,2E-10
1,5E-10
D
(
m
2
/s
)
Figure 2.13 – Self diffusion of Cytochrome c in presence of Pf1 at various ratios. At left YY axis (○) Diffusion coefficient and at right the calculated equivalent (■) Hydrodynamic radius.
2.9. Mass ratio calculation of Cytochrome c and Pf1 virus
2.9.1. Geometric calculations of the ideal mass ratio Cyt c versus Pf1
This section was entirely and brilliantly developed by Dr. Jorge Caldeira that i want to thank. This tool has brought a great help to understand how a geometric aggregation between Pf1 virus and Cytochrome c. One way to estimate the maximum protein that can spatially aggregate to the virus is considering the protein as geometrically forms (rod and sphere, respectively). Also, only one layer is considered occupied around the virus:
Figure 2.14 - top (or bottom) view representation of the maximum protein packing about the virus surround knowing the perimeter for the circle:
By the figure 2.14 is possible calculate the perimeter results by: Pcircle = 2π b, (eq. 2.1)
where b is the sum of the radius of the virus and cytochrome and it is the distance between the center and one of the vertices of the polygon to:
n
nb
P
2
sin
(eq. 2.3)
Where n is the number of sides (number of cytochromes around the virus). The calculation of proteins packed vertically along the virus can be estimated considering the virus as a rod and its section height
h that can have a ring of cytochromes defined as:
hsq= 2* rcyt c for square packing and hhex= 2√ ¾* rcyt c for hexagonal packing (figure below).
Figure 2.15 - Left: Hexagonal and square packing were the rectangle rod represented as the Pf1 virus. Rigth: square and triangular geometric representation resulting of the hexagonal and square packing of Cytochrome c around the Pf1 virus.
As first observation the hexagonal packing is more densely packed than square packing hsq = 2 Rcyt hhex = 2 x 0,8660 Rcyt (eq. 2.4)
Tacking this result it is possible to calculate the mass ratio of maximal load of cytochromes in the virus surface assuming:
(eq. 2.5) This can be calculated for a section of virus of height h
(eq. 2.6)
(eq. 2.7)
(eq. 2.8)
Were n is the number of cytochromes around the virus
Expressing n in terms of rcyt and rPf1
n
nb
P
2
sin
(Perimeter of polygon)
Figure 2.16 – Representation of the cytochrome quantity around Pf1 perimeter. 1 1 1 Pf c cyt R R c Pf Volume c Cyt Volume Pf Mass c Cyt Mass 3 3 4 c Cyt R n c Cyt
Volume
)
866
.
0
2
(
1
122
1 hex Pf Cytc
Pf
h
R
R
R
Pf
Volume
Cyt c
But, the perimeter is also equal to n* 2 rcyt one diameter (2 rcyt ) corresponding to one side of the polygon
Ppolygon = 2nb sin (π/n) = n*2*rcyt (eq. 2.9)
b is the sum of the radius of the virus and cytochrome b = rcyt + rPf1 and n can also be expressed in terms of rcyt and rPf1, solving the equation above:
Ppolygon = 2n(rcyt + rPf1) sin (π/n) = 2nrcyt Ppolygon = (rcyt + rPf1) sin (π/n) = rcyt Ppolygon = sin (π/n) = rcyt /(rcyt + rPf1) arcsin(sin(π/n)) = arcsin (rcyt /(rcyt + rPf1))
(π/n) = arcsin (rcyt /(rcyt + rPf1)) 1/n = arcsin (rcyt /(rcyt + rPf1) ) / π n = π / arcsin (rcyt /(rcyt + rPf1))
Then: (eq. 2.10)
Figure 2.17 - Ideal cytochrome c /Pf1 mass ratio based on virus diameter and protein radius according to the derived equation.
From this theoretical equation it is possible to compare the stoichiometry calculated by UV-visible; DLS or AFM experiments results.
3. DISCUSSION
3.1. Stoichiometry of Pf1 virus cytochrome c complex
A set of UV-Visible experiment was carried out, centrifuging various Pf1/Cyt c mass ratio proportions and then adding NaCl at increasing concentrations, between 0 and 200 mM with total solubilisation. This is in agreement with the fact that Coulombic interactions drive the association between the virus (polyelectrolyte) and a protein of opposite charge. At the stoichiometry, the amount of cytochrome c condensed also depends on the quantity of added salt and is larger for small concentrations of the last one (figure not show). The special conditions that lead the precipitation process at a specific stoichiometry depending on the gain in the entropy due to the liberation of low molecular couterions (such PO42-; Na+; Cl-) from the environments chains of Pf1 and Cyt c around. When other ratios, non stoichiometric, were prepared even with a small complex precipitated, the cytochrome c cannot condense onto the polyelectrolyte until the charged density between neighboring chain charges along with the virus is reduced below a certain critical value.
3.2. Ionic strength
The presence of a small amount of salt enables rearrangement to thermodynamic equilibrium, leading to a uniform distribution of the components among all long chains of the virus. We have studied the reversible transition from a solid aggregate to a free flowing liquid depending on salt concentration. At higher salt concentration the precipitate dissolves and both components exist as free polyelectrolyte and protein in solution. Similar effects can be induced by changes of the pH value. The presence of NaCl led to a dramatic decrease of the level of aggregation for Pf1/Cyt c. The enabled rearrangement processes make the salt a decisive part in the formation of highly aggregated. The level of aggregation can be controlled by the amount of salt during complex formation that can lead us to tunable degrees of alignment by with salts concentrations.
on excess). The differences between the AcAm and NaCl are essentially the size. NaCl is much smaller and can break easily the complex. Larger diameter ions are less able to mediating attractive forces, considering hydrated ion size.
There is a entropy tendency to maintain cytochrome c in the middle of the solution (bulk) and not aggregated. When a huge amount of protein (positive charges) is in the bulk the cytochromes tendency to escape from the complex is lesser.
An interesting model developed by Alexander Lyubartsev et al predicts this phenomenon with suitable agreement to the proportions of the experimentally data obtained. The model is made by three triangular parallel charged rods (representing the Pf1 virus) at a fixed distance, making a structured box with various proportions of countercharge sphere (representing the cytochrome c) and a variation of the ionic force. (infinite length and finite charge density- see pag 20). The effective force between the ordered rods is directly related to the osmotic pressure in the rod system. Since the osmotic pressure of the bundle rises more rapidly as a function of salt concentration than the pressure of an aqueous solution at the same concentration, allowing the osmotic pressure to balance the bundle pressure as salt concentration increases. The exclusion of salt from the bundle is in turn driven by a complex interplay of entropic effects and electrostatic interactions.
However the model does not take into account the molecular details of real polyelectrolyte and protein chains, like e.g. local solvation effects, atomic partial charge distributions and other characteristics related to the organization of complex.
3.3. DLS discussion (force; size;polydisperse)
Experiments were carried at various Pf1/Cytochrome c mass ratios. Population of the Pf1 virus decreased, in favour of the increasing population with average size between 712 and 1200 nm, which suggests the spontaneous formation of Pf1/Cytochrome c aggregates. Since the interaction between the protein and the virus is of electrostatic nature, the effect of ionic strength on the titration curves of Pf1/Cytochrome c (1:1 mass ratio) by NaCl was, then, evaluated. A decrease in the scattering intensity value is induced by the increase of ionic strength leaving to approximate the hydrodynamic radius of the unbounded Pf1 virus, suggesting a reversible system. (similar to UV-visible experiments).
3/1 and higher, Pf1/Cytochrome c mass ratio (polydispersity index > 1) the complex appears on quantity enough to mask the free Pf1 virus, or no more unbounded Pf1 virus are available on solution. (remember that the scattering of one particle is proportional at the hydrodynamic radius^6). On other hand, the source of polydispersity index is also reinforced by the presence of at least two Pf1 virus populations (1um and 2um) on solution. When the stoichiometry is reached a huge molecular weight increases. The generation of new complexes is the dominating process with increasing mixing ratio, not a growth of the Pf1 complex. The sharp rise in light-scattering intensity at the transition of bundle formation suggests that aggregation tends to proceed to form large bundles were all Cyt c on solution as involved. However, because the formation of small bundles precedes that of larger ones, the formation of small bundles as the necessary initial step may pose a kinetic barrier for the formation of large bundles aggregations.
Extension ratio range analyzes leads to many problems; decreasing the Pf1 concentration a not able system is created for the equipment detector, on other way absorption at 633nm laser from Cytochrome c is increase with the concentration.
3.4. Zeta potential discussion
On this system, the positive particle is the protein and the aggregation behaviours depend on the nature of the ionic groups of virus chain and salt. The high charge density, along with the virus rod produces a high electrostatic potential around it, and counterions are located in the immediate vicinity of the virus rod. The amount of protein (considered as a charged polymer) adsorbed at the Pf1 surface also changes the charges surface which are related to a magnitude surface potential. It is expected that as this amount increases, the surface charge will vary until it attains a stable value, indicating that no more protein is being adsorbed. In fact, Zeta-potential is related to the surface charge of proportion of absorbed protein molecule that is exposed to the solvent.