Article
Printed in Brazil - ©2011 Sociedade Brasileira de Química0103 - 5053 $6.00+0.00A
*e-mail: [email protected], [email protected]
Comprehensive Two-Dimensional Gas Chromatography with Time of Flight Mass
Spectrometry Applied to Analysis of Fischer-Tropsch Synthesis Products Obtained
with and without Carbon Dioxide Addition to Feed Gas
Raphael S. F. Silva,*,a Juliana B. Tamanqueira,b Julio César M. Dias,b Fábio M. Passarelli,b
Antonio Marcos F. Bidart,b Francisco R. Aquino Netoa and Débora A. Azevedo*,a
aInstituto de Química, LAGOA-LADETEC, Universidade Federal do Rio de Janeiro,
Cidade Universitária, Ilha do Fundão, 21941-909 Rio de Janeiro-RJ, Brazil
bPetrobras/Cenpes/PDP/TPAP, Cidade Universitária, Ilha do Fundão,
21941-915 Rio de Janeiro-RJ, Brazil
A cromatografia gasosa bidimensional abrangente acoplada à espectrometria de massas por tempo de vôo (CG×CG-EMTDV) foi aplicada para avaliar o efeito do CO2 sobre a distribuição dos n-alcanos, alcanos ramificados, alquenos e compostos oxigenados em produtos da reação de Fischer-Tropsch. Coeluições de material não resolvido observadas em CG convencional foram resolvidas por CG×CG-EMTDV.
Comprehensive two-dimensional gas chromatography coupled to time of flight mass spectrometry (GC × GC-TOFMS) was applied to evaluate the CO2 effect on distribution of n-alkanes, branched alkanes, alkenes and oxygen-containing compounds in Fischer-Tropschproducts. GC × GC-TOFMS was able to resolve the unresolved compounds observed in conventional GC.
Keywords: GC × GC, Fischer-Tropsch products, comprehensive two-dimensional GC
Introduction
Worldwide demand for clean, reliable and environmental friendly energy sources has never been greater. Based on that scenario, Gas to Liquids (GTL) solutions, a group of technologies that can create liquid hydrocarbon fuels from natural gas, has become more and more attractive as a way to commercialize stranded gas reserves. In this context, stranded reserves mean any natural gas field which the infrastructure of transportation to the market is not feasible for technical or economic reasons. Also, GTL could be a possible solution to limit natural gas flaring or venting. An important part of GTL is the Fischer-Tropsch (FT) synthesis, which is a catalytic reaction wherein a mixture of carbon monoxide (CO) and hydrogen (H2) called syngas (from methane reforming process) are converted into hydrocarbons of wide range of molecular weights often called synthetic crude (syncrude). The Fischer Tropsch synthesis is so far one of the best ways to convert natural gas into liquid fuels.1-3
Conversion of syngas through the FT process leads to a distribution of products essentially consisting of n-alkanes
together with smaller percentages of branched alkanes, alcohols, alkenes. The main reactions involved in FT synthesis are shown inFigure 1.
The FT reactions occur under catalytic conditions, Fe and Co are the most used catalysts, although Ru, Ni and other transition metals have also been tested.4 Although
the FT has been known since the early 20th century, its reaction mechanism is not completely elucidated yet. Two main proposals are dominant: the oxygenated mechanism5,6
and the surface carbide mechanism.7,8 Investigations about
the FT mechanism are made even nowadays. Recently published evidences suggest that FT reaction, under iron
catalyst, occurs by the surface carbide mechanism,9 while
the oxygenated mechanism prevails when the reaction occurs under cobalt catalyst.10
The FT heavy products from the low temperature FT process can be upgraded to obtain high quality products such as diesel, jet fuel, petrochemical naphtha, lubricants and food grade waxes. Such cuts are considered sulfur and nitrogen free and the level of aromatic compounds is extremely low (less than 1 ppm). Then, GTL from FT process provides cleaner fuels (less emission and pollution).11-13
Besides the mentioned benefits, GTL technology could also be used as a means to mitigate CO2 emission via carbon capture through CO2 chemical conversion into liquid
fuels.14,15 The CO
2 source can be obtained from the plant
emission (combustion process, side reforming reaction and FT reaction), from external sources like CO2 rich natural gas, different types of anthropogenic processes, and even from the ocean.16
Normally the products formed are dispersed in liquid and solid phases. In addition, many isomers are produced, which makes FT products complex samples. The analysis of FT samples is crucial for process monitoring and ensures that the wanted products are obtained. However, the complexity of the FT samples requires analytical techniques with high separation power and comprehensive two-dimensional gas chromatography (GC × GC) is a good option to analyze them.
GC × GC was earlier described by Lui and Philips,17 the
two-dimensional system consisting in two columns with different stationary phases which are connected in tandem and all compounds that elute from the first column are injected in the second one. In GC × GC the compounds are submitted to two separation mechanisms which distributes the compounds in an orthogonal plane, increasing the information about the samples. Details are available in the literature review articles which explain the theoretical and practical aspects about the technique.18-20
GC × GC can be coupled to several kinds of detectors,21
but the most powerful combination is GC × GC coupled to time of flight mass spectrometry (GC × GC-TOFMS) because of its high acquisition rate (up to 500 spectra s-1).22
In this work, GC × GC-TOFMS was used to the analysis of Fisher-Tropsch-oil products to evaluate the CO2 effect
on product composition.
Experimental
Sample description
The FT products were obtained using Co/Al2O3 catalyst in a fixed bed reactor operating at T = 220 ºC, P = 25 bar and
H2/CO ratio of 1.9. Two Fischer-Tropsch streams, named as
FT1 and FT2, were generated and analyzed in this study; FT1 was obtained from synthetic syngas (CO + H2 mixture
from gas bottles) while to produce FT2, the synthetic syngas was blended with 10% of CO2. The samples were
fractionated in liquid and solid phases employing separators operating under controlled temperature and pressure. The solid fraction is obtained under high pressure and high temperature and liquid fraction is obtained under high pressure and low temperature, both fractions are obtained free of water. The samples were named as follows: FT1 liquid phase (FT1-L), FT2 liquid phase (FT2-L), FT1 solid phase (FT1-S) and FT1 solid phase (FT2-S). Liquid samples were injected directly, while the solid samples were injected as a 100 ng µL-1 solution in dichloromethane.
1D-HTGC analysis
Analyses by high temperature gas chromatography (1D-HTGC) were performed in a AC Agilent 6890N Network GC System(Palo Alto, CA, EUA) employing a PTV inlet (programmed temperature vaporization) and a FID detector (flame ionization detector). The column used was a HT-750 column (Analytical Controls, Houston, TX, EUA), 100% methylsiloxane, 5 m × 0.53 mm i.d. × 0.09 µm df.
Chromatographic conditions for liquid and solid samples, 1 µL was injected in a PTV inlet programmed at
−20 ºC initial temperature ramped at 10 ºC min-1 to 430 ºC
(5 min). The oven temperature program was 80 ºC initial temperature, ramped 15 ºC min-1 to 430 ºC (26 min). Helium
was used as carrier gas at constant flow 22.5 mL min-1.
Detector temperature was set at 430 ºC, air: 350 mL min-1,
hydrogen: 35 mL min-1, helium 4 mL min-1.
GC × GC-TOFMS analysis
Analyses by GC × GC-TOFMS were performed on a Pegasus 4D system (Leco, St. Joseph, MI, USA), composed by an Agilent 6890 GC (Palo Alto, CA, USA) equipped with a secondary oven and a non-moving quad-jet dual-stage modulator and a Pegasus III (Leco, St. Joseph, MI, USA) time-of-flight mass spectrometer. A DB-5 column (Agilent, Palo Alto, CA, USA), 5%-phenyl-95%-methylsiloxane (30 m × 0.25 mm i.d., 0.25 mm df)
was used as the first dimension column (1D). A BPX-50
column (SGE, Ringwood, VIC, Australia), 50%-phenyl-50%-methylsiloxane (1.5 m × 0.1 mm i.d., 0.1µm df) was used as the second dimension column (2D). The 2D
which was connected via SGE mini-unions and SiltiteTM
metal ferrules 0.1-0.25 mm i.d. (Ringwood, VIC, Australia). GC conditions for liquid samples: 300:1 split mode injection of 1 µL at 250 °C. Helium was used as carrier gas at a constant flow rate of 1.0 mL min-1. The primary oven
temperature program was set at 32 ºC for 5 min, ramped at 3 ºC min-1 to 220 ºC. The secondary oven temperature
program was 10 ºC higher than the primary. The modulation period was 3 s with 0.75 s hot pulse duration and the modulator temperature was 30 ºC higher than the primary oven temperature.
GC conditions for solid samples: 50:1 split mode injection of 1 µL at 250 °C. Helium was used as carrier gas at a constant flow rate of 1.0 mL min-1. The primary
oven temperature program was: 70 ºC for 1 min, ramped at 3 ºC min-1 to 300 ºC. The secondary oven temperature
program was 10 ºC higher than the primary. The modulation period was 3 s with 0.75 s hot pulse duration and the modulator temperature was 30 ºC higher than the primary oven temperature.
For all analyses the transfer line to the MS was at 280 ºC, the electron ionization at 70 eV, the mass range of m/z 35-600,
the ion source temperature was 200 ºC, the detector was at
−1700 V and the acquisition rate was 100 spectra s-1. Data processing for GC × GC-TOFMS
GC × GC-TOFMS data acquisition and processing were performed with ChromaTOF software version 4.0 (Leco, St. Joseph, MI, USA). Individual peaks were automatically detected on the basis of a 10:1 signal to noise ratio. Areas of the individual peaks were automatically acquired.
Results and Discussion
Comprehensive two-dimensional gas chromatography coupled to time of flight mass spectrometry (GC × GC-TOFMS) was employed to analyze unresolved material observed in 1D-HTGC and evaluate the CO
2 effect on the
distribution of n-alkanes, branched alkanes, alkenes and
oxygen-containing compounds in the samples.
The selected column set had non-polar versus polar
configuration, where separation in 1D was based on the
volatility while in 2D the separation was based on the polarity
of the compounds. The configuration non-polar versus
polar columns is the most often applied to petrochemical samples.23-25 However, some works have been published
reporting GC × GC analyses for petrochemical samples with polar versus non-polar configuration.26,27
GC × GC has been used for the analysis of FT products with configuration non-polar versus polar,28 as well as polar
versus non-polar configuration with GC × GC-TOFMS29
andGC × GC-FID.30
1D-HTGC analyses detected n-alkanes ranging from
C4 to C15 for the liquid samples (FT1-L and FT2-L) and n-alkanes ranging from C6 to more than C50 for
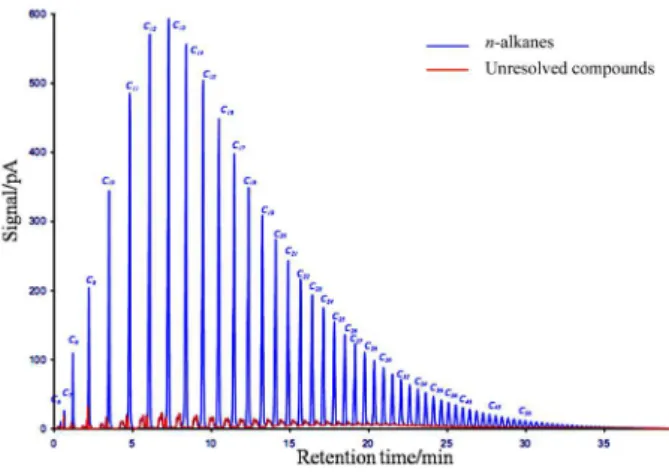
the solid ones (FT1-S and FT2-S). A typical 1D-HTGC
chromatogram of the FT-2S sample is presented in Figure 2, where unresolved compounds can be observed at the range C9 to C30.
The detection of alcohols in FT samples is difficult because these compounds coelute in non-polar columns with branched alkanes, when analyzed by 1D-GC. This problem was solved by GC × GC-TOFMS. Figure 3shows a two-dimensional chromatogram for the FT1-L sample where two chromatographic bands can be seen, the lower band is formed by hydrocarbons and the upper one by n-alcohols which
are more retained by the medium polar column (BPX-50) than hydrocarbons. The n-alcohols were the only
oxygen-containing compounds detected in the samples.
The two-dimensional chromatograms were structured so that the compounds are resolved into groups. Each group
Figure 2. One-dimensional chromatogram for FT2-S sample showing
unresolved material which was resolved by GC × GC-TOFMS.
Figure 3. Two-dimensional chromatogram for FT1-L sample showing
the complete separation of alcohols from hydrocarbons: C5, n-pentane;
is formed by the n-alkanes, branched alkanes and alkenes
with the same number of carbon atoms and the n-alcohol
with less two carbon atoms, Figure 4a-c.The advantages of GC × GC can be observed even if concerning only the 1D,
as GC × GC provides thinner peak widths than conventional GC. In Figure 4b it can be observed that the separation of four branched alkanes had good resolution in 1D.
In 1D chromatography employing non-polar stationary
phases with separation based on boiling point differences, the elution order is: the 1-alkenes elutes before the n-alkanes
followed by the cis-2-alkene and the trans-2-alkenes.30 As
the number of carbon increases, the cis-2-alkenes peak
elutes closer to the n-alkanes peak, and in some cases they
can be covered by the n-alkanes peak.29 This can lead to
inaccurate determinations for n-alkanes and alkenes. This
problem was not observed in GC × GC using polar versus
non-polar configuration because alkanes and alkenes form two chromatographic bands in this case.29,30
Such problem was also not observed in this study either, Figure 4cshows the C21 group where the resolution between the n-alkane and cis-2-alkene peaks can be
seen; this resolution was effective throughout the whole chromatogram. Although alkanes and alkenes have similar retention times in the non-polar 1D, the use of modulation
provides higher resolution in GC × GC-TOFMS, even in 1D.
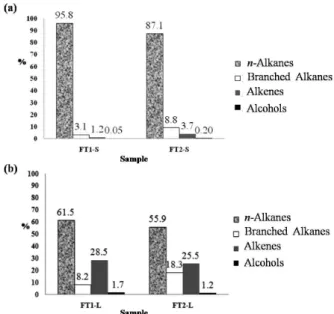
All samples presented n-alkanes as a major class,
Figure 5, whereas for solid samples the n-alkanes content
represents 80-90% of the phase, for liquid samples
n-alkanes it is responsible for 50-60% of the phase.
Unlike the solid samples, the liquid samples showed levels of alkenes higher than branched alkanes. The oxygen-containing compounds represent a minor class in both liquid (< 2%) and solid samples (< 0.5%).
The CO2 effect on FT product composition was also
evaluated. The samples obtained with CO2, FT2-L (55%) and FT2-S (87%) presented lower levels of n-alkanes than
the FT1-L (61%) and FT1-S (95%) samples. The process of branching of carbon chains was favored by the CO2, because the levels of branched alkanes were higher in samples FT2-L and FT2-S than in the samples obtained without CO2.
For both cases (FT synthesis with and without CO2), the total amount of alkenes in the liquid phase, 28% (FT1-L) and 25% (FT2-L), was higher than in the solid phase, 1% (FT1-S) and 3% (FT2-S). Concerning the total amount of alcohols, were just observed few variations in both cases.
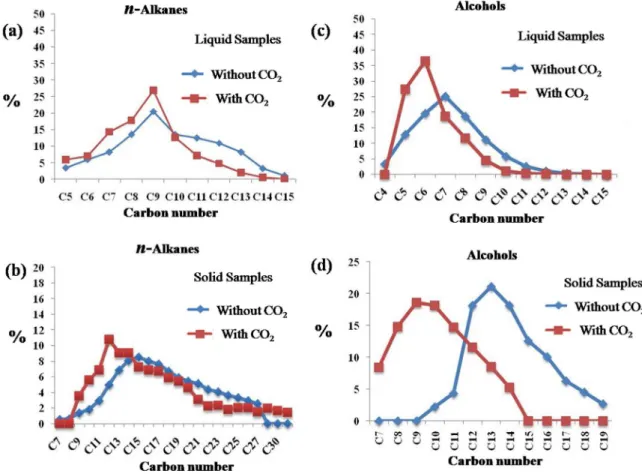
An observed effect of CO2 in the FT product selectivity, for all classes, was that CO2 favored the formation
of compounds with lower molecular weights. In the sample FT2-L n-alkanes C5-C9 represented 70% of all n-alkanes detected, while this range represented 50% of n-alkanes detected in FT1-L, Figure 6a. In the sample
FT2-S n-alkanes C9-C14 represented 44% of the overall
composition of these compounds, while for FT1-S this range represented 27%, Figure 6b.
The effect of favoring the formation of compounds with lower molecular weights was also observed for branched alkanes and alkenes, but was more evident in the distribution of n-alcohols. In the liquid samples, the n-alcohols detected ranged from C4 to C12, but n-pentanol
and n-hexanol represented 60% of all n-alcohols detected
in the sample FT2-L, while in the sample FT1-L these compounds represented 32% of alcohols detected. The range of n-alcohols detected for solid samples ranged
from C10 to C19 and n-tridecanol was the major compound
for FT1-S while for FT2-S the range was from C7 to C15
Figure 4. (a)Overview of the two-dimensional chromatogram for FT1-S sample: C10, n-decane; C20, n-eicosane; C30, n-triacontane. (b)
Expansion of Cn groupshowing thestructuring of the compounds on
the chromatographic plane, in this case n = 13. (c)Expansion of the C21
group showing the resolution between cis-alkene isomer and n-alkane.
and n-nonanol was the major compound, which was not
detected in FT1-L sample, Figure 6c-d.
Conclusions
GC × GC-TOFMS was able to resolve unresolved material as observed in the analysis of Fischer-Tropsch products by conventional GC. Higher levels of resolution for n-alkanes, branched alkanes, alkenes and n-alcohols
analysis was provided by this technique.
The effect of 10% of CO2 on the FT product selectivity
was pronounced. The main class of products (n-alkanes,
branched alkanes, alkenes and n-alcohols) shifted
their carbon distribution to lower molecular weight compounds.
Although the products obtained in the presence of CO2 have a lower average molecular weight when compared with FT synthesis without CO2, the n-alkanes are the major
compounds in both products and the total amount of olefins and alcohols did not change significantly. Then, small additions of CO2 on the Fischer-Tropsch process can be
an environmentally attractive option, because it generates cleaner fuels with the CO2 reuse.
Acknowledgments
The authors thank CNPq (Brazilian Research Council) for fellowships. The study was supported by Cenpes/ Petrobras, FAPERJ and FUJB.
References
1. Steynberg, A. P.; Dry, M. E.; Fischer-Tropsch Technology, Elsevier: Amsterdam, 2004.
2. A Global Force. Tech Focus. Popular Mechanics, Sasol Ltd., 2007. http://www.sasol.com/sasol_internet/downloads/ SASOL_global_force_March07_1172224987155.pdf accessed in August 2011.
3. Ramos, A. L. D.; Marques, J. J.; Santos, V.; Freitas, L. S.; Santos, R. G. V. M.; Souza, M. M. V. M.; Quim. Nova, in press. http://quimicanova.sbq.org.br/qn/No% 20Prelo/RV/RV10822. pdf accessed in August 2011.
4. Vannice, M. A; J. Catal.1975, 37, 449.
5. Podgurski, H. H.; Kummer, J. T.; DeWitt, T. W.; Emmett, P. H.; J. Am. Chem. Soc.1950, 72, 5382.
6. Storch, H. H.; Golumbic, N.; Anderson, R. B.; The Fischer-Tropsch and Related Synthesis, John Wiley & Sons: New York, 1951.
7. Ritschel, M.; Vielstich, W.; Chem. Ing. Tech.1980,52, 327. 8. Chuang, S. C.; Tian, Y.; Goodwin Jr., J. G.; Wender, I.; J. Catal.
1985,96, 396.
9. James, O. O.; Mesubi, A. M.; Ako, T. C.; Maity, S.; Fuel Process. Technol.2010, 91, 136.
10. Davis, B. H.; Catal. Today2009, 141, 25.
11. Bao, B.; El-Halwagi, M. M.; Elbashir, N. O.; Fuel Process. Technol.2010,91, 703.
12. Kim, Y. H.; Jun, K. W.; Joo, H.; Han, C.; Song, I. K.; Chem. Eng. J.2009, 155, 427.
13. Yagi, F.; Kanai, R.; Wakamatsu, S.; Kajiyama, R.; Suehiro, Y.; Catal. Today2005,104, 2.
14. Ha, K. S.; Bae, J. W.; Woo, K. J.; Jun, K. W.; Environ. Sci. Technol.2010, 44, 1412.
15. Yao, Y.; Hildebrandt, D.; Glasser, D.; Liu, X.; Ind. Eng. Chem. Res.2010, 49, 11061.
16. Dorner, R. W.; Hardy, D. R.; Williams, F. W.; Davis, B. H.; Willauer, H. D.; Energy Fuels2009, 23, 4190.
17. Lui, Z.; Phillips, J. B.; J. Chromatogr. Sci.1991, 29, 227. 18. von Mühlen, C.; Zini, C. A.; Caramão, E. B.; Marriott, P. J.;
Quim. Nova2006, 29, 765.
19. Pedroso, M. P.; de Godoy, L. A. F.; Fidélis, C. H. V.; Ferreira, E. C.; Poppi, R. J.; Augusto, F.; Quim. Nova2009, 32, 421. 20. Welke, J. E.; Zini, C. A.; J. Braz. Chem. Soc. 2011, 22, 609.
21. von Mühlen, C.; Khummueng, W.; Zini, C. A.; Caramão, E. B.; Marriott, P. J.; J. Sep. Sci. 2006, 29, 1909.
22. Adahchour, M.; Beens, J.; Brinkman,U. A. T.; J. Chromatogr., A2008, 1186, 67.
23. Ávila, B. M. F; Aguiar, A; Gomes, A. O.; Azevedo, D. A.; Org. Geochem.2010, 41, 863.
24. Aguiar, A.; Silva Jr., A. I.; Azevedo, D. A.; Aquino Neto, F. R.; Fuel2010, 89, 2760.
25. Silva, R. S. F.; Aguiar, H. G. M.; Rangel, M. D.; Azevedo, D. A.; Aquino Neto, F. R.; Fuel2011, 90, 2694.
26. Tran, T. C.; Logan, G. A.; Grosjean, E.; Harynuk, J.; Ryan, D.; Marriott. P. J.; Org. Geochem.2006, 37, 1190.
27. Tran, T. C.; Logan, G. A.; Grosjean, E.; Ryan, D.; Marriott, P. J.; Geochim. Cosmochim. Acta 2010, 74, 6468.
28. Vendeuvre, C.; Bertoncini, F.; Duval, L.; Duplan, J. L.; Thiébaut, D.; Hennion, M. C.; J. Chromatogr., A2004, 1056, 155. 29. Grobler, T.; Claeys, M.; van Steen, E.; van Vuuren, M. J. J.;
Catal. Commun.2009, 10, 1674.
30. Westhuizen, R.; Crous, R.; Villiers, A.; Sandra, P.; J. Chromatogr., A2011,1217 8334.
Submitted: May 1, 2011