0103 - 5053 $6.00+0.00
Article
* e-mail: [email protected]
# Present Address: Centro de Energia Nuclear na Agricultura,
Univesidade de São Paulo, Av. Centenário, 303; CP 96, 1400-970; Piracicaba – SP (Brazil)
An Enzymatic Flow-Injection Procedure with Chemiluminescence Detection for
On-Site Determination of
L
-Alanine in Synthesis Process
Eduardo P. Borgesa,# and Boaventura F. Reis*,b
a
Departamento de Química, Universidade Federal de São Carlos, São Carlos - SP, Brazil b
Centro de Energia Nuclear na Agricultura, Univesidade de São Paulo, CP 96, 1400-970 Piracicaba - SP, Brazil
Neste trabalho é descrito um procedimento automático em fluxo, para a determinação de
L-alanina em meio de síntese. O método é baseado na oxidação do aminoácido pela L-aminoacido
oxidise, seguida da detecção do H2O2 formado, pela reação de quimiluminescência com o luminol.
Para condicionamento da amostra, como diluição e ajuste do pH, foi utilizada a estratégia da
reamostragem. Pelo procedimento foi possível a determinação de L-alanina na faixa de 0,5 a 25,0
mmol L-1, com um limite de detecção de 0,08 mmol L-1 e um coeficiente de variação menor que 4%
(n = 10). Outras características vantajosas foram uma freqüência analítica de 44 determinações por hora e um baixo consumo de reagente: 0,2 mg de luminol e 16,4 mg de hexacinoferrato(III) por determinação.
In this work an automatic flow procedure for L-alanine determination in the synthesis medium
without a prior sample treatment is described. The method was based on oxidation of L-alanine by
L-amino acid oxidize followed by the reaction of the H2O2 with luminol and chemiluminescence
detection. In order to overcome the severe alkaline condition of the synthesis medium, a zone sampling strategy was employed for automatic sample dilution and pH adjustment. The procedure allows L-alanine determination in the range of 0.5 to 25.0 mmol L-1, a limit of detection of 0.08 mmol
L-1 and a variation coefficient lower than 4% (n = 10). Other advantageous feature such as a sampling
throughput of 44 determination per hour and low reagent consumption, 0.2 mg luminol and 16.4 mg hexacinoferrate(III) per determination, respectively, were also achieved.
Keywords: flow analysis, automation, chemiluminescence, amino acid, L-alanine
Introduction
In biochemistry studies involving biological samples attention has been directed to amino acid determination, since these information can help the diagnostic of the disorders related to metabolism1 and degenerative diseases.2
In industrially processed foods amino acid contents is related to nutritional value as well as sensorial characteristic.3 Moreover, the determination of L/D-amino
acid ratio can be a effective way to monitor food adulteration or bacteriological contamination.4
For amino acid determination, ion exchange chromatography and more recently reverse phase high performance liquid chromatography have been extensile
used for amino acid separation and determination5 and
since amino acids only absorb electromagnetic radiation between 220 and 254 nm, in order to improve detection, a derivation step has been implemented, either pre-column or post-column, for determination of low concentration by spectrophotometry or spectrofluorimetry methods.6 An
widely used derivatisation method is based on the reaction with ninhydrine producing a blue color compound.7 This
method provided high sensitivity, nevertheless it undergoes strong interference caused by ammonia and primaries amines resulting in high blank values.5
As an alternative, attention has been focused to analytical procedures employing enzymatic reaction owing to the high selectivity afforded by the enzymes can be used to improve the robustness of the analytical procedure, presenting also high stability and long life-time.8 In this
amperometry, potentiometry, spectrophotometry, fluorimetry and chemiluminescence.9 When implemented
employing flow analysis process,10 the enzymatic
procedures has presented high sampling throughput without sacrificing the sensitivity. Moreover, a column packed with immobilized enzymes can be coupled into the flow system and it can be utilized several times, thus reducing the cost per analysis.
Concerning the amino acid determination, there are no oxidase type enzymes specific for each one of the amino acids. The L-amino acid oxidase (L-AAOX) or D-amino
acid oxidase (D-AAOX)4 has been used for the
determination of the ratio D/L-amino acid4 and for total
amino acid determination.11 This oxidase is a flavoproteins
which catalyze the amino acid oxidation12 generating NH
4+
and H2O2, thus permitting the indirect determination of the amino acid concentration by monitoring NH4+ or H
2O2
concentration.11,13
In this work we intend to develop a flow procedure for
L-alanine determination during its synthesis employing L-amino acid oxidize immobilized on aminopropil glass
beads packed into a mini-column coupled to the flow network. The H2O2 produced by the enzymatic reaction with amino acid will be monitored by chemiluminescence using the reaction of luminol catalyzed by hexacianoferrate(III).
Experimental
Apparatus
The equipment set up comprised a IPC-8 Ismatect peristaltic pump equipped with tygon pumping tubes, a homemade computer-controlled sliding-bar injector,14 a
71608 silicon photodiode (Oriel Instruments), a homemade laminar flow cell (78 µL inner volume) machined in acrylic as described elsewhere,15 two columns (15 mm long and 5
mm i.d.) machined in acrylic, one to pack the ion exchange resin (AG1-X8) and the other for the glass beads. Coiled reactor and flow lines were made of polyethylene 0.8 mm i.d. A Pentiun III computer equipped with a PCL-711S (Advantech Corp) and running a software developed VisiDaq 3.1 (Advantech Corp) to perform data acquisition and control the injector device.
Solutions
All reagents were of analytical grade. Purified water (conductivity < 0.1 μΩcm-1) was used throughout. A 0.2
mol L-1 carbonate buffer solution was prepared by
dissolving 13.8 g of K2CO3 in water (500 mL) and adjusting
pH to 10.5 using a 0.1 mol L-1 HCl solution. Phosphate
buffer solutions with concentration within the range of 0.01 - 0.3 mol L-1 and pH between 7.0 - 8.0 were prepared
by dilution with water using a 1.0 mol L-1 KH
2PO4 solution
and a 1.0 mol L-1 NaOH solution to adjust the pH.
Borate buffer solutions 0.1 mol L-1 H
3BO3 pH 8.5 and
9.0 were prepared by dissolving the salt in water and adjusting the pH with a 0.1 mol L-1 NaOH solution.
The 1.0 mmol L-1 luminol solution was prepared by
dissolving 0.035 g of 5-amino-2,3-dihydro-1,4-phthalazinedione in 200 ml of the 0.2 mol L-1 carbonate
buffer.
The 50.0 mmol L-1 K
3[Fe(CN)6] solution was prepared
by dissolving the 3,295 g of the solid in 200 mL of water. Solutions containing 10.0, 1.0 and 0.1 mmol L-1
bromopropionic acid were prepared by appropriated dilution with water at part from a 0.1 mol L-1 solution
prepared by dissolving 1.53 g of solid in water and completing the volume to 100 mL.
A 1.0 mol L-1 L-alanine solution was prepared by
dissolving 8.9 g L-alanine (Merck) in 100 mL of water.
Reference solutions were prepared by proper dilution in water or in a 0.15 mol L-1 NaOH medium. These solution
were kept in a refrigerator when not in use.
A 2.5% (v/v) glutaraldehyde was prepared by appropriated dilution from a 50% (v/v) glutaraldehyde (Merck) using the 0.1 mol L-1 phosphate buffer solution
(pH 7.0).
L-amino acid oxidase immobilization
The L-amino acid oxidase (Sigma A-9253, EC 1.4.3.2)
was selected to develop the analytical procedures. Because this enzyme was a crude dried venom from crotalus adamanteu, special care was taken to avoid contact with
biologic material, thus gloves and mask were used while it was manipulated.
The enzyme immobilization was carried out following a procedure described by Puchades et al.13 In the first step,
stream was bubbled through the beads suspensionfor 30 min. Afterwards, the vessel was closed and maintained into refrigerator for 2 hours and 30 min to complete the enzyme immobilization. Finally, the beads were washed with phosphate buffer solution (pH 7) and packed into a column presenting as dimension 15 mm long and 5 mm inner diameter. When this column was not in use, it was kept in refrigerator at 4 oC.
The flow system and operational variables
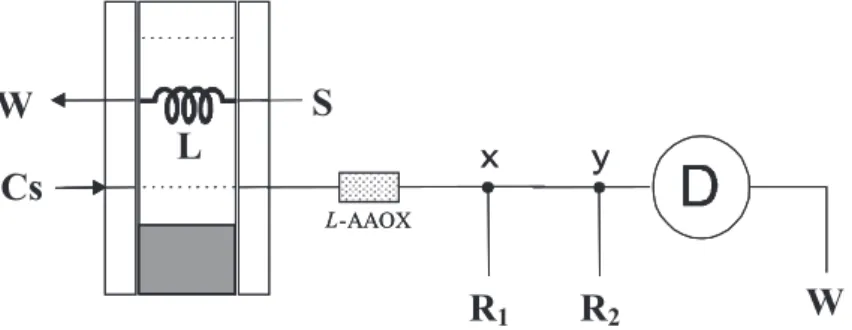
The initial assays to verify the response of the enzyme immobilized on aminopropyl glass beads and to define the reagent concentrations were carried out employing the flow system depicted in Figure1. In this configuration the injector (I) is in the sampling position and sample solution (S) flows trough the sampling loop (L) coupled to sliding bar of the injector. When the injector sliding bar was displaced to injection position (shadow surface) the sampling loop was aligned with the pathway of the carrier solution stream (Cs). Under this condition, the sample aliquot was displaced by the carrier solution through the enzymatic column (L-AAOX)
and the detector (D) towards the waste (W). While sample zone flowed through the column enzymatic reaction occurred generating hydrogen peroxide. Luminol and potassium hexacyanoferrate(III) solutions (R1, R2) were added to the sample zone in the confluences x and y, respectively. The radiation emission occurred into flow cell and it was detected by the photodiode generating a difference of potential (mV) directly proportional to the radiation intensity falling on the photodiode active surface. The generated signal was read by the microcomputer through the analog input of the PCL-711S interface card that was coupled to the detector output using a shielded cable. The measurements were saved as an ASCII file to allow further treatment. While measurement step was in course a plot of the signal was displayed on the microcomputer screen as time function to permit its visualization in real time. After measurement step other analytical run was started by displacing the sliding bar of the injector to the sampling
position. These experiments were performed using L-alanine
reference solution with concentrations raging from 0.5 to 50.0 mmol L-1.
Because L-alanine concentration in the synthesis
medium was high and the strong alkaline medium due to high NH3 concentration, a diluting step based on the sampling zone strategy was implemented16 employing the
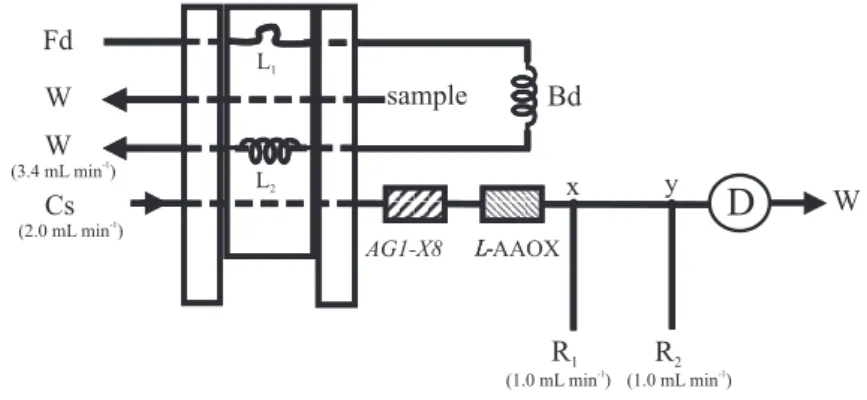
flow system showed in Figure 2. In this configuration a sample aliquot before loaded into the first sampling (L1) is displaced by a primary dilution carrier solution (Fd) through both dispersion coil (Bd) and second sampling loop (L2). Since sample zone undergoes dispersion while it is directed towards the waste (W), sample zone concentration presents a temporal variation while crossing the second sampling loop (L2). In this sense, displacing the sliding bar of the injector to the other resting position, an portion of the dispersed sample aliquot is inserted into the analytical path. Under this condition, varying the time interval to displace the sliding bar, solution aliquots presenting different concentration could be selected. This strategy was implemented in this work varying the time interval within the range of 10 to 35 s in order to match analyte concentration to the operational range of the enzyme immobilized into the column (L-AAOX). To allow
the pH adjustment a phosphate buffer solution (pH = 8) was used as dilution carrier stream (Fd).
The column packed with immobilized enzyme was the same used in the experiment described before. The column assigned as AG1-X8 was coupled in tandem with the
enzymatic column to prevent potential interfering chemical species originated from the reagents used to produce the L
-alanine.In the configuration showed in Figure 2 the sliding bar of the injector is in the diluting position and the sampling loop (L1) that was before filled with sample solution is aligned with the diluting solution stream (Fd). Under this condition, the Fd solution flows through sampling loop (L1), dispersing coil (Bd) and the second sampling loop (L2) towards the waste (W). Since the solutions were miscible L
-alanine dispersion in the primary carrier solution (Fd) occurred while sample aliquot was displace through the
Figure 1. Flow set up used in initial experiments. Cs = carrier stream; R1 and R2 = luminol and hexacianeferrate streams; S = sample aspiration
coil Bd. Under this condition, the sample zone undergone dilution and its pH was changed to the value of the Fd solution. The dispersion caused an enlargement of the sample zone into the coil Bd, thus presenting as a consequence variation of the analyte concentration into the sample bulk. In this sense, analyte concentration into the second sampling loop (L2) varied with the elapsed time, thus varying the time interval to displace sliding bar to the injection position, different analyte concentration could be selected. This feature was exploited to select the appropriated sample dilution and adjusting also pH at the same time. When the sliding bar of the injector was displaced to the injection position, the carrier solution flowed through the loop (L2) displacing diluted sample solution through
AG1-X8 column resin, where the potential interfering anions
were retained. The reaction steps and data acquisition were carried out as in the system of Figure 1.
Results and Discussion
The procedure was implemented employing a column packed with L-amino acid oxidase immobilized on glass
beads where hydrogen peroxide was generated as function of the L-alanine concentration followed by the
chemiluminescence detection. Since the hydrogen peroxide was the basic parameter related to the L-alanine
concentration, parallel experiments were conducted in order to investigate the chemiluminescent reaction. However, by varying the luminol and hexacianoferrate(III) concentrations in the range between 1.0 – 10 mmol L-1
and 10 – 100 mmol L-1, respectively, no differences on the
calculated limit of detection of H2O2 was observed. In this way, considering that luminol is a expensive reagent, the chemiluminescent reagents concentrations was selected as 1 mmol L-1 luminol, and since better baseline was
observed with 50 mmol L-1 K
3[Fe(CN)6], this solution
concentration was selected as well. It interesting to report
that since there was no blank signal, the standard deviation of 20 measurements of the baseline values (that is the baseline noise) was used to calculate the limit of detection.
Enzymatic reaction
The enzyme column was coupled into the flow system showed in Figure 1. The experimental parameters that could affect the enzymatic reaction, such as, flow rate, sample volume, pH and buffer concentration of the carrier stream was investigated.
In this way, the carrier stream flow rate plays a very important role in the enzymatic reaction, since the time available for the reaction between the enzyme and the substrate is related to it. To verify this effect, a set of both flow rates of luminol and hexacianoferrate(III) solutions at 1.0 mL min-1. The curves of Figure 3 show that lower
flow rate resulted in signals with higher magnitude. Similar results for both amino acid concentrations (5.0 and 50.0 mmol L-1), therefore this effect can be exclusively related
to the flow rate. This effect could be expected, nevertheless
Figure 3. Influence of flow rate.Curve I and II express the results
obtained for 50.0 and 5.0 mmol L-1L-alanine solution. Number in
parentheses indicates the cleaning time.
Figure 2. Flow set up for enzymatic L-alanine determination. Cs = carrier stream; Fd = dilution stream; R1 and R2 = luminol and hexacianeferrate
it occurred within a narrow range (0.4 – 1.0 mL min-1) of
the flow rate, thus indicating a limiting condition to be considered if high sensitivity was a parameter to be attained.
The results commented above were obtained using a sampling loop with a inner volume of 250 μL that was settled to minimize dispersion, since variation of this parameter could impair the interpretation of the results. Nevertheless, a sampling loop higher than the minimum value required to attain maximum signal affects unfavorably both reagent consumption and sampling throughput. Results obtained by varying the sample loop volume (not showed here) reveled that the analytical signal raise as the sample volume raise, however no significant improvement in signal was recorded for sampling higher than 100 μL, therefore this value was selected considering as compromise between three important parameters, which are reagent consumption, sensitivity and sampling through put.
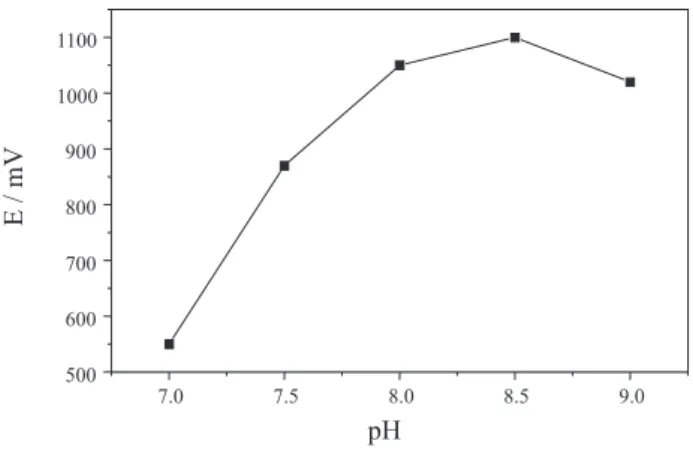
Because pH affects enzymatic reaction, experiments were performed varying the pH of the phosphate buffer solution used as carrier stream within the range of 7.0 to 9.0. To assure the optimum pH for the chemiluminescent reaction development, the concentration of the carbonate buffer solution used to prepare luminol solution (R1) was raised to 0.5 mol L-1 maintaining the pH at 10.5. This assay
was performed using a 20 mmol L-1 L-alanine standard
solution and results are shown in Figure 4. As can be observed, the pH of the medium exert a remarkable effect on the enzyme activity, presenting better response at pH 8.5. In this case, it was considered as measurement parameter the maximum value of the signal in mV.
However, assays to verify the life-time of the enzymatic column showed that only ca. 400
determination could be performed when the carrier solution pH was set to 8.5. Nevertheless, using a carrier solution with pH at 8.00 about 1000 determinations were
carried out without significant variation on the signal detected. From the curve of Figure 4 one can deduce that decrease in signal was less than 5%, therefore carrier solution with pH adjusted to 8.0 could be used to increase the left-time of the enzymatic column without sacrificing the sensitivity of the measurements.
Considering that ionic strength could also affect enzyme activity, some experiments were carried out in order to evaluate this effect and results obtained are summarized in Table 1. Analyzing these results one can be observed that a decrease in radiation emission by increasing concentrations of KBr. These showed that variation of ionic strength can impair accuracy of result. Nevertheless, the decrease was more accentuated for more diluted phosphate solution used in the carrier stream. To avoid this effect, the ionic strength into the sample bulk could be equalized by mixing with the more concentrated carrier solution (0.1 mol L-1 phosphate buffer) prior to flows trough the
enzymatic column. This condition could be easily achieved using a mixing coil (Figure 1) with appropriated dimension.
Assays involving potential interfering
Ammonium carbonate and bromopropionic acid are the raw material used in the synthesis of the L-alanine
amino acid, therefore remaining residues of these substance could cause interference on the enzyme activity. Therefore, a set of experiments were carried out to verify the interfering effects that could be caused by these substances. In these experiments a 0.01 mol L-1 phosphate buffer solution was
used as carrier stream. The pH of both carrier and standard solutions was adjusted to 8.0, therefore the variation in signal observed be attributed to the interfering substances. Concerning ammonium carbonate, increasing it concentration in the standards solution, decrease the analytical signal. However, its interference could be attributed to the variation of the ionic strength, since increasing the buffer carrier solution concentration
Table 1. Effect of ionic strength on the enzymatic activity for 20
nmol L-1L-alanine
Phosphate buffer KBr (mol L-1) Signal (mV)
solution (mol L-1)
0.01 0.0 860
0.01 0.001 820
0.01 0.01 750
0.01 0.1 520
0.1 0.0 450
0.1 0.001 450
0.1 0.01 440
0.1 0.1 420
Figure 4. Influence of carrier stream pH. Results obtained with
decreased the interference. Furthermore, experiments performed processing similar standard solutions using NH4H2PO4 instead of (NH4)2CO3 yielded identical results. On the hand, the bromopropionic acid showed to cause a severe interference. A remarkable decrease in the analytical signal was observed in the presence of this substance. Decreases in sensitivity between 20% to 80% was observed when the standards were in the presence of 0.1 to 10 mmol L-1 of bromopropionic acid, respectively.
Parallel experiments without the enzymatic column and using H2O2 standards reveled that the interference in not related to the chemilumescence reaction. Moreover by varying the ionic strength, it did not seemed to change the interference, reveling that it can be only related to the enzymatic reaction.
In order to circumvent the interference caused by this substance, it was employed an anion exchange resin to retain the bromopropionic acid. In this way, a column packed with the resin AG1-X8 was coupled to the flow system prior to the enzymatic column, as shown in Figure 2, and exploiting this strategy no differences in sensitivity was observed when an analytical curve was constructed employing L-alanine standards with and without
bromopropionic acid.
Sample conditioning
The L-alanine synthesis medium comprised a high
ammonium concentration initially 25% (v/v), bromoproprionic acid and ammonium carbonate. Under this condition, prior to insert the sample aliquot into enzymatic column, a conditioning step was implemented to achieve appropriated dilution and pH adjustment. This
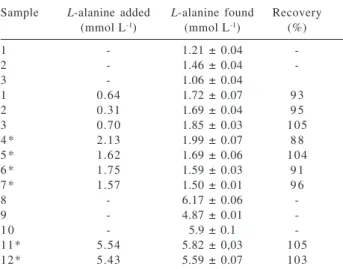
Table 2. Results of recovery assays
Sample L-alanine added L-alanine found Recovery
(mmol L-1) (mmol L-1) (%)
1 - 1.21 ± 0.04
-2 - 1.46 ± 0.04
-3 - 1.06 ± 0.04
1 0.64 1.72 ± 0.07 9 3
2 0.31 1.69 ± 0.04 9 5
3 0.70 1.85 ± 0.03 105
4 * 2.13 1.99 ± 0.07 8 8
5 * 1.62 1.69 ± 0.06 104
6 * 1.75 1.59 ± 0.03 9 1
7 * 1.57 1.50 ± 0.01 9 6
8 - 6.17 ± 0.06
-9 - 4.87 ± 0.01
-1 0 - 5.9 ± 0.1
-11* 5.54 5.82 ± 0,03 105
12* 5.43 5.59 ± 0.07 103
Results are average of three consecutive measurements; *Synthetic samples.
was done employing the sampling zone strategy16
implemented with the flow system depicted in Figure 2 and results obtained are showed in Figure 5. By comparing the two sets of records we can observe that waiting a time interval of 30 s to commute the injector, the record of the signal was similar to that obtained processing a 5.0 mmol L-1 L-alanine standard solution showed in the first set of
records, therefore a 100 times dilution factor was achieved. Under this condition, the pH was easily adjusted to 8.0 and concentrations of interfering species were also lowered, thus increasing the life-time of the anion exchange resin packed into the column.
Sample analysis
Aiming to demonstrate the useful of the proposed system, a set of L-alanine amino acid samples supplied by
the researchers of the synthesis laboratory was processed without any prior treatment. The results obtained are shown in Table 2 and as we can see recovery within the range of 88 to 105% was achieved. The recoveries comprising real samples and the synthetic ones were similar, therefore indicating absence of matrix effect. These results confirm that the concomitant anions, which could cause strong interference were completely retained into the anion exchange resin column.
The figures of merit of the propose system were a linear response in the range of 0.5 to 25 mmol L-1L-alanine (R =
0.9998), a limit of detection of 0.08 mmol L-1L-alanine, a
coefficient of variation lower than 4% (n = 10), reagent consumption 0.2 mg luminol and 16.4 mg hexacinoferrate(III) per determination, and a sampling throughput of 44 determination per hour.
Figure 5. Typical records. Record I – signals obtained by
process-ing L-alanine standards solutions (numbers reflect the
concentra-tions expressed in mmol L-1) in flow system described in Figure 1.
Record II – signals obtained with system described in Figure 2 after exploiting the zone sampling strategy to a 500 mmol L-1L-alanine
References
1. Honaoka, S; Lin, J. M.; Yamada, M.; Anal. Chim. Acta2000,
40, 65.
2. Li, B.; Zhang, Z.; Sens. Actuators, B2000, 69, 70.
3. Olschewski, H.; Erlenkötter, A.; Zaborosch, C.; Chemnitius, C. G.; Enzyme Microb. Technol. 2000, 26, 537.
4. Varadi, M.; Adanyi, N.; Szabo, E. E.; Trummer, N.; Biosens. Bioelectron.1999, 14, 335.
5. Silvestre, M.P.C.; Food Chem.1997, 60, 263.
6. Fan, X. J.; You, J. M.; Kang, J. W.; Ou, Q. Y.; Zhu, Q. C.; Anal. Chim. Acta1998, 367, 81.
7. Fountoulakis, M.; Lahm, H. W.; J. Chromatogr., A1998, 826, 109.
8. Fernandes, E. N.; Moura, M. N. C.; Lima, J. L. F. C.; Reis, B. F.; Microchem. J.2004,77, 107.
9. Lee, Y.; Huh, M. H.; J.Food Biochem. 1999, 23, 173.
10. Janasek, D.; Spohn, U.; Sens. Actuators, B 1997, 39, 291.
11. Johansson, G.; Edstrom, K.; Ogren, L.; Anal. Chim. Acta 1976,
85, 55.
12. Wellner, D.; Meister, A.; J. Biol. Chem.1961,236, 2357.
13. Puchades, R.; Lemieux, L.; Simard, R. E.; J. Food Sci.1990,
55, 1552.
14. Martelli, P. B.; Reis, B. F.; Korn, M.; Rufini, I. A.; J. Braz. Chem. Soc.1997, 8, 479.
15. Borges, E. P.; Fernandes, E. N.; Rocha, F. R. P.; Reis, B. F.;
Quim. Nova2002, 25, 1191.
16. Reis, B. F.; Jacinto, A. O.; Mortatti, J.; Zagatto, E. A. G.; Bergamin Fo., H.; Pessenda, L. C. R.; Anal. Chim. Acta 1981, 123, 221.
Received: May 3, 2005
Published on the web: September 22, 2005