Article
Printed in Brazil - ©2013 Sociedade Brasileira de Química0103 - 5053 $6.00+0.00
A
*e-mail: [email protected]
Determination of Nickel in Alcoholic Beverages by FAAS after
online Preconcentration using Mandarin Peel (
Citrus reticulata
) as Biosorbent
Gabriela C. Ribeiro,a Luciana M. Coelhob and Nívia M. Melo Coelho*,a
aInstituto de Química, Universidade Federal de Uberlândia,
Av. João Naves de Ávila, 2121, 38400-902 Uberlândia-MG, Brazil
bDepartamento de Química, Universidade Federal de Goiás,
Av. Doutor Lamartine Pinto de Avelar, 1120, Setor Universitário, 5704-020 Catalão-GO, Brazil
Um método de extração por fase sólida foi desenvolvido para determinação direta de níquel em bebidas alcóolicas. Este método baseia-se na adsorção de níquel em cascas de Citrus reticulata, conhecida como mexerica. O pH de solução, quantidade de adsorvente, vazão da amostra e do eluente, concentração do eluente e efeito de matriz foram investigados usando estratégias de otimização multivariada. Estudos de dessorção foram feitos com HCl 1 mol L-1. As condições
ideais de extração foram obtidas usando amostra em pH 6,0, vazão da amostra de 4,3 mL min−1,
massa de adsorvente de 50 mg e HCl 1,0 mol L-1 na vazão de 2,0 mL min-1 usado como eluente.
Fator de pré-concentração, precisão, limite de detecção (LOD), limite de quantificação (LOQ), índice de consumo e frequência analítica foram estimados como 12, 0,9% (30,0 µg L−1, n = 7),
3,1 µg L−1, 10,3 µg L−1, 0,85 mL e 15 amostras por h, respectivamente. O método foi aplicado em
amostras de cachaça e uísque e os resultados para os testes de recuperação foram maiores que 99%.
A solid phase extraction method was developed for the direct determination of nickel in alcoholic beverages. This method is based on the adsorption of nickel onto the peel of Citrus reticulata
(mandarin orange). The solution pH, amount of adsorbent, sample and eluent flow rates, eluent concentration and matrix effects were investigated using multivariate optimization strategies. Desorption studies were carried out with 1 mol L-1 HCl. The optimum extraction conditions were
obtained using a sample pH of 6.0, sample flow rate of 4.3 mL min−1, 50 mg of sorbent mass and
1.0 mol L-1 HCl at a flow rate of 2.0 mL min-1 used as eluent. The preconcentration factor,
precision, limit of detection (LOD), limit of quantification (LOQ), consumption index and sample throughput were estimated as 12, 0.9% (30.0 µg L−1, n = 7), 3.1 µg L−1, 10.3 µg L−1, 0.85 mL and
15 samples per h, respectively. The method was applied to sugar cane spirit and whisky samples and the results for recovery tests were higher than 99%.
Keywords: nickel,preconcentration, mandarin peel, cane spirit, whisky
Introduction
Nickel is one of the essential micronutrients for plants, animals and humans, but it is toxic at elevated concentrations.1,2 Considerable attention has been paid to
the toxicity of nickel in low concentration due to the fact that certain nickel compounds may be carcinogenic.3 Thus,
it is essential from an analytical point of view to develop sensitive and low cost methods to determine trace amounts of nickel in food and beverages.
The determination of nickel can be carried out by various analytical techniques that provide acceptable sensitivity
such as inductively coupled plasma mass spectrometry (ICP-MS) and electrothermal atomic absorption spectrometry (ETAAS).4-8 However, the instruments required for these
techniques are expensive, day-to-day maintenance costs are high and there are various types of inherent sources of interference. Moreover, the direct determination of metal ions at trace levels in beverages by ETAAS is not simple and the analysis can be unreliable. Stripping voltammetric methods for direct nickel determination in beverages have been proposed; however, the interference from electroactive organic molecules and ethanol can cause a decrease in the sensitivity of this method.9
cost such as flame atomic absorption spectrometry (FAAS) have been carried out.10,11 In this regard, preconcentration/
elution is a simple method which has provided interesting results.
Solid phase extraction (SPE) has been extensively used for the separation and preconcentration of trace elements because this approach offers a number of important benefits, such as reduced disposal costs, high recoveries and easy recovery of the solid phase. Many supports have been applied to preconcentrate metal ions such as nanotubes,12 activated carbon,4 exchange
resins13,14 and modified silica,15 in which the sample passes
through a column packed with a complexing agent and is subsequently eluted for analysis.
These methodologies are extensively used for aqueous samples but are not commonly applied to alcoholic samples. It is important to highlight that there are no data reported on the application of preconcentration to quantify nickel ions in alcoholic samples. Thus, there is a need for the development of simple methods to determine metal ions using preconcentration in distinct matrices (ethanol, sugar cane spirit) in order to fill this gap in the scientific literature.
Studies on the preconcentration of metals are carried out mostly with the use of commercially available adsorbents. The use of waste materials such as low-cost adsorbents is attractive due to their contribution to reducing the cost of waste disposal and aiding environmental protection.16-18 It is evident
from a literature survey that various low cost adsorbents have shown good potential for the removal of a variety of aquatic pollutants.19-21 However, there are a few issues and
drawbacks associated with the use of low cost adsorbents in preconcentration systems. Of particular interest, there are methods which involve inorganic solid surfaces modified with chelating groups to increase the selectivity.22-24
Studies involving the use of orange peel to remove nickel from industrial effluents have been previously published.20 However, the use of this material for metal
preconcentration has not been reported in the literature. In this context, this study aims to develop an on-line preconcentration methodology coupled to FAAS for the determination of nickel in alcoholic beverages after column solid phase extraction using the peel of Citrus reticulata (mandarin orange).
Experimental
Instrumentation
A Varian SpectrAA 220 flame atomic absorption spectrometer (Melbourne, Victoria, Australia) equipped
with a nickel hollow cathode lamp and a deuterium lamp for background correction was used for the detection of nickel. The instrument was operated under the conditions recommended by the manufacturer.
The flow preconcentration system was constructed u s i n g a G i l s o n M i n i p u l s 3 p e r i s t a l t i c p u m p (Villiers-le-Bel, lle-de-France, France) equipped with eight channels and Tygon® and polyethylene tubes were
used to pump the solutions through the mini-column (50 mm × 3 mm) in the elution and preconcentration steps. A Gehaka PG1800 pH meter (São Paulo, Brazil) was used to adjust the pH of the samples and the working solutions.
Reagents and solutions
All working solutions were prepared with ultra-pure water obtained from a Milli-Q (Bedford, MA, USA) water purification system (18.2 MΩ cm at 25 °C). All reagents were of analytical grade. All laboratory glassware were previously washed with neutral detergent and then kept overnight in 10% (v/v) nitric acid solution and washed with deionized water.
The working solutions used in this study were prepared through dilution of a 100 mg L-1 stock solution
of nickel (Carlo Erba, Milan, Italy) in 95% (v/v) ethanol (Cromoline, São Paulo-SP, Brazil). Solutions of 0.5 mol L-1 HCl and 0.5 mol L-1 NaOH were used to
adjust the pH (the pH was not buffered in order to reduce interference in the adsorption process).25 Hydrochloric
acid solutions used as the eluent were prepared through the dilution in water of concentrated acid obtained from Merck (Darmstadt, Hessen, Germany).
Preparation of mini-column
The orange peel used to construct the mini-column was obtained from fruit samples purchased in a local market (Uberlândia, Brazil). The peel was separated from the pulp, washed in deionized water and dried at 75 ± 2 ºC. After drying, the peel was crushed in a domestic blender (Black & Decker, São Paulo-SP, Brazil) and passed through 850 µm sieves. The peel samples were treated with 0.1 mol L-1 NaOH
as previously reported in the literature in order to remove organic and inorganic matters from the sorbent surface.26
On-line preconcentration system
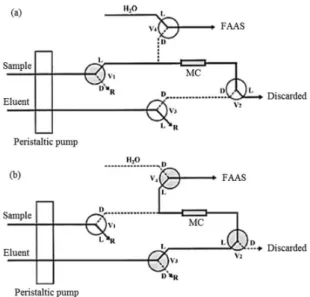
A schematic diagram of the on-line preconcentration system for Ni(II) determination by FAAS is shown in Figure 1. The flow system consists of a peristaltic pump equipped with Tygon® tubes, four three-way solenoid
valves and a mini-column filled with adsorbent. The active devices were controlled through the parallel port of a Pentium IV microcomputer using a power drive based on a ULN2803 integrated circuit. The control software was developed in Visual Basic 6.0 (Microsoft, Seattle, WA, USA) which was used to control the on/off switching time of the solenoid valves and also the time that they remained open or closed. The HyperTerminal software and a RS232C port were used for data acquisition.
The system was coupled to the FAAS instrument. During the preconcentration step (Figure 1a), valve 1 is on and the other valves remain off, the samples or working solutions are pumped through the mini-column and the effluent is discharged. In the elution step (Figure 1b), valve 1 is off and valves 2, 3 and 4 are on. Thus, the eluent percolates through the mini-column in the opposite direction to that of the sample undergoing the preconcentration step. The eluate is carried directly to the nebulization system of the FAAS instrument.
Optimization of the system
The on-line preconcentration system was optimized using the multivariate method in order to ascertain the
best conditions for nickel determination, considering maximum sensitivity and best reproducibility. A two-level full factorial 24 design with a central point and 18 runs
in total was carried out, in duplicate, to determine the influence of the selected factors and their interactions in the preconcentration system. The factors selected were: sample pH, eluent concentration, preconcentration flow rate and adsorbent mass.
Applying the optimum hydrodynamic conditions, tests were carried out to verify the influence of the sample flow rate and mass of adsorbent on the preconcentration efficiency. The experiments were carried out in duplicate, using a 30.0 µg L-1 solution of Ni(II).
Samples
Whisky and sugar cane spirit samples were purchased in a local store in Uberlândia city (Minas Gerais State, Brazil) and analyzed without prior treatment. These samples showed analyte concentrations below the limit of detection of the method, and thus to assess the recovery of the analyte, they were spiked with 40.0 µg L-1 Ni(II).
Results and Discussion
Preconcentration system optimization
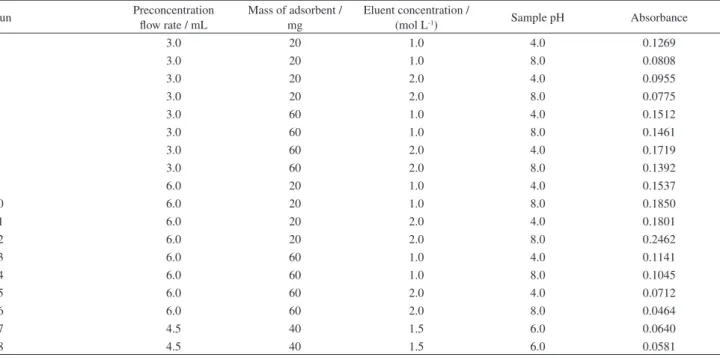
A multivariate optimization strategy was employed in order to optimize the levels for the hydrodynamic parameters associated with the preconcentration system. The analytical response was taken as the absorbance, the sample volume used for the preconcentration was 10 mL of 30 µg L−1 Ni(II) and the eluent used was HCl at a flow
rate of 2.0 mL min-1. The results are shown in Table 1. The
preconcentration time was not optimized in order to maintain the relatively high analytical frequency of the proposed method. A Pareto chart (Figure 2) was plotted from the results to verify the influence of the factors and their interactions in the system. An effect was considered significant when it was above the standard error at the 95% confidence level (p > 0.05), which is denoted by the vertical line on the graph.
As can be observed, the interaction between the sample flow rate and adsorbent mass factors shows a negative influence indicating that an increase in the flow rate combined with a decrease in the adsorbent mass leads to higher analytical signals. An improvement in the analytical response is observed with an increase in sample flow rate from 3.0 to 6.0 mL min-1 since larger amounts
of sample are preconcentrated. This behavior can be seen in the case of test 12 (Table 1). These data show that the metal sorption and desorption are favored with a higher
sample flow rate and lower adsorbent mass. The sample pH and eluent concentration variables were kept at 6.0 and 1.0 mol L–1, respectively, to obtain a lower consumption
of eluent.
Biosorbent materials contain primarily weak acidic and basic functional groups. It follows from the theory of acid-base equilibrium that, in the pH range of 2.5-5, the binding of heavy metal ions is determined primarily by the weak acidic group dissociation. The carboxyl group (–COOH) is the most important group in terms of metal uptake by biological materials.27 Low pH conditions allow
hydrogen and hydronium ions to compete with Ni(II) for metal binding sites on the biomass, causing poor Ni(II) uptake. At higher pH values (between 5-6), there are more
ligands with negative charges are exposed, resulting in greater Ni(II) sorption. However, at pH values higher than 7.0, precipitation of the solution occurs which leads to a reduction in the sorption capacity. Therefore, the initial pH of the sample was adjusted to 6.0.
For the variable eluent concentration, a variation from low (1.0 mol L-1) to high (2.0 mol L-1) values produced
a small increase in the analytical signal. However, this concentration was kept at 1.0 mol L-1 to reduce the reagent
consumption.
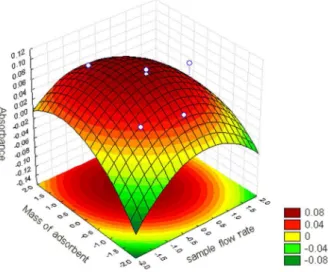
The most significant variables indicated by the factorial design (sample flow rate and adsorbent mass) were then optimized using a response surface. The response data were used to generate response surfaces for the studied system (Figure 3). The response surface can be described by the quadratic equation:
Abs = 0.08556 − 0.00352(sample flow rate) − 0.02047(sample flow rate)2 + 0.01283(adsorbent mass) −
0.01690(adsorbent mass)2 − 0.00689(sample flow rate)
(adsorbent mass) (1)
The maximum point was obtained for the surface response and the critical values for the investigated factors adopted in further experiments were: sorbent mass of 50 mg and sample flow rate of 4.3 mL min-1.
Thus, as a result of the optimization procedures, the following working conditions were selected: adsorbent mass of 50.0 mg, sample flow rate of 4.3 mL min-1, sample Table 1. Conditions for Ni(II) preconcentration and analytical response for the study of multivariate optimization using SPE with orange peel and analyte determination by FAAS
Run Preconcentration
flow rate / mL
Mass of adsorbent / mg
Eluent concentration /
(mol L-1) Sample pH Absorbance
1 3.0 20 1.0 4.0 0.1269
2 3.0 20 1.0 8.0 0.0808
3 3.0 20 2.0 4.0 0.0955
4 3.0 20 2.0 8.0 0.0775
5 3.0 60 1.0 4.0 0.1512
6 3.0 60 1.0 8.0 0.1461
7 3.0 60 2.0 4.0 0.1719
8 3.0 60 2.0 8.0 0.1392
9 6.0 20 1.0 4.0 0.1537
10 6.0 20 1.0 8.0 0.1850
11 6.0 20 2.0 4.0 0.1801
12 6.0 20 2.0 8.0 0.2462
13 6.0 60 1.0 4.0 0.1141
14 6.0 60 1.0 8.0 0.1045
15 6.0 60 2.0 4.0 0.0712
16 6.0 60 2.0 8.0 0.0464
17 4.5 40 1.5 6.0 0.0640
18 4.5 40 1.5 6.0 0.0581
Figure 2. Pareto chart obtained from the optimization study of the variables, with their significance, for the preconcentration of Ni(II) using
pH of 6.0, eluent concentration of 1.0 mol L-1 and flow rate
of 2.0 mL min-1.
Interference
The effect of Na(I), Cu(II) and Fe(III) on the determination of nickel was studied using a mixed solution method, in which the solution contained a fixed concentration of nickel and various concentrations of interfering ions. These ions were chosen based on previously published studies on alcoholic samples.28
Solutions containing 30 µg L-1 of nickel and 30 and
300 µg L–1 of interfering ions were prepared. The solutions
containing the nickel sample plus the potential interference ions were analyzed by the proposed method. The response was compared to that obtained for an unspiked nickel solution. A species is considered as an interferent in the proposed procedure when the difference between the signals of the solution containing only Ni(II) ions and those containing the possible interference ions is more than 10%.
The results of this study suggest that the interference of the ions tested concomitantly was significant. This interference can be attributed to the competition from the ions for the adsorption sites since the interaction of metal species on the adsorbent surface occurs primarily through ion exchange or complexation. However, the levels of such ions in real samples are much lower than the levels studied in this research.
Analytical features
The analytical performance of the proposed method was evaluated under the optimized conditions, i.e., adsorbent
mass of 50.0 mg, sample flow rate of 4.3 mL min–1, sample
pH of 6.0, eluent concentration of 1.0 mol L–1 and flow rate
of 2.0 mL min–1.
The preconcentration factor (PF) was obtained by calculating the slope ratio of the calibration curves obtained with and without the preconcentration. Detection and quantification limits were calculated as three and ten times the standard deviation of 15 independent measurements of a blank sample divided by the slope of the calibration curve, respectively. The consumption index, defined as the volume of sample (mL) consumed to achieve one PF unit, is expressed by the equation CI = Vs/PF, where Vs is the
sample volume consumed to achieve the PF value. The quantification carried out with the on-line preconcentration system for the determination of Ni(II) in beverage samples provided good linearity (correlation coefficient ≥ 0.997) in the range of 10-75.0 µg L–1, in
which the regression equation for nickel determination is Abs = 1.5 × 10⁻³[Ni2+] – 2.6 × 10⁻⁴. The limits of
detection and quantification were found to be, respectively, 3.1 and 10.3 µg L-1 and a preconcentration factor of 12 was
obtained. The repeatability of the proposed method was assessed by performing seven consecutive preconcentration steps at a concentration level of 30 µg L−1 nickel and the
result expressed in terms of relative standard deviation. A value of 0.9% was obtained, demonstrating excellent repeatability. The CI value was 0.85 mL. A single column can be used for 40 successive cycles of preconcentration and elution without loss of stability.
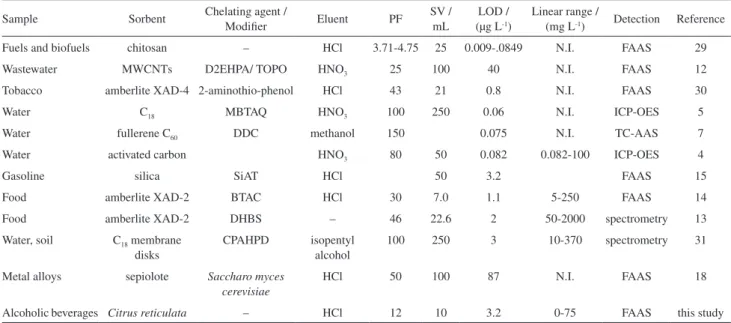
Some applications of preconcentration techniques for the determination of nickel in several samples are presented in Table 2. Preconcentration methods based on solid phase extraction are attractive when coupled with the detection instrument and with the use of sorbent and chelating agents. These methods provided limits of detection in the range of 0.009 to 87 µg L–1 and preconcentration factors of 3.71 to 150. As
can be observed, the adsorbent preconcentration method described herein showed better or similar performance when compared with previously published results, in terms of limits of detection and sample consumption, and it does not require the use of complexing agents. The procedure developed based on a natural adsorbent with FAAS detection allowed the determination of nickel at the level of µg L–1 in alcoholic samples without the need
for a specific sample preparation step.
Application of the method and recovery tests
The proposed method was applied to samples of alcoholic beverages obtained at a local store in
Uberlândia city. The samples analyzed were acidified and eluted with hydrochloric acid to ensure that the nickel was recovered in its complexed forms. In order to assess the analyte recovery, all samples were spiked at concentration levels ranging from 0 to 40.0 µg L–1. The results are shown
in Table 3, in which it can be seen that there is no difference in the recovery values for these samples, indicating that
the analyte is quantitatively retained and eluted in all the evaluated samples.
Conclusions
The on-line preconcentration system described herein is simple and allows the direct determination of Ni(II) at the level of µg L–1 in alcoholic beverage samples by FAAS.
The validation process involving the evaluation of the limits of detection and quantification, recovery tests and preconcentration factor indicated the applicability of the proposed system to real samples. Other advantages offered by the proposed procedure are lower cost, lower consumption of reagents, and reduced analyte losses and contamination risks compared with other methods currently available.
The use of Citrus reticulata peel in the on-line preconcentration system was shown to be efficient in the preconcentration of nickel from complex samples, in this case, beverages. Moreover, the material could be applied to other samples and metal ions.
Acknowledgements
The authors are grateful for financial support from the Brazilian government agencies Conselho Nacional de Desenvolvimento Científico e Tecnológico (CNPq) and
Table 2. Comparison of methods for determination of nickel using the preconcentration system
Sample Sorbent Chelating agent /
Modifier Eluent PF
SV / mL
LOD / (µg L-1)
Linear range /
(mg L-1) Detection Reference
Fuels and biofuels chitosan – HCl 3.71-4.75 25 0.009-.0849 N.I. FAAS 29
Wastewater MWCNTs D2EHPA/ TOPO HNO3 25 100 40 N.I. FAAS 12
Tobacco amberlite XAD-4 2-aminothio-phenol HCl 43 21 0.8 N.I. FAAS 30
Water C18 MBTAQ HNO3 100 250 0.06 N.I. ICP-OES 5
Water fullerene C60 DDC methanol 150 0.075 N.I. TC-AAS 7
Water activated carbon HNO3 80 50 0.082 0.082-100 ICP-OES 4
Gasoline silica SiAT HCl 50 3.2 FAAS 15
Food amberlite XAD-2 BTAC HCl 30 7.0 1.1 5-250 FAAS 14
Food amberlite XAD-2 DHBS – 46 22.6 2 50-2000 spectrometry 13
Water, soil C18 membrane disks
CPAHPD isopentyl alcohol
100 250 3 10-370 spectrometry 31
Metal alloys sepiolote Saccharo myces cerevisiae
HCl 50 100 87 N.I. FAAS 18
Alcoholic beverages Citrus reticulata – HCl 12 10 3.2 0-75 FAAS this study
MWCNTs: multiwalled carbon nanotubes; D2EHPA: di-(2-ethyl hexyl phosphoric acid); TOPO: tri-n-octyl phosphine oxide; MBTAQ: 5-(6-methoxy-2-benzothiazoleazo)-8-aminoquinoline; TC-AAS: tungsten coil atomic absorption spectrometry; DDC: sodium diethyldithiocarbamate; SiAT: 2-aminothiazole; BTAC: 2-(2-benzothiazolylazo)-2-p-cresol; DHBS: 4,5-dihydroxy-1,3-benzenodisulfonic acid; CPAHPD: 5-(4’ -chlorophenylazo)-6-hydroxypyrimidine-2,4-dione; PF: preconcentration factor; SV: sample volume; LOD: limit of detection; FAAS: flame atomic absorption spectrometry; ICP-OES: inductively coupled plasma optical emission spectrometry. N.I.: not informed.
Table 3. Relative recovery for the samples submitted to the proposed method
Sample Ni(II) added / (µg L-1)
Ni(II) found /
(µg L-1) Recovery / %
A 0 ˂ LOD –
30.0 29.7 99.0
40.0 44.1 110.2
B 0 ˂ LOD −
30.0 31.2 104.0
40.0 44.2 110.5
C 0 ˂ LOD –
30.0 30.6 102.0
40.0 44.3 110.7
D 0 ˂ LOD –
30.0 31.3 104.0
40.0 42.3 105.6
Coordenação de Aperfeiçoamento de Pessoal de Nível Superior (CAPES), from Fundação de Amparo à Pesquisa do Estado de Minas Gerais (FAPEMIG), the MG State Government agency, and Fundação de Amparo à Pesquisa do Estado de Goiás (FAPEG), the GO State Government agency.
References
1. Kristic, B.; Stankovic, D.; Igic, R.; Nikolic, N.; Biotechonol. Equip. 2007, 21, 431.
2. Templeton, D.; Biological Monitoring of Chemical Exposure in the Workplace; World Health Organization: Genova, 1990. 3. Mckenzie, H. A.; Smythe, L. E.; Quantitative Trace Analysis
of Biological Materials; Elsevier: Amsterdam, 1998. 4. Yunes, N.; Moyano, S.; Cerutti, S.; Gásquez, J. A.; Martinez,
L. D.; Talanta 2003, 59, 943.
5. Khorrami, A. R.; Hashempur, T.; Mahmoudi, A.; Karimi, A. R.;
Microchem. J. 2006, 84, 75.
6. Silva, M. M.; Arruda, M. A. Z.; Krug, F. J.; Oliveira, P. V.; Queiroz, Z. F.; Gallego, M.; Valcárcel, M.; Anal. Chim. Acta
1998, 368, 255.
7. Silva, E. L.; Roldan, P. S.; Giné, M. F.; J. Hazard. Mater. 2009,
171, 1133.
8. Adam, T.; Duthie, E.; Feldmann, J.; J. Inst. Brew. 2002, 108, 459.
9. Dugo, G.; Pêra, L. L.; Turco, V. L.; Bella, G. D. D.; Salvo, F.;
J. Agric. Food Chem. 2004, 52, 1829.
10. Sahin, Ç. A.; Efeçinar, M.; Satiroglu, N.; J. Hazard. Mater. 2010, 176, 672.
11. Oral, E. V.; Dolak, I.; Temel, H.; Ziyadanogullari, B.; J. Hazard. Mater. 2011, 186, 724.
12. Vellaichamy, S.; Palanivelu, K.; J.Hazard. Mater. 2011, 185, 1131.
13. Lemos, V. A.; Baliza, P. X.; Santos, J. S.; Nunes, L. S.; Jesus, A. A.; Rocha, M. E.; Talanta 2007, 66, 174.
14. Ferreira, S. L. C.; Santos, W. N. L.; Lemos, V. A.; Anal. Chim. Acta 2001, 445, 145.
15. Roldan, P. S.; Alcantara, I. L.; Padilha, C. C. F.; Padilha, P. M.;
Fuels 2005, 84, 305.
16. Araújo, C. S. T.; Alves, V. N.; Rezende, H. C.; Coelho, N. M. M.;
Microchem. J. 2010, 96, 82.
17. Alves, V. N.; Mosquetta, R.; Coelho, N. M. M.; Bianchin, J. N.; Roux, K. C. P.; Martendal, E.; Carasek, E.; Talanta 2010, 80, 1133.
18. Bag, L. H.; Lale, M.; Turker, A. R.; Talanta 1998, 47, 689. 19. Bhatnagar, A.; Sillanpãa, M.; Chem. Eng. J. 2010, 157, 277. 20. Ajmai, M.; Rao, R. A. K.; Ahmad, R.; Ahmad., J.; J. Hazard.
Mater. 2000, 79, 117.
21. Tuzen, M.; Soylak, M.; J. Hazard. Mater. 2009, 164, 1428. 22. Duran, A.; Tuzen, M.; Soylak, M.; J. Hazard. Mater. 2009, 169,
466.
23. Soylak, M.; Quim. Anal. 2002, 20, 175.
24. Soylak, M.; Tuzen, M.; J. Hazard. Mater. 2006, 138, 195. 25. Abollino, O.; Aceto, M.; Malandrino, M.; Sarzanini, C.;
Mentasti, E.; Water Res. 2003, 37, 1619.
26. Marques, T. L.; Alves, V. N.; Coelho, L. M.; Coelho, N. M. M.;
Water Sci. Technol. 2012, 65, 1435.
27. Bhatti, H. N.; Mumtaz, B.; Hanif, M. A.; Nadeem, R.; Process Biochem. 2007, 42, 547.
28. Mosquetta, R.; Ribeiro, G. C.; Munoz, R. A. A.; Coelho, N. M. M.; Coelho, L. M.; Quim. Nova 2011, 34, 923. 29. Prado, A. G. S.; Pescara, I. C.; Evangelista, S. M.; Holanda,
M. S.; Andrade, R. D.; Suarez, P. A. Z.; Zara, L. F.; Talanta
2011, 84, 759.
30. Lemos, V. A.; Novaes, C. G.; Lima, A. S.; Vieira, D. R.;
J. Hazard. Mater. 2008, 155, 128.
31. Amin, A. S.; Al-Attas, A. S.; J. Saudi Chem. Soc. 2012, 16, 451.