Article
Printed in Brazil - ©2016 Sociedade Brasileira de Química0103 - 5053 $6.00+0.00*e-mail: [email protected]
Synthesis and Characterization of Nanopore Mo
VI-Imprinted Polymer and Its
Application as Solid Phase for Extraction, Separation and Preconcentration of
Molybdenum Ions from Water Samples
Fatemeh Ardestani,a Majid Haji Hosseini,*,b Majid Taghizadeh,a Mohammad Reza Pourjavidb and Mohammad Rezaeeb
aDepartment of Chemical Engineering, Babol University of Technology, 484, 4714871167 Babol,
Iran
bNuclear Fuel Cycle Research School, Nuclear Science & Technology Research Institute, Atomic
Energy Organization of Iran, 14395-836 Tehran, Iran
The purpose of this study is to prepare a new ion imprinted polymer for MoVI with high
selectivity. Ion-imprinted polymer (IIP) particles were synthesized by thermally copolymerization. For the synthesis of the ion imprinted polymer, the ion pair of (MoVI-thiocyanate) and NR
4+ was
used. The ion pair was precipitated in an aqueous phase and then dissolved in acetonitrile as a porogen. The imprinted ion was removed using 10% (v/v) methanol in HCl (0.5 mol L-1). The
unleached and leached IIP particles were characterized by infrared spectroscopy, thermogravimetric analysis, surface area analysis, scanning electron microscopy and energy dispersive X-ray analysis. The use of the new MoVI-IIP in solid phase extraction revealed a maximum adsorption capacity of
3.77 mg MoVIper gram of MoVI-IIP in optimum conditions of extraction. The selectivity coefficients
of the IIP for Mo in comparison with other metal ions were also evaluated. The proposed Mo-IIP was successfully applied for MoVI determination in different types of water samples.
Keywords: ion imprinted polymer, molybdenum(VI), thermal copolymerization, solid phase extraction
Introduction
Molybdenum is a biologically important trace element, which occurs in various oxidation states in minerals rather
than as free metal.Molybdenum in real water exists in
the form of MoO42− ion and this form (MoVI) is generally
assumed to be the dominant oxidation state in oxic natural
waters, while MoV is thermodynamically stable in reducing
waters.1,2 Molybdenum ions play an important role in
enzymatic processes, and stimulate the synthesis of proteins
and nucleic acids.3 Its deficiency may results in reduced
growth or yield loss and even death due to accumulating nitrate, reducing amino acid concentration and falling level
of vitamin metabolism in plant tissue.4 It is, however, toxic
at high concentrations for both plant and human causing bone deformation and disturbances in the metabolism of
fats and proteins in human.5 Molybdenum is used as a
component in glass, fertilizer, catalyst, lubricant and alloy
of steel. As a result, industrial effluents contain excess of molybdenum that causes detrimental effects in animals
and human beings. Very low concentrations of MoVI can
be found in water supplies such as river, spring and well water. Therefore, it is important to develop a sensitive and selective method of Mo environmental monitoring to know the exposure level of this element. Mo limit in drinking water declared by environmental protection
agency (EPA) is 90 µg L-1. For the determination of trace
the preconcentration and separation of trace analytes from water samples.
Molecular imprinted polymers (MIPs) have been developed over the years for carbohydrate, amino acids
and their derivatives.6 Molecular imprinting is a technique
for preparing polymeric materials that are capable of high molecular recognition. The resultant imprints possess a steric and chemical memory for the template. In molecular imprinting process, selected functional monomers are polymerized around a target molecule (template) in
presence of a crosslinking agent.7-9 After removal of the
template trapped in a highly crosslinked polymeric matrix, selective cavities together with the shape of the template
are created.10 For metal ions, molecular imprinting can be
interpreted as an ionic imprinting. Ion imprinted polymers (IIPs) are similar to MIPs, but they recognize inorganic ions
after imprinting.11-13 The selectivity of an ion imprinted
polymer is based on the metal ion interaction with a specific ligand, coordination geometry, metal ion coordination
number, charge and size.14-17
There are some reports on the nanopore IIP preparation and their applications as the solid phase extraction (SPE) sorbent for the preconcentration of the analytes present in trace amounts or their separation from other coexisting
species in complex matrix.18-20 MoVI oxy ion imprinted
particle was prepared firstly by the surface metal ion imprinting technique with a sol-gel process on the surface
of amino-silica by Ren et al.21 They used MoVI oxy
ion-imprinted as an adsorbent for preconcentration and
separation of MoVI trace amounts from the water samples.
In this work nanopore molybdenum(VI)-imprinted and non-imprinted copolymers were synthesized by using methacrylic acid (MAA) as a monomer, ethylene glycoldimethacrylate (EGDMA), as crosslinking agent, and 2,2’-azobisisobutyronitrile (AIBN) as initiator, after
removal of MoVI ions, MoVI-imprinted polymer was used for
solid phase extraction and preconcentration of MoVI from
aqueous solutions. The different parameters affected on the extraction of Mo ions were optimized by using one variable at a time and chemometric tools (central composite design, CCD). Finally, the analytical application and selectivity behavior of the synthesized materials were described and discussed.
Experimental
Instrumentation
A PerkinElmer (Kentucky, USA) 7300 DV Optima model inductively coupled plasma-atomic emission spectroscopy (ICP-AES) was used for the determination of
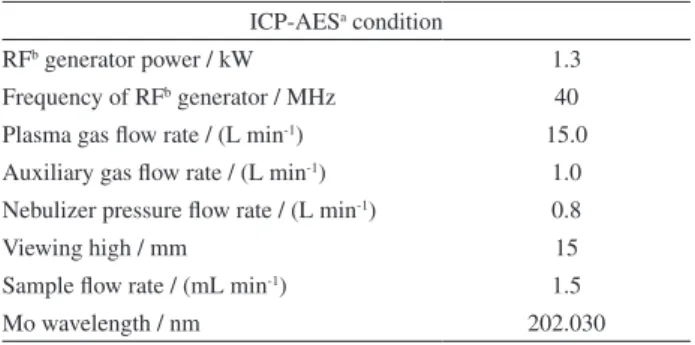
metal ion. The argon gas with 99.999% (v/v) purity for ICP-AES was purchased from Roham Gas Co. Measurement was made in triplicate under the operating conditions listed in Table 1.
The infrared (IR) spectra (400-4000 cm-1) in KBr
were recorded with the aid of a Vertex 70 spectrometer (Bruker, Billerica, USA). Thermogravimetric analysis was carried out using the Rheometric scientific simultaneous thermal analyzer (London, England). Nitrogen sorption studies were made by a Quantachrome NOVA instrument (Florida, USA). The morphology of the unleached and leached IIP particles were examined by scanning electron microscopy (SEM), using a Philips XL-30 scanning electron microscope. A peristaltic pump model PD-5101 (Heidolph, Germany) was used in the SPE process. A Metrohm model 744 digital pH meter (Herisau, Switzerland), equipped with a combined glass-calomel electrode was employed for the pH adjustments. A Hettich centrifuge model EBA 20 (Oxford, England) was employed for phase separation.
Chemicals and reagents
Ethylene glycoldimethacrylate (Merck, Darmstadt, Germany), 2,2’-azobisisobutyronitrile (98%, m/m, Acros, USA), methacrylic acid (Sigma-Aldrich, Steinheim,
Germany) and tetra-n-butylammonium hydroxide (20%,
m/m, Merck, Darmstadt, Germany) were applied for the synthesis of polymers with analytical reagent grades. Hydrochloric acid was obtained from Sigma-Aldrich (Steinheim, Germany). All other chemicals were of analytical reagent grades and they were purchased from
Merck (Darmstadt, Germany). Na2MoO4.2H2O (Merck,
99%, m/m) was used as the source of MoVI and nitrate or
chloride salts of other cations (all from Merck) were of the highest purity available and were used without any
further purification. Stock solution of MoVI (100 µg mL-1)
was prepared by dissolving appropriate amounts of Table 1. Optimized conditions for ICP determination of the Mo ion
ICP-AESa condition
RFb generator power / kW 1.3
Frequency of RFb generator / MHz 40
Plasma gas flow rate / (L min-1) 15.0
Auxiliary gas flow rate / (L min-1) 1.0
Nebulizer pressure flow rate / (L min-1) 0.8
Viewing high / mm 15
Sample flow rate / (mL min-1) 1.5
Mo wavelength / nm 202.030
Na2MoO4.2H2O in deionized water in a 100 mL volumetric flask. Dilute solutions were prepared by appropriate dilution of the stock solution in deionized water.
Ion-imprinted polymer (IIP) preparation
The synthesis of poly(ethylene glycoldimethacrylate-co-methacrylic acid) was based on the bulk polymerization method. In the first step, the inorganic complex was formed
between MoVI and thiocyanate (SCN−) in aqueous solution,
thereafter the ion pair formed between the Mo-SCN inorganic complex as a bulk anion and tetrabutylammonium
(NR4+) as a bulk cation. For this task, the aqueous solution
1.25 mol L-1 of HCl (500 mL), containing 5.2 × 10⁻³ mol L-1
of MoVI and 0.1 mol L-1 NaSCN was prepared. Then, 8.2 mL
from NR4OH (20%, m/m) was added into the Mo solution.
The ion pair was formed and precipitated completely. The red precipitate was separated after 2 days, and it was dissolved in 52 mL acetonitrile. In order to obtain the amount of Mo in acetonitrile, the aqueous solution was analyzed before and after precipitation. The amount of Mo calculated was about 2.3 mmol. 20 mL acetonitrile solution containing 0.9 mmol of molybdenum ion pair, 3 mmol of MAA, 20 mmol of EGDMA and 0.1 g AIBN was transferred into polymerization reactor. Following this procedure, the solution was purged thoroughly with argon gas for 2 min and the reaction flask was sealed immediately.
The mixture was subsequently polymerized at 80 oC for
48 hours. The resulting red solid polymer was dried in
an oven at 70 oC for 4 hours. The IIP was grounded in a
mechanical mortar and then it was sieved (≤ 100 µm). The
residuary (e.g., unconverted monomer, initiator and solvent) was removed using water/methanol solution (20%, v/v). In order to remove the Mo ions confined in the selective cavity of the polymer, it was washed successively with
10% (v/v) methanol in HCl (0.5 mol L-1) and monitored
simultaneously by ICP-AES. Finally, the particles were
washed by distilled water and dried in an oven at 70 oC
for 3 hours. To evaluate the imprinting effect of the Mo-imprinted polymer, the same procedure was adopted, in absence of Mo ion pair, which was designed as an non-imprinted polymer (NIP). The IIP and NIP polymers were further characterized by infrared spectroscopy (IR), thermal gravimetric analysis (TGA), SEM, X-ray and Brunauer-Emmett-Teller (BET) techniques.
Solid-phase extraction of MoVI
A total 200 mg of Mo-imprinted polymer was packed into a SPE column (6.0 × 1.0 cm internal diameter), made of polyethylene, a polyethylene frit was placed at both
ends to prevent the loss of the polymer during the sample loading. Before loading the sample, SPE cartridge was conditioned by passing 20 mL deionized water at a flow
rate of 1.5 mL min-1. Then, 35 mL of the sample containing
MoVI, SCN− NR
4+ in the HCl 3 mol L-1 was passed through
the column at flow rate of 1.5 mL min-1 (controlled by a
peristaltic pump). In this solution, number of moles of
SCN− and NR
4+ were 600 and 50 moles per each mole of
Mo. The column was washed with 7 mL distilled water at
a flow rate of 1.5 mL min-1.
Loading capacity
To investigate the loading capacity of IIP, 200 mg of IIP was packed into the SPE column and 20 mL of the sample
containing 50 mg L-1 MoVI, and equivalent of each Mo
mole, 600 moles of SCN− and 70 moles of NR
4+ in the HCl
3 mol L-1 media was passed through the column at flow rate
of 1.5 mL min-1. The Mo content of the sample was passed
through the IIP column measured by ICP. Loading capacity of the polymer was calculated by the following equation:
(1)
where Q is the loading capacity of the polymer (mg g-1);
Ci and Cf are the concentrations of the ions in the initial
solution and in the aqueous phase after passing through the
IIP column, respectively (mg L-1); V is the volume of the
aqueous phase (L) and W is the amount of polymer (g).22
Selectivity experiments
In order to evaluate the selectivity of the imprinted adsorbent, 20 mg of IIP and NIP were packed into the SPE
columns. 2 mL of the aqueous solutions (HCl 3 mol L-1)
including MoVI and other metallic ions (Cu2+, Cr3+, Cd2+,
Pb2+, Zn2+, Mg2+, Co2+, Fe3+, Mn2+ and U6+) binary mixtures
containing 0.25 mg L-1 of Mo and different amount from
each metallic ions with 600 moles of SCN− and 70 moles of
NR4+ equivalent of each mole of Mo were passed through
the IIP and NIP columns at the flow rate of 1.5 mL min-1.
The concentration of Mo ions in the transit solution through the IIP column was measured by ICP. The parameters related to the selective performance of sorbents, such
as distribution (Kd) and selectivity (k) coefficients were
determined according to the literature data.23 Distribution
coefficient was calculated according to:
where Ci, Cf and Vs represent the initial, final solution concentrations and the volume of the solution, respectively. The selectivity coefficient is defined as the ratio between the
distribution coefficient for MoVI ions and the distribution
coefficient for interfering ions as k.
(3)
Results and Discussion
Characterization studies
The MoVI-IIP particles were characterized by different
characterization techniques. The IR spectra of the NIP, unleached IIP and leached IIP particles were recorded by the KBr pellet method using a vertex spectrometer.
The absence of bands in the region of 1638-1648 cm-1
indicates the absence of vinyl groups in the polymer particles. This observation could be possibly attributed to the polymerization of both MAA and EGDMA (Figure 1).
The three peaks at 1108, 2042 and 2354 cm-1, just in the
spectra of unleached polymer (UIIP), could be attributed
to νC–N (in tetrabuthylamonium), νSCN and νC≡N (in SCN)
respectively, illustrating that the ion pair was removed completely during the leaching process (LIIP). The IR spectra of NIP and leached IIP were found to be almost similar indicating that all the polymer particles have similar
backbones. The C=O stretching vibration at 1728 cm-1 in
the NIP was shifted to 1722 cm-1 in the UIIP and to 1730 in
the LIIP material, showing that the oxygen of C=O group is involved in the Mo interaction.
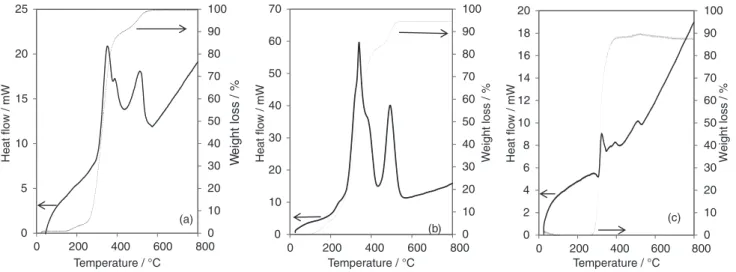
Figure 2 shows the thermal degradation behaviors of unleached IIP, leached IIP and NIP particles. Unleached IIP presented four main weight loss steps in the ranges:
131-231 oC, 231-350 oC, 350-414 oC and 450-532 oC.
Leached IIP presented three main weight loss steps in
the ranges: 150-236 oC, 255-393 oC and 393-550 oC, also
NIP presented two main weight loss steps in the ranges
255-393 oC and 432-532 oC. The first step for unleached IIP
in the range of 131-231 oC and for leached IIP in the range
of 150-236 oC are due to the presence of physisorbed water.
In the second step, two pronounced weight losses were
observed in unleached IIP within the ranges of 231-350 oC
and 450-532 oC with maximum degradation temperatures
(Tmax) of 341 and 490 oC respectively, in leached IIP within
the ranges of 255-393 oC and 393-550 oC with T
max of 352
and 518 oC and in NIP within the ranges of 255-393 oC
and 432-532 oC with T
max of 332 and 507 oC which
was attributed to the decomposition of poly(EGDMA)
segment. The third step, for unleached IIP with Tmax 386 oC
corresponds to the decomposition of the ion pair. For NIP, the end product has higher residual yield (12.5%) when compared with the unleached IIP (5.8%) and leached IIP (0.625%). This difference could be related to the absence of coordination between EGDMA and MAA with the ion pair Figure 1. IR spectra of the (a) NIP; (b) unleached IIP; (c) leached IIP particles. 0 10 20 30 40 50 60 70 80 90 100 0 5 10 15 20 25
0 200 400 600 800
W eight loss /% H e a t fl o w / m W (a) 0 10 20 30 40 50 60 70 80 90 100 0 10 20 30 40 50 60 70
0 200 400 600 800
H e a t fl o w / m W
Temperature / °C
Temperature / °C Temperature / °C
W
eight loss /
% (b) 0 10 20 30 40 50 60 70 80 90 100 0 2 4 6 8 10 12 14 16 18 20
0 200 400 600 800
Weight loss /
% H e a t fl o w / m W (c)
during synthesis, which can lead to additional interactions between the monomers, resulting in higher residual yield (12.5%) for NIP.
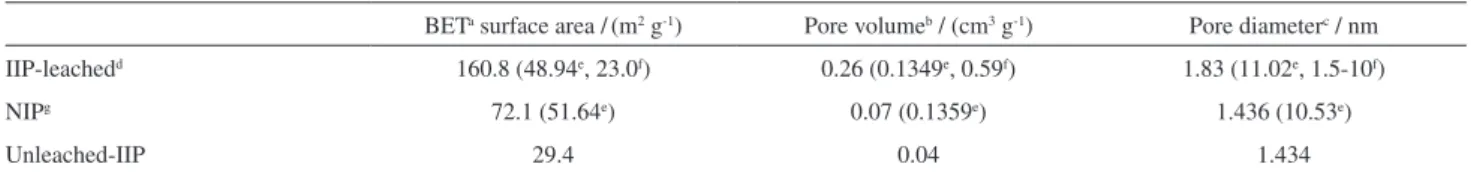
The synthesized IIP particles were characterized using nitrogen sorption studies, in order to know the surface properties of the leached IIP, unleached IIP and NIP particles. The surface area was determined by applying the BET equation. The data are recorded in Table 2 for the leached, unleached and non-imprinted polymer particles. It is clearly seen that porosity changes after the removal of molybdenum ions from the IIP particles. A comparison between the surface properties of synthesized IIP and other SPE materials for the extraction and determination of Mo is presented in Table 2.
The morphology of the polymers was assessed by SEM. The respective micrographs shown in Figures 3a and 3b, illustrate that the porosity is changed after the removal of the molybdenum ions. In addition, it is clear that the pore size in the leached polymers was in the nano-range, corresponding to the ion size.
The energy dispersive X-ray (EDX) spectra for the unleached and leached polymer particles confirmed that the absence of molybdenum in EDX spectrum of the leached polymer particles illustrates the complete removal of molybdenum from the polymer matrix in leaching step.
Optimization of sorption and elution of MoVI ions from the
IIP particles in the column
The critical variables (e.g., concentrations of HCl, NR4+,
and SCN− in the sample and elution condition) affected
the extraction of molybdenum ions from water samples and their variation ranges were first selected based on a preliminary one variable at a time (OVAT) procedure, and further optimization was then performed by response surface methodology (RSM), based on rotatable face central composite design (FCCD).
According to the results obtained by OVAT method, there are several factors such as complex formation time,
HCl, SCN− and NR
4+ concentration in the sample, which
may affect the extraction process. To find the optimum condition on the extraction of molybdenum ions from
water samples, and to investigate the probable interaction between variables, RSM based on rotatable FCCD was used.
Preliminary OVAT procedure
Various experimental parameters such as concentrations
of HCl, NR4+, SCN− in the sample and elution condition
which may effect on the extraction of MoVI ions were
investigated. 200 mg IIP was packed in the column. The created conditions were chosen by preliminary tests as
follows: 20 mL solution containing 1 mg L-1 MoVI, and
equivalent of each Mo mol, 400 moles of SCN− and
50 moles of NR4+ was prepared. The flow rate of the sample
solution through the column was chosen 0.74 mL min-1. In
Table 2. Nitrogen sorption data for leached IIP, unleached IIP and NIP particle
BETa surface area /(m2 g-1) Pore volumeb / (cm3 g-1) Pore diameterc / nm
IIP-leachedd 160.8 (48.94e, 23.0f) 0.26 (0.1349e, 0.59f) 1.83 (11.02e, 1.5-10f)
NIPg 72.1 (51.64e) 0.07 (0.1359e) 1.436 (10.53e)
Unleached-IIP 29.4 0.04 1.434
aBET: Brunauer-Emmett-Teller; bby method BET; cby method BJH-Barrett-Joyner-Halenda; dIIP: ion imprinted polymer; ereference 21; freference 24; gNIP: non-imprinted polymer.
order to elute MoVI from IIP, 10 mL HCl 0.5 mol L-1 was
passed through the column at flow rate of 0.26 mL min-1.
HCl concentration effect
The effect of HCl concentration was investigated in
the range of 0.15-2 mol L-1 (Figure 4). The maximum
percentage of recovery of Mo ions was determined at HCl
2 mol L-1.
NR4+ concentration effect
In these series of experiments, the concentrations of all reagents and conditions were kept constant while the
concentration of NR4+ was varied between 0 to 50 moles of
NR4+ equivalent of each mole of Mo. Based on the results,
50 moles of NR4+ equivalent of Mo mole have the maximum
recovery of MoVI from sample waters.
SCN− concentration effect
The effect of SCN− concentration on the extraction was
also examined (Figure 4). In this series of experiments, only
the SCN− concentration varied in the range 10-500 moles
of SCN− equivalent of Mo mole. The recovery percentage
of MoVI was significantly affected by the concentration
of SCN−.
Effect of flow rate
The effect of sample and eluent solution flow rate through the column on the retention and recovery of Mo
ions was investigated in the range of 0.25 to 1.5 mL min-1.
It was found that the adsorption and elution of the metal ions were reproducible in the flow rate range of 0.25 to
1.5 mL min-1. Thus, the flow rates of the sample and eluent
solution were adjusted 1.5 mL min-1 throughout the further
studies.
Choice of eluent
In order to choose the most effective eluent for quantitative stripping of the retained Mo ions from the
column, different eluents such as, HCl (0.5 mol L-1), HCl
(0.1 mol L-1), NaOH (0.1 mol L-1) and water was chosen.
According to the results, distilled water turned out to be the most effective eluent for quantitative elution. The decrease in elution of Mo at acidic media (pH < 7) is due
to the existence of molybdenum in the form of Mo6+. This
form of ion is suitable for interaction with SPE pore. At
higher pH, molybdenum is converted to MoO42−, so elution
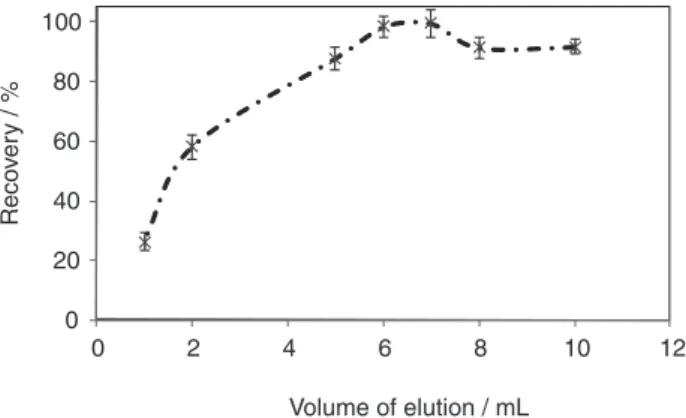
was well done. In order to find optimum volume of the elution solvent, different volumes of distilled water from 1 to 10 mL were used; the results are displayed in Figure 5. As seen, quantitative elution was attained using volumes more than 6 mL.
Response surface methodology
In order to obtain a high recovery and enrichment factor, the effect of different parameters such as time of complex
formation, concentration of HCl, amount of SCN− and
NR4+ in the sample, were analyzed. Response surface
methodology including face-center central composite approach was utilized to find the optimum values of effective variables involved in the system.
The design was built up of four factors at three levels
(Table 3) with 16 axial points (α = 1). In order to estimate the
experimental error, eight replicas at the central point were applied. The design was rotatable, this means that the design had equidistant points from the center. This procedure led to 32 experiments (Table 4), where the experimental
0 100 200 300 400 500 600
0 20 40 60 80 100 120
0 0.5 1 1.5 2
Mole ratio of SCN−to Mo
Reco
ver
y /
%
Concentration of HCl / (mol L-1)
Figure 4. Effect of concentration of HCl () experimental conditions: sample; 20 mL containing concentration of Mo: 1 mg mL-1; mole of
SCN−per mole of Mo: 400; mole of NR
4+per mole of Mo: 50; eluent:
10 mL HCl 0.5 mol L-1; sample flow rate: 0.74 mL min-1; eluent flow
rate: 0.26 mL min-1. Concentration of SCN− () experimental conditions:
sample; 20 mL containing concentration of Mo: 1 mg mL-1 in HCl
2 mol L-1 other conditions are similar on the adsorption of MoVI on the
MoVI-imprinted polymer.
0 20 40 60 80 100
0 2 4 6 8 10 12
Reco
ve
ry
/ %
Volume of elution / mL
Figure 5. The effect of volume eluent on elution of Mo adsorbed on IIP (experimental conditions: sample; 20 mL containing concentration of Mo: 1 mg mL-1; mole of SCN-per mole of Mo: 500; mole of NR
4+ per
mole of Mo: 50 in HCl 2 mol L-1; eluent: 10 mL water; sample flow rate:
results were analyzed by a regression procedure based on
the RSM.25 Composite design is well known as a useful
method to describe the curvature dependency of a typical response to its variables, which needed to explain a non-linear variation behavior. The model that can be fitted to a composite design is an empirical function, determined by the statistical correlation suitability of the observed responses and experimental factors. For this purpose, a second-order four variable-polynomial model equation is
usually used (equation 4).26
Y = a0 + a1x1 + a2x2 + a3x3 + a4x4 + a11x12 + a22x22 +
a33x32 + a44x42 + a12x1x2 + a13x1x3 + a14x1x4 + a23x2x3 +
a24x2x4 + a34x3x4 (4)
where Y is the predicted response. The response here is the
percentage of molybdenum ion extraction (Table 3). x1, x2,
x3 and x4 are the independent variables or the experimental
factors. The linear coefficients a1-a4 express the linear effect
of each variable; a11, a22, a33 and a44 coefficients express
the quadratic effects; a12-a14, a23-a24 and a34, coefficients
express interactive effects between the variables and a0 is a
constant corresponding to the central point of experimental variables. The statistical design, data analysis and various plots were obtained by using Minitab statistical software.
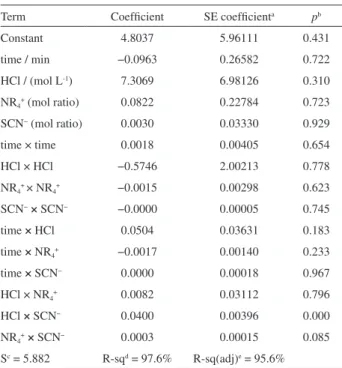
The coefficients of the empirical model equation 1 and their statistical characteristics were evaluated (Table 5).
The estimated value of the determination coefficient
(R2), expressed as a percentage, indicates that the model
fits 97.6% of the experimental raw data. The quality of the regression, estimated by the analysis of variance (ANOVA), is shown in Table 6. If the model were a strong predictor of the experimental data, the computed F-value would be
higher than the tabular F-value. Generally, the p-levels can
be used as a tool to check the significance of each of the regression coefficients. This information is necessary to explain the correlation of the mutual interaction between
the factors. The smaller the magnitude of the p, the more
significant is the corresponding coefficient. The p-values
in Table 6 reveal that one of the interaction terms in model (equation 4) at the 95% confidence level is significant
(p < 0.05), while all of the linear, square terms and the
remaining of the interaction terms are not significant
(p > 0.05). This matter is a confirmation being necessity for
a significant correction regarding the number of terms in the model equation 1 and must be regards as ignored terms.
Table 6 also shows that, in the model obtained with total terms, “lack of fit F-value” (= 0.031) is also significant with correction regarding the number of terms in model
equation 4, when eliminated from time, NR4+ and square
term, as well as the obtained ANOVA table (Table 7) show an improvement in “lack of fit F-value” (= 0.063).
A point of maximum response could visually be determined from Figure 6. As demonstrated, the maximum point on the response surfaces has been located in the following values of variables: concentration of Table 3. The experimental variables and levels of the FCCD (face central
composite design)
Factor Level
Low Center High
A: time / min 0.0 30.0 60.0
B: HCl / (mol L-1) 0.3 1.65 3.0
C: NR4+ (mol ratio) 0.0 35.0 70.0
D: SCN– (mol ratio) 50.0 325.0 600.0
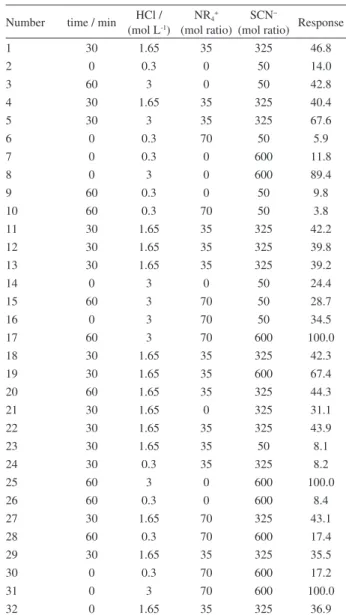
Table 4. Design table showing the randomized run order of the experiment, and the uncoded values of the different variables in the experimental design for the determination of the modeled response (equation 4)
Number time / min HCl / (mol L-1)
NR4+
(mol ratio) SCN−
(mol ratio) Response
1 30 1.65 35 325 46.8
2 0 0.3 0 50 14.0
3 60 3 0 50 42.8
4 30 1.65 35 325 40.4
5 30 3 35 325 67.6
6 0 0.3 70 50 5.9
7 0 0.3 0 600 11.8
8 0 3 0 600 89.4
9 60 0.3 0 50 9.8
10 60 0.3 70 50 3.8
11 30 1.65 35 325 42.2
12 30 1.65 35 325 39.8
13 30 1.65 35 325 39.2
14 0 3 0 50 24.4
15 60 3 70 50 28.7
16 0 3 70 50 34.5
17 60 3 70 600 100.0
18 30 1.65 35 325 42.3
19 30 1.65 35 600 67.4
20 60 1.65 35 325 44.3
21 30 1.65 0 325 31.1
22 30 1.65 35 325 43.9
23 30 1.65 35 50 8.1
24 30 0.3 35 325 8.2
25 60 3 0 600 100.0
26 60 0.3 0 600 8.4
27 30 1.65 70 325 43.1
28 60 0.3 70 600 17.4
29 30 1.65 35 325 35.5
30 0 0.3 70 600 17.2
31 0 3 70 600 100.0
Table 5. Estimated regression coefficients for the quadratic response (equation 4)
Term Coefficient SE coefficienta pb
Constant 4.8037 5.96111 0.431
time / min −0.0963 0.26582 0.722
HCl / (mol L-1) 7.3069 6.98126 0.310
NR4+ (mol ratio) 0.0822 0.22784 0.723
SCN− (mol ratio) 0.0030 0.03330 0.929
time × time 0.0018 0.00405 0.654
HCl × HCl −0.5746 2.00213 0.778
NR4+ × NR4+ −0.0015 0.00298 0.623
SCN− × SCN− −0.0000 0.00005 0.745
time × HCl 0.0504 0.03631 0.183
time × NR4+ −0.0017 0.00140 0.233
time × SCN− 0.0000 0.00018 0.967
HCl × NR4+ 0.0082 0.03112 0.796
HCl × SCN− 0.0400 0.00396 0.000
NR4+ × SCN− 0.0003 0.00015 0.085
Sc = 5.882 R-sqd = 97.6% R-sq(adj)e = 95.6%
aSE coefficient: standard error of coefficient; bp: statistical parameter; cS: standard deviation; dR-sq: regression-squared; eR-sq(adj):
regression-squared adjusted.
Table 6. Analysis of variance for the quadratic response (equation 4)
Source DFa Seq. SSb Adj. SSc Adj. MSd Fe pf
Regression 14 23673.1 23673.14 160.94 48.87 0.000
Linear 4 19854.9 63.74 15.94 0.46 0.764
Square 4 51.7 51.69 12.92 0.37 0.824
Interaction 6 3766.5 3766.53 627.76 18.14 0.000
Residual error 17 588.2 588.21 34.60
Lack-of-fit 10 507.3 507.34 50.73 4.39 0.031
Pure error 7 80.9 80.87 11.55
Total 31 25261.4
aDF: Degrees of freedom; bSeq. SS: sequential sum of squares; cAdj. SS: adjusted sum of squares; dAdj. MS: adjusted mean squares = Adj. SS / DF; eF: F-value is calculated with: Adj. MS for any parameter to Adj. MS of residual error; fp: statistical parameter.
Table 7. Analysis of variance for the quadratic response (equation 4)
Source DFa Seq. SSb Adj. SSc Adj. MSd Fe pf
Regression 3 23338.2 23338.2 7779.41 235.96 0.000
Linear 2 19809.6 983.8 491.90 14.92 0.000
Interaction 1 3528.7 3528.7 3528.66 107.03 0.000
Residual error 28 923.1 923.1 32.97
Lack-of-fit 5 321.8 321.8 64.36 2.46 0.063
Pure error 23 601.3 601.3 26.14
Total 31 24261.4
aDF: Degrees of freedom; bSeq. SS: sequential sum of squares; cAdj. SS: adjusted sum of squares; dAdj. MS: adjusted mean squares = Adj. SS / DF; eF: F-value is calculated with: Adj. MS for any parameter to Adj. MS of residual error; fp: statistical parameter.
HCl = 3 mol L-1 and 600 moles of SCN− equivalent of each
Mo mole. According to the results of OVAT tests, 70 moles
of NR4+ equivalent of each Mo mole is needed to ensure
complete extraction of MoVI.
Test of optimized extraction
The SPE columns were packed with 20 mg of IIP and
NIP. 20 mL HCl solution (3 mol L-1) containing MoVI
(0.25 mg L-1), 600 moles of SCN− and 70 moles of NR
solution and eluent were passed through the column at
flow rate of 1.5 mL min-1. Their content in the eluent were
determined by ICP (Table 8).
Loading capacity
The loading capacity is an important factor to evaluate the IIPs. In order to investigate the adsorption capacity of molybdenum on the imprinted polymer particles, 200 mg of polymer particles was packed in a column and a solution of molybdenum under the optimum conditions was passed through the column. The adsorption capacity of the
imprinted sorbent calculated was 3.77 mg g-1.
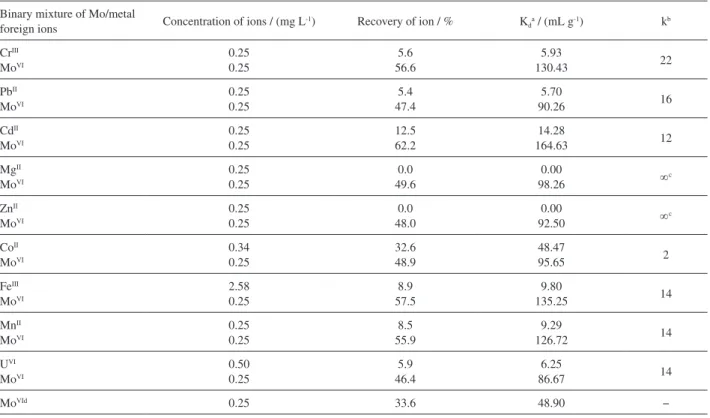
Selectivity studies
The selectivity coefficient (k) is an indicator to express
an adsorption affinity of recognition sites for MoVI.
Competitive adsorptions of Mo/metal foreign ions in binary mixture solutions were also investigated in column
studies. Table 9 summarizes Kd and k values for metal
ions of interest with respect to MoVI. All of the cations
examined did not interfere with the extraction of MoVI.
Since the chloride and nitrate salts employed in this study were without any interference. One important result is that Mo is separated from uranium with the IIP. This feature can be used for Mo remove from uranium in the production process of nuclear fuel.
Breakthrough volume study
As may be known, breakthrough volume is sample volume that adsorption of analyte is completely performed. To find out breakthrough volume, different volumes (20, 35, 40, 50, 100, 200, 250 and 350 mL) of solution
HCl 3 mol L-1 containing 20 µg MoVI and 600 moles of
SCN and 70 moles of NR4+ equivalent of each mole of
Mo were passed through the IIP (200 mg) column at the
flow rate 1.5 mL min-1. Elution of the SPE column was
performed with 10 mL of distilled water at the flow rate
1.5 mL min-1. As shown in Figure 7, the recovery value of
molybdenum(VI) was quantitative (> 95%) in the sample volume range of 20-35 mL.
Table 8. Distributions coefficients of IIP and NIP for MoVI ions under
optimum conditions
Sorbent Kd /(mL g
-1)
MoVI
IIP 48.90
NIP 2.32
Kd: D i s t r i bu t i o n c o e ffi c i e n t ; I I P : i o n - i m p r i n t e d p o l y m e r ;
NIP: non-imprinted polymer.
Table 9. Selectivity parameters (Kd and k) and recovery of 0.25 mg L-1 MoVI from aqueous binary mixture of Mo/metal ions solution by the IIP polymer
Binary mixture of Mo/metal
foreign ions Concentration of ions / (mg L
-1) Recovery of ion / % K
da / (mL g-1) kb
CrIII
MoVI
0.25 0.25
5.6 56.6
5.93
130.43 22
PbII
MoVI
0.25 0.25
5.4 47.4
5.70
90.26 16
CdII
MoVI
0.25 0.25
12.5 62.2
14.28
164.63 12
MgII
MoVI
0.25 0.25
0.0 49.6
0.00
98.26 ∞c
ZnII
MoVI
0.25 0.25
0.0 48.0
0.00
92.50 ∞c
CoII
MoVI
0.34 0.25
32.6 48.9
48.47
95.65 2
FeIII
MoVI
2.58 0.25
8.9 57.5
9.80
135.25 14
MnII
MoVI
0.25 0.25
8.5 55.9
9.29
126.72 14
UVI
MoVI
0.50 0.25
5.9 46.4
6.25
86.67 14
MoVId 0.25 33.6 48.90 −
aK
Analytical performance of the method
In order to evaluate the analytical applicability of the polymer particles, SPE method was applied to the extraction and determination of Mo in real water samples. The linearity of the method was evaluated utilizing standard samples at six different concentration levels of molybdenum ions from
10 to 1000 µg L-1. A good linearity with squared correlation
coefficient (r2) 0.999 was obtained for calibration curve.
Three determination replicates of 500 µg L-1 molybdenum
solutions resulted in a relative standard deviation of 4.6%. The limits of detection (LODs) were calculated as the analytes concentration three times the standard deviation of the blank signal, after solid phase extraction of six blank sample with average intensity 10.7 in ICP-AES,
divided by the slope of calibration curve (8.66 µg L-1). The
enhancement factor, which was calculated from ratio of the slopes of calibration curves obtained with and without solid phase preconcentration method is 2.89 (the linearity of the calibration curve without preconcentration was
200-1000 µg L-1). Tap water and Anzali lake water were
tested to check the possible matrix effects and investigate the applicability of the method for real sample analysis. 72 h after sampling in polyethylene containers, the sample was filtered with filter paper (0.45 micron). The samples were divided into three aliquots and the analysis was carried out under the optimal conditions (Table 10). Since no Mo was found in the sample, the water samples were
spiked with the Mo (300 µg L-1) to determine the relative
recoveries of developed method. These results indicated
the ability of the MoVI-imprinted polymer for selective
SPE and determination of MoVI in environmental water
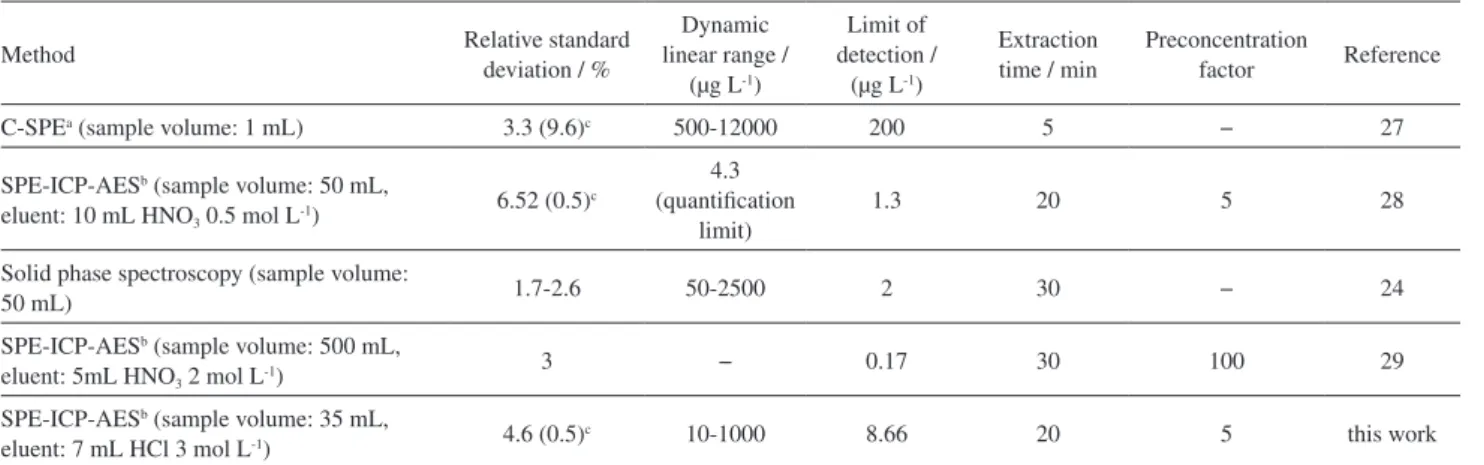
samples. A comparison between the proposed method and other SPE methods for the extraction and determination of Mo is presented in Table 11. The proposed method has a quantification limit is much less than references 24 and 27. Moreover, the preconcentration factor is equal with reference 28 but is less than reference 29.
Conclusions
In the present study, MoVI ions imprinted polymers was
synthesized by thermal copolymerization of methacrylic
acid and ethylene glycol dimethacrylate. For MoVI-IIP
synthesis the ion pair between (MoVI-SCN–) and NR
4+ was
0 20 40 60 80 100
20 35 40 50 100 200 250 350
Reco
ver
y /
%
Volume of sample / mL
Figure 7. Effect of breakthrough volume on the adsorption of MoVI on
the IIP particles.
Table 10. Determination of molybdenum ions in real water samples
Sample
Molybdenum concentration added / (µg L-1)
Molybdenum concentration found / (µg L-1)
Recovery / %
Anzali lake 0.0 not detected −
Anzali lake 300.0 298.8 (± 3.9)a 99.6
Tap water 300.0 274.9 (± 4.3)a 91.6
aRSD: relative standard deviation.
Table 11. Comparison of the proposed method with other methods for MoVI determination in water samples
Method Relative standard
deviation / %
Dynamic linear range /
(µg L-1)
Limit of detection /
(µg L-1)
Extraction time / min
Preconcentration
factor Reference
C-SPEa (sample volume: 1 mL) 3.3 (9.6)c 500-12000 200 5 − 27
SPE-ICP-AESb (sample volume: 50 mL,
eluent: 10 mL HNO3 0.5 mol L-1)
6.52 (0.5)c
4.3 (quantification
limit)
1.3 20 5 28
Solid phase spectroscopy (sample volume:
50 mL) 1.7-2.6 50-2500 2 30 − 24
SPE-ICP-AESb (sample volume: 500 mL,
eluent: 5mL HNO3 2 mol L-1)
3 − 0.17 30 100 29
SPE-ICP-AESb (sample volume: 35 mL,
eluent: 7 mL HCl 3 mol L-1) 4.6 (0.5)c 10-1000 8.66 20 5 this work
aC-SPE: Colorimetric solid phase extraction; bSPE-ICP-AES: solid phase extraction-inductively coupled plasma- atomic emission spectrometry; cRSD
precipitated into aqueous sample and was dissolved into the acetonitrile as a porogen. Various parameters affecting the adsorption of Mo with polymer particles were evaluated and the best conditions for adsorption were found. The
selectivity factor of polymer particles for MoVI relative
to CrIII, PbII, CdII, MgII, ZnII, CoII, FeIII, MnII and UVI was
determined. Due to the high selectivity shown by this new material toward molybdenum ions, it has been successfully employed for the selective separation and preconcentration of molybdenum ions from aqueous systems. In addition, the synthesized Mo-IIP is highly recommended for removing and separating Mo ions from uranium ions.
Acknowledgments
Financial support by Nuclear Fuel Cycle Research
School, Nuclear Science & TechnologyResearch Institute
(Tehran, Iran) during the period of this research is gratefully acknowledged.
References
1. Du, J. X.; Li, J. J.; Yang, L. J.; Lu, J. R.; Anal. Chim. Acta 2003, 481, 239.
2. Wang, D.; Aller, R. C.; Sanudo-Wilhelmyc, S. A.; Mar. Chem. 2009, 113, 250.
3. Schindelin, H.; Kisker, C.; Hilton, J.; Rajagopalan, K. V.; Rees, D. C.; Science 1996, 272, 1615.
4. Llamas, A.; Tejada-Jimenez, M.; Fernandez, E.; Galvan, A.; Metallomics2011, 3, 578.
5. Marczenko, Z.; Lobinski, R.; Pure Appl. Chem. 1991, 63, 1627. 6. Haupt, K.; Mosbach, K.; Chem. Rev.2000, 100, 2495. 7. Shea, K. J.; Trends Polym. Sci.1994, 2, 166. 8. Wulff, G.; Angew Chem., Int. Ed.1995, 34, 1812.
9. Takeuchi, T.; Haginaka, J.; J. Chromatogr. B: Biomed. Sci. Appl. 1999, 728, 1.
10. Segatelli, M. G.; Santos, V. S.; Presotto, A. B. T.; Yoshide, I. V. P.; Tarley, C. R. T.; React. Funct. Polym. 2010, 70, 325. 11. Dekova, I.; Karadjova, I.; Ivanov, I.; Georgieva, V.; Eutimova, B.;
Georgiev, G.; Anal. Chim. Acta 2007, 584, 196.
12. Birlik, E.; Ersz, A.; Denizli, A.; Say, R.; Anal. Chim. Acta2006, 565, 145.
13. Chang, X.; Jiang, N.; Zheng, H.; He, Q.; Hu, Z.; Zhai, Y.; Cui, Y.; Talanta2007, 71, 38.
14. Mages, A. G.; Whitcombe, M. J.; Adv. Drug Delivery Rev.2005, 57, 1742.
15. Dakova, I.; Karadjova, I.; Georgieva, V. S.; Geargiev, G.; Talanta 2009, 78, 523.
16. Hande, P. E.; Samui, A. B.; Kulkarni, P. S.; Environ. Sci. Pollut. Res. 2015, 22, 7375.
17. Fu, J.; Chen, L.; Li, J.; Zhang, Z.; J. Mater. Chem. A 2015, 3, 13598.
18. Shirvani-Arani, S.; Ahmadi, J.; Bahrami-Samani, A.; Ghannadi-Maragheh, M.; Anal. Chim. Acta2008, 623, 82.
19. Shakerian, F.; Dadfarnia, S.; Haji Shabani, A. M.; Food Chem. 2012, 134, 488.
20. Arab-zavar, M. H.; Chamsaz, M.; Zohuri, G.; J. Hazard. Mater. 2011, 185, 38.
21. Ren, Y.; Liu, P.; Ma, J.; Wen, Q.; Zhang, M.; Chem. Eng. J. 2013, 219, 286.
22. Saraji, M.; Yousefi, H.; J. Hazard. Mater.2009, 167, 1152. 23. Andac, M.; Say, R.; Denizli, A.; J. Chromatogr. B: Anal.
Technol. Biomed. Life Sci. 2004, 811, 119.
24. Kononova, O. N.; Kachin, S. V.; Chaikovskaya, A. E.; Kholmogorov, A. G.; Kalyakina, O. P.; Turk. J. Chem. 2004, 28, 193.
25. Deyhimi, F.; Arabieh, M.; Parvin, L.; Biocatal. Biotransform. 2006, 24, 263.
26. Deyhimi, F.; Ahangari, R. S.; Arabieh, M.; Parvin, L.; Int. J. Environ. Anal. Chem.2006, 86, 1151.
27. Hayati, F.; Aksu, D.; Apak, R.; Boz, I.; Sens. Actuators, B 2009, 141, 491.
28. Kalal, H. S.; Panahi, H. A.; Framarzi, N.; Moniri, E.; Naeemy, A.; Hoveidi, H.; Abhari, A.; Int. J. Environ. Sci. Technol. 2011, 8, 501.
29. Jimmy, C. Y.; Chan, S. M.; Chen, Z.; Anal. Bioanal. Chem. 2003, 376, 728.
Submitted: September 17, 2015