SPATIO-TEMPORAL VARIATIONS OF MICROPHYTOBENTHOS IN THE
BOTAFOGO AND SIRI ESTUARIES (NORTHEAST - BRAZIL)
Priscila Porchat de Assis Murolo1*, Paulo Vladmir Vandenberg da Costa Carvalho1, Monica Lucia Botter Carvalho2, Lilia Pereira de Souza-Santos2 & Paulo Jorge Parreira dos Santos1
1
Universidade Federal de Pernambuco
Centro de Ciências Biológicas, Departamento de Zoologia (Av. Professor Moraes Rego, s/n, 50670-420 Recife, PE, Brasil)
2
Universidade Federal de Pernambuco
Centro de Tecnologia e Geociências, Departamento de Oceanografia (Av. Arquitetura, s/n, 50740-550 Recife, PE, Brasil)
A
B S T R A C TSpatio-temporal variations of microphytobenthic biomass were investigated in the Botafogo and Siri estuaries, Pernambuco - Brazil. Samples were taken during low water (bi-monthly) from February to December, 2003. Three sampling stations were located in each estuary, in both midlittoral and sublittoral areas. Clear spatial and temporal variations were found for both chlorophyll-a and phaeopigment concentrations. In Botafogo, chlorophyll-a had 34% of total variation explained by MRA from nitrogen and phosphorus concentrations, while only 16% of total variation was thus explained from nitrogen concentration in the Siri estuary. Phaeopigments had 39% of total variation explained by MRA from nitrogen concentration and salinity in the Botafogo estuary and 58% of total variation was similarly explained from nitrogen concentration in the Siri estuary. Nitrogen was discriminated by the β coefficients as the most important factor in the explanation of the microphytobenthic pigments variations in the Botafogo estuary. The data of this study emphasize the role of nutrients and suggest that both estuaries show evidence of eutrophication.
R
E S U M OVariações espaço-temporais da biomassa do microfitobentos foram investigadas nos estuários dos rios Botafogo e Siri em Pernambuco, Brasil. As amostragens foram realizadas em baixa-mar (bimestralmente) de fevereiro a dezembro de 2003. Em cada estuário foram determinadas três estações de amostragem no médio- e no infralitoral. Fortes variações espaciais e temporais foram verificadas nas concentrações tanto de clorofila-a como de feopigmentos. No estuário do Botafogo, a clorofila-a teve 34% do total da sua variação explicada pela análise de regressão múltipla (MRA) baseada nas concentrações de nitrogênio e de fósforo, enquanto no estuário do Siri somente 16% dessa variação foi explicada pela MRA baseada na concentração de nitrogênio. Feopigmentos apresentou 39% de sua variação total explicada pela MRA baseada na concentração de nitrogênio e na salinidade no estuário do Botafogo; enquanto no Siri a MRA explicou 58% da variação total baseada somente na concentração de nitrogênio. Nitrogênio foi discriminado como o fator mais importante para explicar as variações do microfitobentos no estuário do rio Botafogo. Os resultados do presente trabalho ressaltam o papel dos nutrientes e sugerem que ambos estuários apresentam evidências de eutrofização.
Descriptors: microphytobenthos; chlorophyll-a; phaeopigments; biomass; nutrients.
Descritores:microfitobentos; clorofila-a; feopigmentos; biomassa; nutrientes.
I
NTRODUCTIONMicrophytobenthos are unicellular algae, mainly consisting of diatoms (Colijn & Dijkema, 1981). As they are dependent on photosynthesis for growing, the active cells are confined to the upper few millimeters of the sediment, the “photosyntetically
active” layer. However, they are found in substantial quantities to depths of 10 cm and more in the sediment, due to active migration (Cadée & Hegeman, 1974), hydrodynamic forces and bioturbation (Cadée, 1976).
pointed out its relevance to primary productivity of coastal ecosystems. Benthic microalgae are important primary producers (Colijn & De Jonge, 1984) and the main ones of many estuaries (McIntyre & Cullen, 1995). Therefore, they play a key role in the food web of shallow aquatic ecosystems (Gould & Gallagher, 1990), controlling the oxygen balance at the water-sediment interface (Davis & McIntyre, 1983), allowing the aerobic degradation of autochthonous and sedimented organic matter in sediments (Barranguet, 1997), regulating flux and input of new organic matter (Sullivan & Montcreiff, 1988) and releasing of nutrients from the sediments to the water column (Shaffer & Onuf, 1983). As a producer of new organic matter that may enter either the benthic or the pelagic trophic web, microphytobenthos is a key component of the carbon cycle in estuarine environments (Barranguet, 1997), being a significant food source for zoobenthos (Jong et al., 1994). Their contribution may account for up to one third of the total carbon fixation in an estuary (Sullivan & Montcreiff, 1988).
Spatial and temporal patterns of the composition and abundance of microphytobenthos are largely controlled by the interactions between light, nutrient availability and grazing pressure (Bianchi & Rice, 1988). The presence of a turbidity maximum in meso- and macrotidal estuaries affects many of the biological processes in the water column. On the basis of classical food chains, primary producers are the first biological compartment influenced by turbidity. The limitation of light penetration by turbidity has been frequently signaled as a factor controlling primary production in estuaries (Lehman, 1992). Among the factors affecting spatial distribution, biotic ones are seldom or never mentioned as relevant. From the set of abiotic parameters generally examined, sediment type is positively correlated with chlorophyll-a content of the surface sediment in a number of studies (Colijn & Dijkema, 1981; Davis & McIntyre, 1983) and tidal height is also mentioned as a positive factor by Davis & McIntyre (1983).
Conclusions from temporal studies are not in agreement. For similar intertidal ecosystems, some authors refer to the presence of a clear seasonal trend with biomass maxima in spring-summer (Colijn & Dijkema, 1981) or spring and autumn (Davis & McIntyre, 1983), whereas others point out its absence (Cadée & Hegeman, 1974). However, most of the studies have been based on monthly, sometimes bi-weekly, sampling schedules. The high variation of chlorophyll-a and phaeopigments from week to week as compared to the annual variation makes the determination of seasonal cycles based on monthly sampling a matter of chance (Santos, et al., 1997). Cause-effect relationships are difficult to establish, due to the great variations encountered among the biological data. Nevertheless, irradiance at the surface
of sediments, although estimated from different assumptions, is frequently referred to as a positive parameter (Colijn & de Jonge, 1984), with temperature (Colijn & de Jonge, 1984) and desiccation (Holmes & Mahall, 1982) being other parameters recognized as relevant. Nutrient content in the sediments is generally not considered to exercise any effect (Davis & McIntyre, 1983).
Microphytobenthos researches are scarce in Pernambuco, some works include those of Moura et al. (1993; 1995) and Oliveira et al. (2000). Several works have been accomplished in São Paulo but most of them focus on sandy beach microphytobenthos (Sousa, 1983; Sousa & Corbisier, 1994; David & Sousa, 1996; Corbisier et al., 1997; Sousa et al., 1998; David et al., 2003). The main objectives of the present research were: (1) to describe and compare spatial and temporal variations of microphytobenthic biomass in the Botafogo and Siri estuaries and (2) to identify the main factors related to the variations observed.
M
ATERIALS ANDM
ETHODSStudy Area
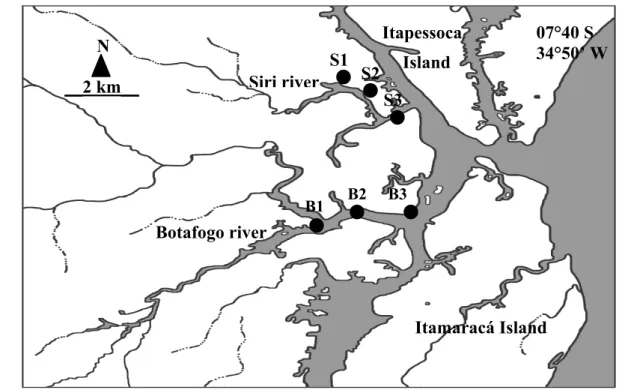
Botafogo (7°39’S; 34°51’W) and Siri estuaries (7°43’S; 34°53’W) are located in Pernambuco, on the northeastern coast of Brazil(Fig. 1). Both are part of an estuarine system near Itamaracá Island that presents ecological importance demonstrated by its high primary and secondary production, intensive fisheries and the presence of favorable sites for aquaculture.
Botafogo estuary has extensive “wetland” areas, most of them having been used for the construction of shrimp (especially Litopenaeus vannamei) farms. Shrimp farm effluents are released into this estuary without any assessment of environmental sustainability. Netuno, the second aquaculture undertaking in extension, is located on Botafogo River and a discharge point of shrimp farm effluent is situated near the sampled station 2 (B2) in this estuary. Concerning the Siri estuary, it was chosen because of its hydrological similarities to Botafogo.
Sampling
All stations were sampled for microphytobenthic pigment concentrations, percentage of silt and clay, nitrogen and phosphorus
concentrations and organic matter content. Water salinity, temperature, pH, dissolved oxygen, Eh values and turbidity were also measured.
Fig. 1. Map of study area showing the stations sampled in the Botafogo (B1, B2 and B3) and Siri (S1, S2 and S3) estuaries (Northeastern Brazil).
Three replicates were taken at each station to a depth of 2 cm for microphytobenthos using a 1.13 cm2 corer. For organic matter content (three replicates) and nitrogen and phosphorus concentrations (one replicate) samples were taken at each station to a depth of 5 cm using a 20 cm2 corer. The difference between microphytobenthic and nutrients corer sizes may be justified as these samplings are part of an integrated project in which other benthic compartments were also sampled at different deeper depths. Consideration was given to possible fortuitous problems related to the different depths; but the results observed for organic matter in both estuaries in different the strata, 0-2 cm and 2-5 cm, showed differences of less than 10 % (8.2 % and 9.4 % for the Botafogo and Siri estuaries respectively) and this pattern is also expected for the nutrients. Organic matter content was determined in accordance with Wetzel & Likens (1990). Total nitrogen concentration was measured by the Kjeldahl method with results expressed in g/kg while total phosphorus concentration was measured by the Mhelich method with results expressed in mg/kg. For silt and clay content of sediment (three replicates) samples were taken at each station to a depth of 10 cm
using a 22.9 cm2 corer. Silt and clay content was determined in accordance with Suguio (1973) as the percentage (weight/weight) of sedimentary fraction smaller than 63µ. Microphytobenthic samples were stored, frozen, in the dark at –20°C. Pigments were extracted with 15 ml of acetone (100 %) for 18h in the dark at 5°C. Chlorophyll-a and phaeopigments were determined spectrophotometrically using the equations of Lorenzen (1967). Values of chlorophyll-a and phaeopigments were expressed in µg/cm2.
Statistics
.Multifactor Analysis of Variance was used to test spatio-temporal variations of chlorophyll-a and phaeopigments concentrations while Stepwise Multiple Regression Analysis (MRA) was used to determine the most important factors which explain standing crops of microphytobenthos (p<0.05 was taken as the necessary level of significance for the inclusion of variables in the MRA). For the MRA, independent variables were included both with and without natural logarithmic (ln) transformations to account for eventual non-linear relationships. Before parametric analysis, variable or residual normality
N
__2 km__
Siri river
S1
S2
S3
Itapessoca
Island
07°40 S
34°50’ W
Itamaracá Island
Botafogo river
B1
B2
B3
were verified and, when necessary, the variables were transformed.
R
ESULTSHydrological and Sedimentological Parameters
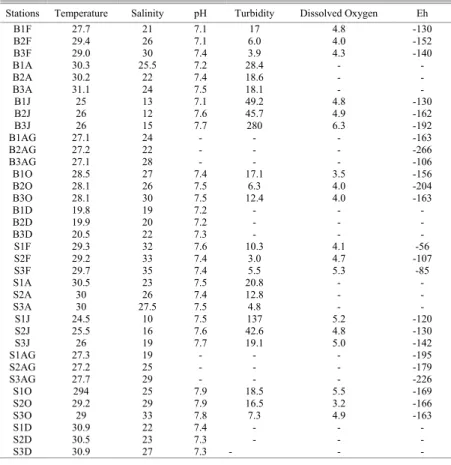
Hydrological parameters showed no clear pattern. Temperature varied between 19.8°C (December) and 31.1°C (April), salinity between 10 PSU (June - probably because of high pluviosity) and 35 PSU (February), and pH values from 7.1 to 7.9. The highest turbidity value (280 NTU) occurred at Botafogo station 3 in June while the lowest (3 NTU) was registered at Siri station 2 in February. Dissolved oxygen values varied from 3.5 mg/L to 6.3 mg/L in the Botafogo estuary and from 3.2 mg/L to 5.5 mg/L in the Siri estuary. Eh sediment values were usually under –100 mV, except for stations 1 and 3 of Siri estuary in February; and varied from –266 mV at station 2 of the Botafogo estuary in August to –56 mV at station 1 of the Siri estuary in February (Table 1).
Both the Botafogo and Siri estuaries presented high C/N ratios, except for station 3 in the midlittoral area of Siri estuary in February. There were no significant differences either between the midlittoral and sublittoral areas or between the estuaries. The lowest and highest C/N ratios observed were 2.5 (midlittoral) and 40 (sublittoral) at station 3 of the Siri estuary in February and December, respectively (Table 2).
Average values of silt and clay content were higher at the midlittoral stations than at the sublittoral ones. Exceptions to this were stations 3 (June, August and December) and 2 (August) in the Botafogo estuary and station 2 (June, October and December) in the Siri estuary (Fig. 2).The highest value (91.63%) occurred at station 1 in the midlittoral area of the Botafogo estuary (February) while the lowest (6.56%) was verified at station 1 in the sublittoral area of the same estuary (October). February and April were similar but quite different from the following months (Fig. 2).
Table 1. Temperature (°C), Salinity (PSU), pH, Turbidity (NTU) and Dissolved Oxygen (mg/L) values of water and Eh (mV) values of sediment in the Botafogo and Siri estuaries (B=Botafogo, S=Siri), (F=February, A=April, J=June AG=August, O=October and D=December), (1, 2 and 3 – stations).
Stations Temperature Salinity pH Turbidity Dissolved Oxygen Eh
B1F 27.7 21 7.1 17 4.8 -130
B2F 29.4 26 7.1 6.0 4.0 -152
B3F 29.0 30 7.4 3.9 4.3 -140
B1A 30.3 25.5 7.2 28.4 - -
B2A 30.2 22 7.4 18.6 - -
B3A 31.1 24 7.5 18.1 - -
B1J 25 13 7.1 49.2 4.8 -130
B2J 26 12 7.6 45.7 4.9 -162
B3J 26 15 7.7 280 6.3 -192
B1AG 27.1 24 - - - -163
B2AG 27.2 22 - - - -266
B3AG 27.1 28 - - - -106
B1O 28.5 27 7.4 17.1 3.5 -156 B2O 28.1 26 7.5 6.3 4.0 -204 B3O 28.1 30 7.5 12.4 4.0 -163
B1D 19.8 19 7.2 - - -
B2D 19.9 20 7.2 - - -
B3D 20.5 22 7.3 - - -
S1F 29.3 32 7.6 10.3 4.1 -56
S2F 29.2 33 7.4 3.0 4.7 -107
S3F 29.7 35 7.4 5.5 5.3 -85
S1A 30.5 23 7.5 20.8 - -
S2A 30 26 7.4 12.8 - -
S3A 30 27.5 7.5 4.8 - -
S1J 24.5 10 7.5 137 5.2 -120
S2J 25.5 16 7.6 42.6 4.8 -130
S3J 26 19 7.7 19.1 5.0 -142
S1AG 27.3 19 - - - -195
S2AG 27.2 25 - - - -179
S3AG 27.7 29 - - - -226
S1O 294 25 7.9 18.5 5.5 -169
S2O 29.2 29 7.9 16.5 3.2 -166
S3O 29 33 7.8 7.3 4.9 -163
S1D 30.9 22 7.4 - - -
S2D 30.5 23 7.3 - - -
Table 2. Organic Matter (%) and C/N ratios in the Botafogo and Siri estuaries (B=Botafogo,; S=Siri), (F=February, AG=August, O=October and D=December), (1, 2 and 3 – stations).
MIDLITTORAL SUBLITTORAL STATIONS
Organic Matter (%) C/N Ratio Organic Matter (%) C/N Ratio
B1F 18 16.5 8.5 22.5
B2F 14 19.5 7.0 27
B3F 12 16.5 9.5 18
BJ 15 18 10.5 20
B2J 15 20 15 16
B3J 7 22 7.5 12.5
B1AG 15 18 9 16
B2AG 14 14 17 10.5
B3AG 11 6.5 8 16
B1O 15.5 16 4.5 9.5
B2O 15 17 14.5 19
B3O 8 15 7.0 16
B1D 17.5 21 5.5 10
B2D 16.5 20 16.5 16
B3D 15 20 13 20
S1F 8 21 7.5 25
S2F 15 16 14 19
S3F 4 2.5 2.5 23
S1J 14 17 7 10
S2J 12 23 18 31
S3J 5 17 4.5 17
S1AG 14 14 9 20
S2AG 15 14 14 14
S3AG 8 20 4 14
S1O 12 15 14 17
S2O 10 13 11.5 11
S3O 8 26 3.5 8
S1D 14.5 21 11.5 19
S2D 16 23 18.5 36
S3D 7 23 4 40
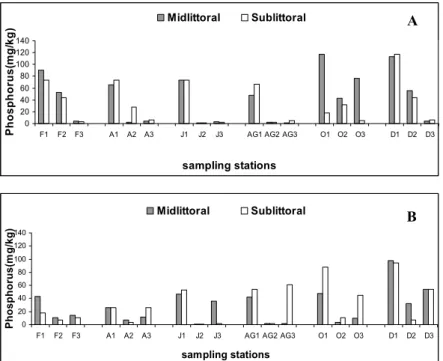
Generally, values of nitrogen concentration were higher in the Botafogo estuary than in the Siri estuary. Values varied from 1 to 8.5 g/kg and from 0.5 to 5.6g/kg in the Botafogo and Siri estuaries, respectively. Midlittoral and sublittoral values were similar in each estuary (Fig. 3). Phosphorus concentration varied between 1 and 117 mg/kg and from 1 to 98 in the Botafogo and Siri estuaries, respectively. Station 1 presented the higher values as compared to those of other stations in both estuaries (Fig. 4).
Chlorophyll-a and Phaeopigments
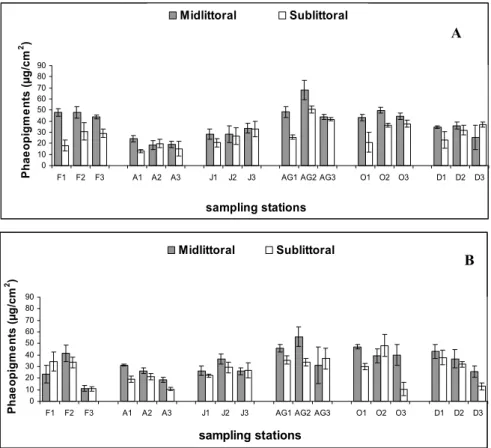
Chlorophyll-a and phaeopigments average concentrations were clearly higher on the midlittoral than on sublittoral stations. Both estuaries had their lower pigment concentrations in April while the higher occurred in August (Fig. 5).
Botafogo estuary had chlorophyll-a concentrations varying between 3 and 23.5 µg/cm2 while in Siri values varied from 3 to 20 µg/cm2 (Fig. 5). Concerning phaeopigments, concentrations varied
from 13 to 68 µg/cm2 and from 10.5 to 48.5 µg/cm2 in the Botafogo and Siri estuaries, respectively (Fig. 6).
Fig. 2. Average values of silt-clay (%) for midlittoral and sublittoral stations in the Botafogo (A) and Siri (B) estuaries (bars represent Standard Deviation), (F= February, A= April, J= June, AG= August, O= October and D= December; 1, 2 and 3 – stations).
Fig. 3.Values of nitrogen concentration (g/kg) for midlittoral and sublittoral stations in the Botafogo (A) and Siri (B)estuaries (F= February, A= April, J= June, AG= August, O= October and D= December; 1, 2 and 3 –stations sampled).
0 20 40 60 80 100
F1 F2 F3 A1 A2 A3 J1 J2 J3 AG1 AG2 AG3 O1 O2 O3 D1 D2 D3
sampling stations
S
ilt
-C
la
y
(
%
)
Midlittoral Sublittoral
0 20 40 60 80 100
F1 F2 F3 A1 A2 A3 J1 J2 J3 AG1 AG2 AG3 O1 O2 O3 D1 D2 D3
sampling stations
S
ilt-C
la
y
(
%
)
Midlittoral Sublittoral
0 2 4 6 8 10
F1 F2 F3 A1 A2 A3 J1 J2 J3 AG1 AG2 AG3 O1 O2 O3 D1 D2 D3
sampling stations
N
itr
o
g
e
n
(g
/k
g
)
Midlittoral Sublittoral
0 1 2 3 4 5 6
F1 F2 F3 A1 A2 A3 J1 J2 J3 AG1 AG2 AG3 O1 O2 O3 D1 D2 D3
sampling stations
N
it
roge
n (
g/
k
g)
Midlittoral Sublittoral
c
A
B
A
Fig. 4.Values of phosphorus concentration (mg/kg) for midlittoral and sublittoral stations in the Botafogo (A) and Siri (B) estuaries (F= February, A= April, J= June, AG= August, O= October and D= December; 1, 2 and 3 – stations sampled).
Fig. 5. Average values of chlorophyll-a concentration (µg/cm2) for midlittoral and sublittoral stations in the Botafogo (A) and Siri (B) estuaries (bars represent Standard Deviation), ( F= February, A= April, J= June, AG= August, O= October and D= December; 1, 2 and 3 – stations sampled).
0 20 40 60 80 100 120 140
F1 F2 F3 A1 A2 A3 J1 J2 J3 AG1 AG2 AG3 O1 O2 O3 D1 D2 D3
sampling stations
Phos
ph
or
u
s
(m
g/
k
g
) Midlittoral Sublittoral
0 20 40 60 80 100 120 140
F1 F2 F3 A1 A2 A3 J1 J2 J3 AG1 AG2 AG3 O1 O2 O3 D1 D2 D3
sampling stations
Phos
phorus(
m
g/
kg)
Midlittoral Sublittoral
0 5 10 15 20 25 30
F1 F2 F3 A1 A2 A3 J1 J2 J3 AG1 AG2 AG3 O1 O2 O3 D1 D2 D3
sampling stations
Chl
o
ro
phyl
l (
µ
g/
c
m
2)
Midlittoral Sublittoral
0 5 10 15 20 25 30
F1 F2 F3 A1 A2 A3 J1 J2 J3 AG1 AG2 AG3 O1 O2 O3 D1 D2 D3
sampling stations
Chl
o
ro
phy
ll
(
µ
g/
c
m
2 )
Midlittoral Sublittoral
A
B
A
Fig. 6. Average values of pheaopigments concentration (µg/cm2) for midlittoral and sublittoral stations in the Botafogo (A) and Siri (B) estuaries (bars represent Standard Deviation), (F= February, A= April, J= June, AG= August, O= October and D= December; 1, 2 and 3 – stations sampled).
Concerning phaeopigments concentrations, significant spatio-temporal differences were also found in both estuaries. In the Botafogo estuary, phaeopigments presented significant differences among months (F(5;72)=32.02 and p=0.0000) and between environmental levels (F(1;72)=58.48 and p=0.0000) as well as among the stations sampled (F(2;72)=10.06 and p=0.0001), with interactions between stations and environmental levels (F(2;72)=12.56 and p=0.0000) and among environmental levels and months (F(5;72)=9.11 p=0.0000). Siri estuary also presented significant differences for phaeopigments concentrations among months (F(5;72)=29.06 and p=0.0000), between environmental levels (F(1;72)=42.64 and p=0.0000) and among the stations sampled (F(2;72)=53.50 and p=0.0000) but with interactions among stations and environmental levels (F(2;72)=0.737 and p=0.4820), stations and months (F(10;72)=5.51 and p=0.0000), among environmental levels and months (F(5;72)=3.61 and p=0.0057) and among these three factors together (F(10;72)=5.18 and p=0.0000).
Such observed results for chlorophyll-a and phaeopigments concentrations showed not only a dynamic environment but also the high complexity of these estuaries. In fact, each estuary presents different behavior under the same environmental conditions, as shown by the significant interactions that occurred between each two or even among the three factors studied.
Chlorophyll-a and phaeopigments were modeled by MRA in both estuaries. In Botafogo, chlorophyll-a had 34% of total variation (R2=0.3420) explained by MRA from nitrogen (regression coefficient-RC=1.73 and p=0.0004) and phosphorus (RC=-0.04 and p=0.0364) concentrations, while only 16% of total variation (R2=0.1562) was explained by MRA from nitrogen concentration (RC=1.04 and p=0.0119) in the Siri estuary. However, the β coefficients showed that nitrogen (β=0.53) was more important than phosphorus (β=0.28) in the MRA of the Botafogo estuary. Phaeopigments had 39% of total variation (R2=0.3909) explained by MRA from nitrogen concentration ln-transformed (RC=16.03 and
0 10 20 30 40 50 60 70 80 90
F1 F2 F3 A1 A2 A3 J1 J2 J3 AG1 AG2 AG3 O1 O2 O3 D1 D2 D3
sampling stations
P
h
a
e
op
ig
m
e
nt
s (
µ
g/
cm
2 )
Midlittoral Sublittoral
0 10 20 30 40 50 60 70 80 90
F1 F2 F3 A1 A2 A3 J1 J2 J3 AG1 AG2 AG3 O1 O2 O3 D1 D2 D3
sampling stations
Ph
ae
op
ig
m
e
n
ts (µ
g
/cm
2 )
Midlittoral Sublittoral
A
p=0.0001) and salinity (RC=0.71 and p=0.0281) in the Botafogo estuary and 58% of total variation (R2=0.5811) explained by MRA from nitrogen concentration (RC=14.07 and p=0.0000) in the Siri estuary. According to the β coefficients, nitrogen (β=0.59) was more important than salinity (β=0.30) in explaining phaeopigments variations in the Botafogo estuary.
D
ISCUSSIONComparing the abiotical data obtained during this study with previous data from the Botafogo estuary and Santa Cruz Channel, no important differences between past and present average values of environmental parameters were observed (see Cavalcante et al., 1981 and Macêdo et al., 1982). Accordingly to the CONAMA Resolution n. 020/1986, dissolved oxygen values must be over 5 mg/L. In the Botafogo estuary, however, most values were below the limits established by the relevant legislation, except at station 3 in June. In the Siri estuary, stations 3 in February and June and station 1 in October had values above 5 mg/L only (Table 1).
Concerning chlorophyll-a, average values (from 30.7 mg/m2 to 235 mg/m2) were within the range from 16 (Rizzo & Wetzel, 1985) to 300 mg/m2 (Shaffer & Onuf, 1983) found for temperate estuarine systems. Such observations suggest that temperature variations did not imply any great differences in microphytobenthic biomass between tropical and temperate estuaries. Phaeopigments concentrations (from 105 mg/m2 to 680 mg/m2) were higher than those for chlorophyll-a in both estuaries. The ratio between chlorophyll-a and phaeopigments was always less than 1 which may reflect both the physiological condition of the algae and/or the input of algal detritus (Cadée & Hegeman, 1977). However, no correlation between phaeopigments concentrations and percentage of silt and clay (a factor which may reflect erosion/deposition processes) was observed. Instead, phaeopigments concentration was well correlated with chlorophyll-a. These results most probably reflect the degradation of autochthonous algae. Besides, both chlorophyll-a and phaeopigments concentrations were significantly correlated with nitrogen concentration within the sediments.
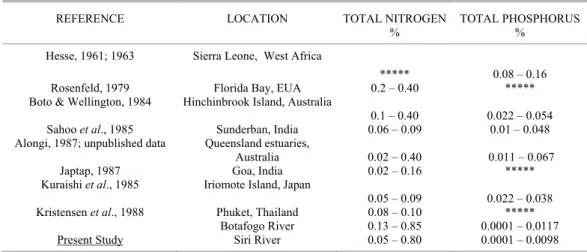
Botafogo estuary showed high nitrogen concentrations as compared to those of the Siri estuary and concentrations were higher in the midlittoral than in the sublittoral samples in both estuaries (Figs. 4 and 5). Nitrogen concentration average values were 0.27% in the Siri estuary (considering both midlittoral and sublittoral stations) and 0.33% in the Botafogo estuary (sublittoral stations only). These average values were
high but within the range of values registered for other tropical areas (Table 3). On the other hand, at the midlittoral stations of the Botafogo estuary nitrogen concentration average value (0.43%) was very high as compared to those of other tropical estuaries with the minimum values observed at those stations being similar to or even above the highest ones observed in such estuaries (Table 3).
Early studies on the chemical composition of plankton (Redfield, 1934) showed that particle matter contained carbon: nitrogen: phosphorus in the proportion of 106: 16: 1, a relation now referred to as the Redfield Ratio. Sediments generally have C/N of 10 or more (Degens, 1970). The present results show elevated C/N ratios in both estuaries (Table 2) and emphasize the high organic matter concentrations.
Table 3. Average concentrations of total nitrogen and phosphorus in some tropical mangrove sediments.
REFERENCE LOCATION TOTAL NITROGEN
%
TOTAL PHOSPHORUS %
Hesse, 1961; 1963 Sierra Leone, West Africa
***** 0.08 – 0.16
Rosenfeld, 1979 Florida Bay, EUA 0.2 – 0.40 *****
Boto & Wellington, 1984 Hinchinbrook Island, Australia
0.1 – 0.40 0.022 – 0.054 Sahoo et al., 1985 Sunderban, India 0.06 – 0.09 0.01 – 0.048 Alongi, 1987; unpublished data Queensland estuaries,
Australia 0.02 – 0.40 0.011 – 0.067
Japtap, 1987 Goa, India 0.02 – 0.16 *****
Kuraishi et al., 1985 Iriomote Island, Japan
0.05 – 0.09 0.022 – 0.038 Kristensen et al., 1988 Phuket, Thailand 0.08 – 0.10 *****
Present Study
Botafogo River Siri River
0.13 – 0.85 0.05 – 0.80
0.0001 – 0.0117 0.0001 – 0.0098
Salinity was discriminated by MRA as being a significant variable explaining phaeopigments variations in the Botafogo estuary. Shaffer & Onuf (1983), Pinckney & Zingmark (1991) and Santos et al. (1996) observed that salinity was one of a set of factors that were generally primary production-related variables. Nevertheless, stepwise multiple regression analysis discriminated the nitrogen concentration in both estuaries as an independent variable while phosphorus concentration was negatively associated with chlorophyll-a variations only in the Botafogo estuary. However, the β coefficient showed that neither salinity nor phosphorus had any important effect on the microphytobenthos in the Botafogo estuary; nitrogen was the most important factor controlling chlorophyll-a and phaeopigments variation in both estuaries.
Botafogo and Siri estuaries have suffered a set of environmental impacts due to nearby urban and industrial expansion. Shrimp farm effluent (nitrogen enriched) has been discharged in the Botafogo estuary with no assessment of environmental sustainability or even of possible effects on adjacent estuaries. Jones et al. (2001) have observed that the available nutrient amounts on shrimp farm effluents stimulated high primary production rates. Recently, some authors (Phillipart & Cadée, 2000; Meyer-Reil & Koster, 2000; Welker et al., 2002) have associated variations of primary production with eutrophication (Meyer-Reil & Koster, 2000) and Novak et al. (2001) have suggested that bottom-up process may exercise a potentially important control over benthic microphytes in estuarine sediments. The similar pattern observed for both estuaries did not enable to point out the effect of shrimp farm effluents. However, the data obtained during this study corroborate the results recorded in
the previous literature, emphasizing the role of nutrients and suggesting that both estuaries show evidence of eutrophication.
A
CKNOWLEDGEMENTSWe wish to thank Capes for Master scholarship for P.P.A. Murolo, CNPq doctoral scholarship for M.L.B. Carvalho, CNPq fellowship for P.J.P. Santos, and Instituto do Milênio em Oceanografia (PADCT-III 620065/01-0) for logistical support. We are also grateful to the WWF-Brasil and USAID (United States Agency for International Development) for their financial support under the Nature and Society Program (296-2003).
R
EFERENCESBarranguet, C. 1997. The role of microphytobenthic primary production in a Mediterranean mussel culture area. Estuar. coast. Shelf. Sci., 44:753-765.
Barranguet, C.; Herman, P. M. J. & Sinke, J. J. 1997. Microphytobenthos biomass and community composition studied by pigment biomarkers; importance and fate in the carbon cycle of a tidal flat. J. Sea. Res., 38: 59-70.
Bianchi, T. S. & Rice, D. L. 1988. Feeding ecology of
Leitoscoloplos fragilis: II. Effects of worm density on benthic diatom production. Mar. Biol., 99: 123-131. Boto, K. G. & Wellington, J. T. 1984. Soil characteristics and
nutrient status in northern Australian mangrove forests. Estuaries, 7:61-69.
Cadée, G. C. 1976. Sediment reworking by Arenicola marina
on tidal flats in the Dutch Wadden Sea. Neth. J. Sea Res., 10: 440-460.
Cavalcante, L. B.; Macedo, S. J. & Passavante, J. Z. O. 1981. Estudo Ecológico da Região de Itamaracá, Pernambuco – Brasil. XXI. Caracterização do Canal de Santa Cruz em função dos parâmetros físico-químicos e pigmentos fotossintéticos. Trabhs Oceanogr., Univ. Fed., Pernambuco, 16:157-216.
Colijn, F. C. & Dijkema, K. S. 1981. Species composition of benthic diatoms and distribution of chlorophyll-a on an intertidal flat in the Dutch Wadden Sea. Mar. Ecol. Prog. Ser., 4: 9-21.
Colijn, F. & De Jonge, V. 1984. Primary production of microphytobenthos in the Ems-Dollard estuary. Mar. Ecol. Prog. Ser., 14: 185-196.
Corbisier, T. N.; Sousa, E. C. P. M.; Eichler, B. B. 1997. Distribuição espacial do meiobentos e do microfitobentos na Enseada do Flamengo, Ubatuba, São Paulo. Rev. Bras. Biol., 57(1):109-119.
David, C. J. & Sousa, E. C. P. M. 1996. Variação diária dos pigmentos fotossintetizantes do microfitobentos da Praia de Aparecida, Santos, (23º58'48S- 46º19'00W), São Paulo, Brasil. Rev. Bras. Biol., 56(1):147-154. David, C. J.; Skowronski, R. S. P.; Sousa, E. C. P. M.;
Corbisier, T. N.; Eichler, B. B. & Gitiselli, R. O. 2003. Microphytobenthic biomass gradient along the beach face and along shore profiles at Pernambuco Beach, Guarujá - SP, Brazil. J. coast. Res., v. SI 35:426-430. Davis M. W. & McIntyre, C. D. 1983. Effects of physical
gradients on the production dynamics of sediment associated algae. Mar. Ecol. Prog. Ser., 13; 103-114. Degens, E. T. 1970. Molecular nature of nitrogenous
compounds in sea water and recent marine sediments. In: Hood, D. W. ed. Organic Matter in Natural Waters. Fairbanks University of Alaska. p.77-100.
Gould, D. M. & Gallagher, E. D. 1990. Field measurement of specific growth rate, biomass, and primary production of benthic diatoms of Savin Hill Cove, Boston. Limnnol. Ocean., 35:1757-1770.
Hogarth, P. J. 1999. The biology of mangroves. Oxford, Oxford University Press, 228p.
Holmes, R. W. & Mahall, B. E. 1982. Preliminary observations on the effects of flooding and desiccation upon the net photosynthetic rates of high intertidal estuarine sediments. Limnol. Oceanogr., 27: 954-958. Jones, A. B.; O’Donhue, M. J.; Udy, J.; Dennison, W. C.
2001. Assessing ecological impacts of shrimp and sewage effluent: biological indicators with standard water quality analyses. Estuar. coast. Shelf. Sci., 52:91-109.
Jong, D. J.; Nienhuis, P. H. & Kater, B. J. 1994. Microphytobenthos in the Oosterschelde estuary (The Netherlands), 1981-1990; consequences of a changed tidal regime. Hydrobiol., 282/283: 183-195.
Lehman, P. W. 1992. Environmental factors associated with long-term changes in chlorophyll concentration in the Sacramento-San Joaquin delta and Suisun bay, California. Estuaries, 15:335-348.
Lorenzen, C. J. 1967. Determination of chlorophyll and pheopigments spectrophotometric equations. Limnol. Oceanogr., 12: 343-346.
Macedo, S. J.; Melo, H. N. S. & Costa, K. M. P. 1982. Estudos ecológicos da região de Itamaracá – Pernambuco – Brasil. XXIII. Condições hidrológicas do estuário do rio Botafogo. Trabhs Oceanogr., Univ. Fed. Pernambuco, Recife, 17:81-122.
Mattson, J. & Linden, O. 1983. Benthic macrofauna succession under mussels, Mytilus edulis L. (Bivalvia), cultures on hanging long-lines. Sarsia, 68:97-102. McIntyre, H. L. & Cullen, J. J. 1995. Fine scale vertical
resolution of chlorophyll and photosynthetic pigments in shallow water benthos. Mar. Ecol. Prog. Ser., 122: 227-237.
Moura, A. N.; Passavante, J. Z. O.; Silva-Cunha, M. G. G. & Eskinazi-Leça, E. 1993. Diatomáceas perifíticas fixadas em substratos natural e artificial nos estuários dos rios Paripe e Igarassu-Ilha de Itamaracá- Pernambuco. Trabhs Oceanogr. Univ. Fed. Pernambuco, Recife, 22:86-96.
Moura, A. N., Passavante, J. Z.O. & Feitosa, F.A.N.1995. Biomassa de algas perifíticas em substrato artificial nos estuários dos rios Paripe e Igarassu-Ilha de Itamaracá- Pernambuco. Trabhs Oceanogr. Univ. Fed. Pernambuco, Recife, 23:17-23.
Novak, M; Lever, M; Valiela, I. 2001. Biol. Bull., 201: 292-294.
Oliveira, G. G.; Eskinazi-Leça, E. & Moura, A. M. N. 2000. Colonização de diatoméceas perifíticas em substrato artificial no estuário do rio Paripe-PE. In: Mangrove 2000 – Sustentabilidade de Estuários e Manguezais: Desafios e Perspectivas. Trabalhos Completos. Recife, ISME-Brasil/UFRPE. p. 1-15. CD-Rom.
Pinckney, J. & Zingmark, R. G. 1991. Effects of tidal stage and sun angles on intertidal benthic microalgal productivity. Mar. Ecol. Prog. Ser., 76: 81-89.
Pomeroy, L. R. 1959. Algal productivity in salt marshes of Georgia. Limnol. Oceanogr., 4:386-397.
Redfield, A. C. 1934. On the Proportion of organic derivatives in sea water and their relation to the composition of plankton. James Johnston Memorial Volume. University Press of Liverpool, p. 26-77. Rizzo, W. M. & Wetzel, R. L. 1985. Intertidal and shoal
benthic community metabolism in a temperate estuary: studies of spatial and temporal scales of variability. Estuaries, 8: 342-351.
Santos, P. J. P.; Castel, J. & Souza-Santos, L.P. 1997. Distribution and dynamics of microphytobenthos biomass in the Gironde Estuary (France). Oceanol. Acta, 20(3): 549-566.
Shaffer, G. P. & Onuf, C. P. 1983. An analysis of factors influencing the primary production of the benthic microflora in a southern California lagoon. Neth. J. Sea Res., 17:126-144.
Sousa, E. C. P. M. 1983. Primary production of the benthic microflora living on intertidal flats in Santos Estuarine System (24ºS-46ºW), São Paulo, Brazil. Bolm Inst. oceanogr., S Paulo, 32 (2):177-186.
Sousa, E. C. P. M.; Tomasi, L. R. & David, C. J. 1998. Microphytobenthic primary production, biomass, nutrients and pollutants of Santos Estuary (24 S,46 20´W). São Paulo, Brazil. Arq. Biol. Technol., 41(1):27-36.
Suguio, K. 1973. Introdução a sedimentologia. São Paulo, EDUSP/Edgard Blücher, 318p.
Sullivan, M. J. & Montcreiff, C. A. 1988. Primary production of edaphic algal communities in a Mississippi salt marsh. J. Phycol., 24: 49-58.
Valiela, I. 1995. Marine ecological processes. 2nd ed. New York , Springer-Verlag.686p.
Welker, C., Sdrigotto, E.; Covelli, S. & Faganeli, J. 2002. Microphytobenthos in the Gulf of Trieste (Northern Adriatic Sea): Relationship with labile sedimentary organic matter and nutrients. Estuar. coast. Shelf. Sci., 55:259-273.
Wetzel, R. G. & Likens, G. E. 1990. Limnological analysis.
New York,Springer-Verlag. 2nd. 338p.