The structural heterogeneity of an urbanised mangrove forest area in
southeastern Brazil: Inluence of environmental factors and anthropogenic
stressors
The objective of this study is to evaluate the
characteristics of the forest in an urbanised
mangrove using vegetation structure and abiotic
conditions to distinguish habitat heterogeneity/
quality. A total of 16 points in Vitória Bay were
selected in the fringe and basin forests. The variables
evaluated were height and diameter of the individual
trees, basal area, density, dominance, interstitial
water, litter mass, grain size, organic matter and
anthropogenic inluences. The results indicated
that the mangrove area, due to suffering intensely
from various anthropogenic effects, forests with
varying degrees of maturity. Areas more distant
from direct human effects had a higher degree of
development and environmental quality relative
to points closer to urban pressures. Intermediate
development levels were also observed, which
indicated pulses of environmental change. Human
interventions caused alterations in the development
of the forest which increased the mortality rate and
reduced the diameter and height of the trees. The
environmental variables of salinity, organic matter,
litter mass, grain size and anthropogenic stressors
contributed to the structural patterns. Our data
suggest that an analysis of the vegetation structure
and the abiotic factors are useful indicators to
evaluate habitat quality, thus providing a basis for
future management.
A
bstrAct
Gabriela Carvalho Zamprogno
1,4*, Mônica Maria Pereira Tognella
1,2, Valeria da Silva
Quaresma
1,3, Mercia Barcellos da Costa
1,4, Sávia Soares Pascoalini
1,2, Ger Facco do Couto
41 Universidade Federal do Espírito Santo, Programa de Pós-Graduação em Oceanograia Ambiental
(Av. Fernando Ferrari, 514, Goiabeiras - CEP 29075-910, Vitória, ES, Brasil)
2 Universidade Federal do Espírito Santo, Departamento de Ciências Agrárias e Biológicas
(Rodovia BR 101 Norte, Km. 60, Bairro Litorâneo - CEP. 29932-540, São Mateus, ES, Brasil)
3 Universidade Federal do Espírito Santo, Departamento de Oceanograia e Ecologia
(Av. Fernando Ferrari, 514, Goiabeiras - CEP 29075-910, Vitória, ES, Brasil)
4 Universidade Federal do Espírito Santo, Departamento de Ciências Biológicas
(Av. Fernando Ferrari, 514, Goiabeiras - CEP 29075-910, Vitória, ES, Brasil)
*Corresponding author: [email protected]
Descriptors:
Estuarine systems, Vegetation structure,
Environmental variables, Environmental quality,
Ur-ban pressures.
O objetivo deste estudo foi avaliar as características
das lorestas de um manguezal urbanizado, usando
estrutura da vegetação e fatores abióticos para distinguir
a heterogeneidade/qualidade do habitat. Foram
selecionadas 16 áreas na Baía de Vitória, nas lorestas de
franja e de bacia. Os dados avaliados foram altura, DAP,
área basal, densidade, dominância, água intersticial,
litter mass
, granulometria, matéria orgânica e inluência
antrópica. Os resultados indicam que o manguezal, por
sofrer intensamente com diversos impactos antrópicos,
apresenta bosques com diferentes graus de maturidade
e heteregeneidade estrutural. Áreas mais distantes de
impactos antrópicos diretos apresentam bosques com
maior grau de desenvolvimento e qualidade ambiental
em relação aos pontos mais próximos a pressões urbanas.
Níveis intermediários de desenvolvimento também
foram observados, indicando pulsos de alterações
ambientais. Em escala local, as intervenções humanas
provocaram alterações no desenvolvimento do bosque,
ampliicando a taxa de mortalidade e reduzindo o
diâmetro e altura das lorestas. As variáveis ambientais
salinidade, matéria orgânica, litter mass, granulometria
e os tensores antrópicos contribuíram para explicar
os padrões estruturais da vegetação. Nossos dados
sugerem que a análise da estrutura da vegetação e os
fatores abióticos analisados são indicadores úteis para
avaliar a qualidade do habitat, fornecendo uma base
para gestão futura.
r
esumo
Descritores:
Sistemas estuarinos, Estrutura da
vegetação, Variáveis ambientais, Qualidade
am-biental, Pressão urbana.
INTRODUCTION
The mangrove ecosystem is an important source of primary productivity and provides shelter and food for associated organisms. These and other functions make mangrove forests a complex and diverse ecosystem (TWILLEY et al., 1996; LEE, 2008; FELLER et al., 2010; HOGARTH, 2001) despite low plant species richness. Mangrove forests are characterised by a relatively simple food web containing both marine and terrestrial species and serve as resting and breeding sites for birds, reptiles, mammals and other species that are economically
important, including ish, crustaceans and molluscs
(ALONGI, 2002). In addition, mangrove forests provide human communities with numerous services (BADOLA et al., 2012), such as coastal protection from waves, storms (MAZDA et al., 2007; HORSTMAN et al., 2014) and, on the long-term, tsunamis and rises in the average sea level (DANIELSEN et al., 2005; ALONGI, 2008; WOLANSKI et al., 2009). The ecological complexity of this ecosystem may be observed in structural changes occurring on the local, spatial and temporal scales (ALONGI, 2009).
However, most of the global mangrove forests have recently been lost because of urban growth, global warming, aquaculture and urban and industrial development (ALONGI, 2002; SPALDING et al., 2010; GIRI et al., 2011) of different intensities and magnitudes. The degradation of the mangrove habitat results in a loss of ecological function, thus compromising many resources and reducing the income of traditional communities, in addition to endangering millions of people living on the coast (DUKE et al., 2007; FELLER et al., 2010).
Mangrove forests grow under the inluence of
environmental factors varying in intensity and frequency (SCHAEFFER-NOVELLI et al., 1990; ALONGI, 2009) according to latitudinal distribution and local history. Physiognomies inside the mangrove forest area are shaped by changes in fresh water and tide levels, wave energy, depositional and erosional processes and the associated biological communities (SCHAEFFER-NOVELLI et al., 2000). Mangrove soils have highly variable sedimentary characteristics because of their different sources (CINTRÓN; SCHAEFFER-NOVELLI, 1983). Sediments that reach the mangrove areas are of continental and marine origin and are transported and deposited by river and tidal currents (KRUITWAGEN et al., 2008).
Among the local environmental factors inluencing
mangrove forests, vegetation cover is closely related to
soil composition and salinity (CINTRÓN; SCHAEFFER-NOVELLI, 1983; UKPONG, 1994; CARDONA; BOTERO, 1998; ESTRADA et al., 2013) because species are distributed according to their salt tolerance and resource competitiveness (DUKE et al., 1998). In
addition to these factors, tidal looding frequency can inluence the distribution of species by causing changes
in soil characteristics (CUNHA et al., 2006). Mangrove plants are, therefore, a pool of genetic attributes
inluenced by a variety of biological and environmental
factors on local, regional and global scales, determining the distributional patterns of each species (DUKE et al., 1998). The structural characterisation of vegetation is a valuable tool for the investigation of the responses of the mangrove ecosystem to current environmental conditions and environmental change processes, thereby aiding in its conservation (SOARES, 1999; ESTRADA et al., 2013). Although already extensively studied, a better understanding of the basic processes of the mangrove environment is necessary, including responses to disturbances and restoration capacity (SCHAEFFER-NOVELLI et al., 2000). An analysis of mangrove forest structure can contribute to this understanding.
Evaluations of mangrove forest structure are an important coastal management mechanism necessary for the understanding and subsequent management of coastal areas, especially when the occupation of these areas increases constantly, particularly in economically emerging regions with intense pressures for the construction and/or expansion of port systems. Mangrove areas are increasingly imprisoned within urban systems, and thus it becomes impossible for them to maintain their evolutionary processes on the normal geological and ecological scale (WOLANSKI et al., 2009). According to SAKHO et al. (2011), the main factors that control the evolution of a mangrove forest in East Africa are anthropogenic, and this is true of most mangrove areas near large cities, of which the area examined in this study is an example.
The aim of this study is to evaluate the characteristics of the forest in an urbanised mangrove area using vegetation structure and abiotic conditions to distinguish
habitat heterogeneity/quality. Habitat quality is deined
by: linear trunk, canopy homogeneity, low mortality and largest size of tree. The hypothesis of this study is
that the heterogeneity of the forest structure relects the
MATERIAL AND METHODS
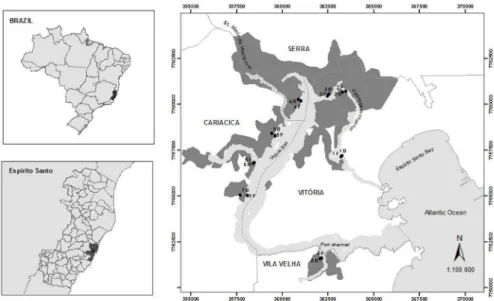
Study area
The Vitória Bay estuarine system (Figure 1) is located in a metropolitan region and has been suffering serious degradation since the early 1970s because of increasing urbanization and the presence of steel mills and mining activities, landills and deforestation (CARMO et al., 1995;
SOUZA et al., 2014a, b). Beyond the urban expansion mentioned, the bay encompasses the Vitória Port where ships from different countries with varied cargos and volumes circulate daily. Raw sewage is discharged along the estuary (GRILO et al., 2013). The mangrove area covers approximately 18 km² (VALE; FERREIRA, 1998), where species such as Rhizophora mangle, Laguncularia racemosa, Avicennia schaueriana and A. germinans, are found, the last being the least common. The Vitória Bay mangrove forest is distributed in a mosaic of six protected areas.
The regional climate is hot and humid with two distinct seasons: the rainy (November to April) and the dry season (May to October) (INMET, 2014).
Vitória Bay is connected to the ocean through two channels: the Passagem channel to the north and the Porto channel to the south. The Port channel is constantly dredged and attains the greatest depths of the bay, of approximately 20m (VERONEZ JÚNIOR et al., 2009).
The water low of the Santa Maria da Vitória River is
controlled by dams (GARONCE; QUARESMA, 2014). This river is the main freshwater input into the bay and is located in its western portion. In addition to this river, the small Formate-Marinho, Bubu, Aribiri and Piranema rivers
and Costa channel also low into the region (VERONEZ JÚNIOR et al., 2009). The freshwater and seawater inlow
therefore differs as between the various mangrove areas. The Vitória Bay estuary is characterised by a
microtidal regime, classiied as semi-diurnal (BASTOS et
al., 2010). The currents inside Vitória Bay are the result
of tidal effects, the low of the rivers, bay morphology, water column stratiication, waves and winds (VERONEZ
JÚNIOR et al., 2009).
Methodology
The points were selected to include all the cities of Vitória Bay, with a minimum distance between points, near the mouths of rivers and to obtain data on the presence and absence of disturbances such as urban occupation and release of sewage. Eight areas were established in Fringe (F) and Basin (B) forests, totalling 16 sampling points (Figure 1) representing most of the mangrove physionomy. F forests occupy marginal areas, and B forests are located inland, subject to a lower frequency
of tidal looding, where water renewal occurs more
slowly (CINTRÓN; SCHAEFFER-NOVELLI, 1983; SCHAEFFER-NOVELLI et al., 2000) and visual changes
in the tree structure are observed. Each point was deined
according to the trees’ density and contained at least 30 individual mangrove trees. The area of the plots ranged from 50 to 420 m² according to the density of individuals in the plot. The distances between the fringe and basin forests vary between 140 and 380 m.
The vegetation structure was evaluated once in February 2012 because the biomass increase is slow under natural conditions (KOMIYAMA et al., 2008). In each plot, trees taller than 1 m were counted, the species
identiied and recorded as alive or dead. Structural
parameters were estimated, including height, measured
with an optical rangeinder, and trunk diameter 1.30 m
above ground level (diameter at breast height, DBH) was
obtained using a graduated tape with π units (Forestry
Suppliers) according to the methodology proposed by SCHAEFFER-NOVELLI and CINTRÓN (1986). The following parameters were calculated using these data: relative density of dead trees, mean height, mean DBH, living and total basal area (living + dead), the mean number of trunks per individual, total and relative density and dominance of live trees per species, according to the methodology described by SCHAEFFER-NOVELLI and CINTRÓN (1986).
The interstitial water, litter mass, and sediment grain size and organic matter content characteristics were analysed for two seasons (summer - rainy and winter - dry) in 2012 and 2013.
At each point, three polyvinyl chloride (PVC) tubes (5 cm in diameter and 50 cm long) were inserted at least 45 cm deep into the sediment and perpendicular to the tidal line. The tubes had a closed base containing side pores over the initial 20 cm for the percolation of the water contained in the sediment. When stabilised and following the entry of interstitial water, salinity and pH (precision: ± 0.01) were determined using a Hanna HI 9828 Multiparameter Meter calibrated at each sampling with a standard solution.
Three samples of litter mass (organic matter accumulated on top of the surface sediment) were collected in delimited areas (20 x 20 cm) at each point. The samples were weighed (wet weight) and dried at 60°C to obtain the dry weight.
Three samples (weighing approximately 40 g) of surface sediment (2 cm) were collected to determine sediment grain size and organic matter content. The samples were washed, maintained in an oven at 40°C and then divided. To obtain grain size, organic matter was eliminated using hydrogen peroxide (H2O2 at 12%) for approximately 12 hours. A grain size analysis was then
conducted using a Mastersizer 2000 particle size analyser
and the samples were classiied as ine (silt + clay) or
sand. The organic matter content was determined by the sediment weight loss, which was subjected to ignition in a
mufle furnace at 450°C for 4 hours.
Data analysis
Descriptive statistics (means and standard deviations) were generated. Three-way ANOVA was performed using vegetation structure and environmental variables to detect differences between physiographic types (F and B), between the sampling points (1-8) and between the sampling periods (dry and rainy seasons in 2012 and 2013). Tukey’s test was applied a posteriori (ZAR, 1996). When the normality and homogeneity assumption was not
fulilled, a nonparametric Kruskal-Wallis test was used
to compare points and periods, and a Mann-Whitney U test compared physiographic types (F and B). A multiple comparisons test was applied a posteriori.
Cluster analysis was conducted using the
Bray-Curtis coeficient with fourth root-transformed vegetation
structure data. Principal component analysis (PCA) was performed using a data correlation matrix.
A Spearman correlation coeficient was calculated for
density and mean DBH.
The relationships between the vegetation attributes and environmental variables were evaluated using a canonical correspondence analysis (CCA) and a corresponding permutation test (LEGENDRE; LEGENDRE, 1994). The values were transformed by dividing by the Euclidean length of the variable’s vector.
For all tests, α was set at 0.05.
RESULTS
Although much of the Vitória Bay mangrove forest area is conserved, various anthropogenic effects can be observed, including occupation of the mangrove area, raw sewage discharge, the presence of garbage and solid
waste, and landills.
Vegetation structure
Rhizophora mangle L. was the dominant species on 75 percent of the plots. Exceptions were observed in B forests at points 1, 5 and 7 where the dominant species was
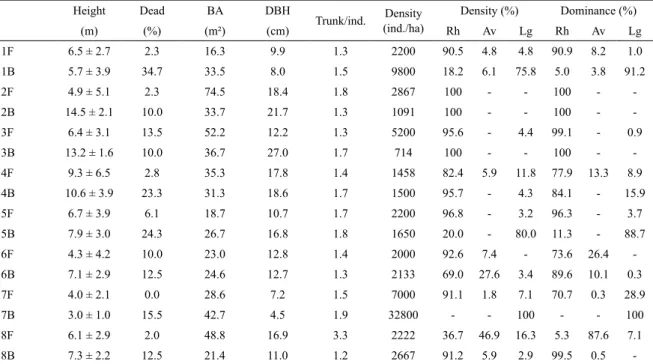
Table 1. Data on mangrove forest structure (sampling points: 1-8, F: fringe, B: basin) in Vitória Bay. Forest height: height (m), Dead: relative density of dead trees, DBH: diameter at breast hight, BA: total basal area, trunk/ind.: number of trunks per individual, total density (ind./ha) and relative density and dominance of living trees per specie (Rh: R. mangle, Av: A. schaueriana and Lg: L. racemosa).
Height Dead BA DBH
Trunk/ind. Density (ind./ha)
Density (%) Dominance (%)
(m) (%) (m²) (cm) Rh Av Lg Rh Av Lg
1F 6.5 ± 2.7 2.3 16.3 9.9 1.3 2200 90.5 4.8 4.8 90.9 8.2 1.0
1B 5.7 ± 3.9 34.7 33.5 8.0 1.5 9800 18.2 6.1 75.8 5.0 3.8 91.2
2F 4.9 ± 5.1 2.3 74.5 18.4 1.8 2867 100 - - 100 -
-2B 14.5 ± 2.1 10.0 33.7 21.7 1.3 1091 100 - - 100 -
-3F 6.4 ± 3.1 13.5 52.2 12.2 1.3 5200 95.6 - 4.4 99.1 - 0.9
3B 13.2 ± 1.6 10.0 36.7 27.0 1.7 714 100 - - 100 -
-4F 9.3 ± 6.5 2.8 35.3 17.8 1.4 1458 82.4 5.9 11.8 77.9 13.3 8.9
4B 10.6 ± 3.9 23.3 31.3 18.6 1.7 1500 95.7 - 4.3 84.1 - 15.9
5F 6.7 ± 3.9 6.1 18.7 10.7 1.7 2200 96.8 - 3.2 96.3 - 3.7
5B 7.9 ± 3.0 24.3 26.7 16.8 1.8 1650 20.0 - 80.0 11.3 - 88.7
6F 4.3 ± 4.2 10.0 23.0 12.8 1.4 2000 92.6 7.4 - 73.6 26.4
-6B 7.1 ± 2.9 12.5 24.6 12.7 1.3 2133 69.0 27.6 3.4 89.6 10.1 0.3
7F 4.0 ± 2.1 0.0 28.6 7.2 1.5 7000 91.1 1.8 7.1 70.7 0.3 28.9
7B 3.0 ± 1.0 15.5 42.7 4.5 1.9 32800 - - 100 - - 100
8F 6.1 ± 2.9 2.0 48.8 16.9 3.3 2222 36.7 46.9 16.3 5.3 87.6 7.1
8B 7.3 ± 2.2 12.5 21.4 11.0 1.2 2667 91.2 5.9 2.9 99.5 0.5
-of dead trees exceeded 10 percent in all B plots and in two F plots. Selective cutting was recorded with a high percentage only at point 7B, where 64% of the trunks had been killed by cutting. The proportion of trunks per individual tree ranged from 1.23 (8B) to 3.28 (8F), and the total density of individuals ranged from 714 ind./ha (3B) to 32,800 ind./ha (7B). Forests 2F and 3F had the highest basal area values and points 2B and 3B the highest mean DBH. The density and basal area parameters showed no statistical difference between the points and physiographic types (Kruskal-Wallis and Mann-Whitney test). The dead trees’ density values showed higher values in the basin forest than in the fringe forest (Mann-Whitney test, p = 0.02).
The forest height and DBH data differed signiicantly
between the points and were lowest in the forest at point 7 (Table 2). Points 2, 3 and 4 had the highest mean heights and point 7 the lowest. Point 7F exhibited a lower modal height (2.0 m) than the mean (4.0 m). By contrast, plot 5F exhibited a much higher modal height (15.4 m) than the mean (6.7 m).
Forest density was negatively correlated with mean DBH (R = -0.79, p < 0.05, Spearman’s test).
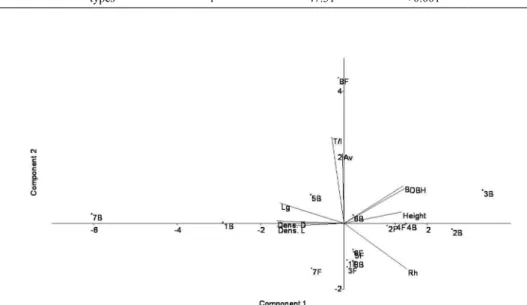
Based on the structure data (mean height, relative density of each species, density of living and dead trees,
mean DBH, living basal area and number of trunks per individual), a PCA was performed (Figure 2). Polygons corresponding to the F and B points overlapped, thus indicating no difference. Most of the information (73%) was explained by the horizontal (51%) and vertical (22%) axes. For component 1 (horizontal axis), DBH (0.81, PCA correlation value), R. mangle (0.79), basal area (0.76) and height (0.74) had greater weight, and points 3B (1.54), 2B (1.20), 4B (0.69), 4F (0.57) and 2F (0.48) were most strongly correlated to this axis. These points were dominated by R. mangle and had more developed trees. Points 1B, 7B and 5B were negatively correlated to this axis and positively correlated to the density of living and dead trees, thus indicating less developed trees, in addition to the dominance of L. racemosa. For component 2 (horizontal axis), trunks/individual (0.89) and A. schaueriana (0.72) had greater weight and 8F (3.17) was most strongly correlated. This result reinforced the uniqueness of the F forest at point 8 relative to the other points.
A similarity analysis was conducted based on the structure data (mean height, relative density of each species, mean DBH, living basal area and the number of trunks to
number of individuals), which identiied three main groups according to the dominant species (Figure 3). The irst
Table 2. Statistical analysis comparing the heights and DBH of trees in the sampling points (1-8) and between physiographic types (F: fringe, B: basin) using a Kruskal-Wallis, Mann-Whitney U test, and multiple comparisons test a posteriori. P: the probability associated with the test value. The homogenous groups determined by multiple comparisons test were arranged from the lowest to highest mean.
Variables Source of variation Degress of freedom Test value p Multiple comparison test
Height Point 7 28.36 < 0.001 7 < 1,5,6,8 < 2,3,4
types 1 49.52 < 0.001 F<B
DBH Point 7 39.32 < 0.001 7 < 1,5,6,8 < 2,3,4
types 1 47.31 < 0.001 F<B
Figure 2. The principal component analysis (PCA) of the vegetation structure fourth root-transformed (Bray-Curtis coeficient) as a function of living (Dens.L) and dead trees density (Dens.D), relative density of R. mangle (Rh), A. schaueriana (Av) and L. racemosa (Lg), basal area (B), forest height (Height), number of trunks per number of individuals (T/I) and mean DBH (DBH) at each sampling point (points: 1-8, B: basin, F: fringe) in the mangrove of Vitória Bay.
commonly dominated by L. racemosa. The second group was formed by point 8F because of the dominance of A. schaueriana. The third group, consisting of the remaining plots, had a higher relative density of R. mangle.
At points 2B, 3B and 4B, most individuals had a DBH greater than 9 cm (Figure 4). At points 2F, 6F, 7B and 7F, most individuals (over 60%) were small (< 3.5 cm). These points contained gaps in which the recruitment of young individuals occurred. The points dominated by
L. racemosa showed different stages of forest maturity. Point 7B was in the early stages of recovery, with most small individuals and no individual greater than 10 cm. The individuals of point 1B were at an intermediate DBH stage, and point 5B was considered mature forest with 60 percent of individuals with a DBH greater than 10 cm.
Environmental variables
Considering sediment grain size, points 1 and 7 were characterised as sandier (Tables 3 and 4). Between the
periods, samples collected in the summer of 2012 had muddier sediment than the other samples. Between-zone
(F and B) differences were not signiicant. The organic matter content did not differ signiicantly between periods
but differed among points, with points 1 and 7 having lower content. F points had lower organic matter content than B plots. Litter mass values were different between periods and were lower in the summer than in the winter. The B points had higher litter mass values than the F
points, but there was no signiicant difference between the
plots. Salinity differed between seasons and was higher in the summer of 2013 than in other periods. Points 7 and 8 had higher salinity values than other points. The salinity values at the B points were higher than at the F points. The pH also differed between periods, and there was a
signiicant difference between point 4, with the lowest
Figure 3. The vegetation structure cluster analysis relative to the mean height, relative density, mean DBH, living basal area and number of trunks
to individuals at each sampling point transformed by the fourth root (Bray-Curtis coeficient). Points: 1-8, B: basin, F: fringe.
The relationship between the vegetation
structure and environmental variables
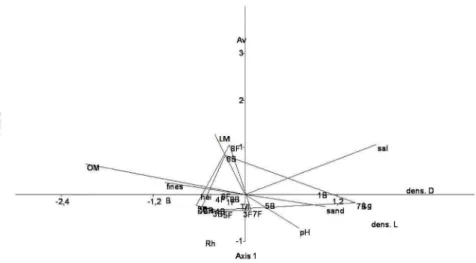
According to a CCA (Figure 5), the polygons corresponding to the F and B points overlapped, and the diagram showed a separation between the points based on the dominant species. According to a Monte Carlo
Permutation Test, there was a marginal signiicance
(p = 0.06) relative to the horizontal environmental component (axis 1), and this axis explained 76 percent of the environmental and biological data sampled. The environmental variables most strongly correlated with axis 1 were salinity (0.57, CCA correlation value) and sand (0.35) and, negatively, organic matter content (0.69) and mud (-0.35). Regarding the variables corresponding to vegetation structure, axis 1 was positively related to L. racemosa (1.52) and the density of living (1.63) and dead trees (2.09). Only points 1B (0.93), 7B (1.44) and 5B (0.25) were positively correlated with this axis. Therefore, these plots, dominated by L. racemosa, were associated with coarser sediment and higher salinity values. Plots with a greater abundance of A. schaueriana (8F and 6B) were associated with higher litter mass values. The remaining plots were dominated by R. mangle and associated with muddier areas with a higher percentage of organic matter and negatively related to salinity.
DISCUSSION
Several studies suggest that the maturity and density of mangrove forests are negatively correlated and that mean DBH and maturity are positively correlated (JIMENEZ et al., 1985; SCHAEFFER-NOVELLI; CINTRÓN, 1986; ALONGI, 2002; FROMARD et al., 2004; ESTRADA et
al., 2013). The negative correlation between the density of individuals and mean DBH observed in this study has again demonstrated that the most mature areas have lower density values. These forests are characterised by fewer large DBH. During the maturity phase, plant growth is then largely based on the increasing biomass of individual trees, and reduction in density due to competition (DUKE, 2001).
In this study, the forests with greater structural
development are monospeciic R. mangle forests, in muddier areas and are located farther from direct
anthropogenic inluences. The lowest structural
development values were observed in forests close to urban areas that received raw sewage and illegal garbage dumping and were related to higher sand concentrations. This heterogeneity in forest structure reinforces the diagnosis that areas with more constant and predictable abiotic factors, greater geomorphological stability and
a lower direct inluence of effects favor better forest
development (WOLANSKI et al., 2009; FELLER et al., 2010).
Another parameter used to evaluate forest quality was the distribution of the relative abundance of individuals in the varying diameter ranges. In this study, L. racemosa
was dominant in B forests closer to altered and sandier areas (points 1, 5 and 7). According to SOARES (1999), forests with the dominance of small L. racemosa
Table 3. The means (± standard deviation) of the following environmental variables: grain size (ines - silt + clay and sand
percentage), percentage of organic matter in the sediment, dry weight of the litter mass, salinity and pH recorded in the interstitial water of each sampling point at Vitória Bay (Points: 1-8, B: basin, F: fringe).
Sediment Interstitial water
Sand (%) Fines (%) Organic mater
(%) Litter mass (g) Salinity pH
1F 68.7 ± 19.1 31.3 ± 19.1 24.2 ± 15.4 24.4 ± 13.1 19.5 ± 4.5 7.1 ± 0.6
1B 65.3 ± 16.4 34.7 ± 16.4 20.4 ± 10.2 9.4 ± 6.2 19.5 ± 6.2 7.0 ± 0.5
2F 28.1 ± 13.3 71.9 ± 13.3 45.3 ±9.7 12.0 ± 12.0 17.2 ± 5.6 7.3 ± 0.6
2B 17.8 ± 16.1 82.2 ± 16.1 63.1 ± 3.8 22.9 ± 17.5 17.8 ± 4.6 7.1 ± 0.5
3F 20.7 ± 19.0 79.3 ± 19.0 40.1 ± 7.3 13.7 ± 18.4 15.9 ± 4.7 7.4 ± 0.6
3B 33.8 ± 27.6 66.2 ± 27.6 57.7 ± 12.8 22 ± 11.3 17.1 ± 4.7 7.2 ± 0.4
4F 31.9 ± 12.2 68.1 ± 12.2 32.6 ± 9.1 8.45 ± 5.4 17.9 ± 6.0 6.9 ± 0.4
4B 24.0 ± 20.2 76.0 ± 20.2 54.3 ± 13.2 24.7 ± 12.3 16.6 ± 5.3 6.7 ± 0.3
5F 30.7 ± 20.3 69.3 ± 20.3 32.4 ± 2.9 8.7 ± 10.1 18.5 ± 6 7.2 ± 0.3
5B 36.1 ± 20.3 63.9 ± 20.3 32.6 ± 6.9 12.4 ± 5.3 18.4 ± 6.1 7.0 ± 0.3
6F 41.5 ± 15.3 58.5 ± 15.3 33.8 ± 16.8 9.5 ± 3.8 16.2 ± 5 7.3 ± 0.3
6B 25.5 ± 16.8 74.5 ± 16.8 61.0 ± 8.2 67.4 ± 63.9 21.6 ± 7.5 7.0 ± 0.3
7F 58.2 ± 20.8 41.8 ± 20.8 19.5 ± 13.2 10.3 ± 9.7 20.1 ± 6.9 7.3 ± 0.3
7B 33.5 ± 23.6 66.5 ± 23.6 15.7 ± 5.4 20.3 ± 27.2 30.2 ± 6.3 7.4 ± 0.5
8F 26.6 ± 17.8 73.4 ± 17.8 43.7 ± 6.3 10.1 ± 7.7 24.2 ± 5.6 7.1 ± 0.3
8B 32.3 ± 21.1 67.7 ± 21.1 39.2 ± 17.2 25.4 ± 22.6 27.3 ± 3.2 7.2 ± 0.4
Table 4. Results of the statistical tests and the a posteriori multiple comparisons test using ines, organic matter, litter mass,
salinity and pH data between summer (sum) and winter (win) periods (2012 and 2013) among the sampling points (1-8) and between physiographic types (F and B). * Non-normal data: Nonparametric tests: Kruskal-Wallis and Mann-Whitney U, Normal data: Parametric test: Three-way ANOVA. Post-hoc test: ANOVA -Tukey’s test, Kruskal-Wallis - multiple comparisons test. P: the probability associated with the test value. The homogenous groups determined by the post-hoc test were arranged from the lowest to highest mean.
Test Variable Source of variation Degrees of freedon Test value p Post-hoc test
Kruskal Wallis
Fines*
Period 3 35.97 < 0.001 others < sum/2012
Point 7 52.01 < 0.001 1,7 < others
Mann-Witney Type 1 66.01 NS
-ANOVA Organic mater
Period 3 1.32 NS
-Point 7 31.15 <0.001 7, 1 < 5 < others
Type 1 29.35 < 0.001 F < B
Kruskal Wallis
Litter mass*
Period 3 28.27 < 0.001 Sum < win
Point 7 11.96 NS
-Mann-Witney Type 1 4.75 < 0.001 F < B
ANOVA Salinity
Period 3 13.39 < 0.001 others < sum/2013
Point 7 10.96 < 0.001 others < 7,8
Type 1 9.82 < 0.001 F < B
ANOVA pH
Period 3 32.04 < 0.001 sum/2012 < sum/2013
Point 7 4.78 < 0.001 4 < 7
the dominant species, and the trees are more developed. The forests dominated by L. racemosa in this study have been degraded and are in different regeneration stages, according to the variation observed in the distribution analysis of individuals in the diameter classes, covering from initial to intermediate and mature development phases. Point 7B, considered to be in an initial process, because most individuals have smaller diameters, is located close to urban occupation and is subject to solid waste disposal and raw sewage discharge. At point
1B, considered to be at an intermediate stage, landill
processes have caused changes in original grain size. The expansion of a road bridge that crossed the channel contributed to changes in the sediment deposition pattern (GODINHO, pers. comm., 2009.*), thus affecting the forest structure. Point 5B’s forest seems to have been
inluenced by previously disorders, presenting a great
abundance of larger individuals, demonstrating the maturity of the forest.
These results identiied disturbances of different
intensities, which resulted in individualised processes of mortality and discontinuous colonisation by propagules and seedlings (LUGO, 1980; JIMENEZ, 1990). The data on the structure and distribution of young individuals (DBH less than 3.5 cm) observed in the least developed F forests indicated that these areas were subject to natural
and induced stressors (landills, changes in the circulation
of the navigation channel, opening and closing of dams in its drainage basin and selective cutting).
BLANCO et al. (2001) recommend an analysis of height data as an important variable in evaluating disturbances. When considering the mean, mode and standard deviation,
height results may conirm the disturbances reported in the forests described above. This analysis helps to deine
the stability and/or maturity of forests which undergo no interventions from human actions. This evaluation ascertained that these fringe forests have different mode and mean height values with approximately 60 percent of individuals having smaller diameters, a fact which may be linked to the effect of stressors.
The trend to the reduction in the structural development of basin in relation to fringe forest is due to the lower
frequency of looding and has been veriied by studies
(CASTANEDA-MOYA et al., 2006; ESTRADA et al., 2013; YANG et al., 2013). However, in the present study B forests had more developed trees (height and diameter) than the F forests. WOODROFFE (1983) and BLANCO et al. (2001) have reported that the inner portions (B) of forests are more protected from waves and storms and are favoured by vegetation-trapped sediment. WOODROFFE (1983) also reports that F forests are more easily disturbed than the B forests. In the present study, most fringe forests have a higher number of young individuals (DBH < 3.5 cm) and higher standard deviation of the values of heights compared to the basin forests, probably due to gaps presences and increased colonization, which have reduced the average values of trees’ height and DBH. CUNHA-LIGNON et al. (2009), in São Paulo, also noted
Figure 5. Canonical correspondence analysis (CCA) using vegetation structure data - density of living (Dens. L) and dead trees (Dens. D), relative density of R. mangle (Rh), A. schaueriana (Av) and L. racemosa (Lg), total basal area (B), forest height (Hei), number of trunks to number of individuals (T/I) and mean diameter (DBH) - and environmental attributes - mean salinity (Sal), pH of interstitial water, organic matter content (OM), litter mass (LM) and
ines (silt + clay) and sand content - for each sampling point (Points: 1-8, B: basin, F: fringe) at the Vitória Bay mangrove.
a progressive increase in height in the interior of the forest in relation to the fringe. According to CUNHA-LIGNON et al. (2011), the stability of each site is the main factor responsible for the differences between forest types. No different patterns were observed, by multivariate analysis, between the B and F types because of the large spatial heterogeneity of the structural data; the differences between sampling points are, therefore, mostly caused by differing human pressures.
Signiicant changes in environmental conditions are
generally followed by changes in vegetation vigor, plant species zonation and extensive tree mortality (JIMENEZ et al., 1985). The highest mortality values were recorded at points located in the B forest. Mortality in these situations can be explained by three main factors: felling and/or occupation, forest maturation with natural death and changes in environmental conditions. The forest at 7B, nearest to urban occupation and with greater selective cutting, was dominated by L. racemosa. This species is widely used as a
source of irewood for the riverside community because of
the size of the trunk and because the trunk is often straight. High mortality was also observed in forests 4B and 5B, which are in a maturation process. The reduction in density and increase in DAP are associated with tree mortality due to the competition for space ( SHAEFFER-NOVELLI; CINTRÓN, 1986). Other stressors, such as road construction and the deposition of black dust on leaves and sediment (Personal observation), may explain the mortality at point 1B. The presence of iron ore dust on tree leaves in the study area was tested by ARRIVABENE et al. (2015), who observed no morphological or structural damage. However, decreased energy from light incident on plant tissues may reduce photosynthetic performance (NAIDOO; NAIDOO, 2005). The construction of bridge support pillars within the estuarine system disturbed the bottom, which increased the available sediment in the water column, thus changing the current velocity patterns in the
loodplain (GODINHO, pers. comm., 2009). Trees in forests
1B also showed an inclination of their trunks. TOGNELLA DE ROSA et al. (2006) observed trunk leaning in F forest dominated by L. racemosa and attributed its occurrence to increased hydraulic energy at the site.
Higher salinity values in the interstitial water may be associated with a reduction in mangrove size (CASTANEDA-MOYA et al., 2006; MARTINS et al., 2011; CALEGARIO et al., 2015) and an increase in mortality (CINTRÓN; SHAEFFER-NOVELLI, 1983) and the consequent deterioration of the mangrove forest
(CARDONA; BOTERO, 1998; SAKHO et al., 2011). However, higher salinity values and greater tree heights were observed for the B sampling points in this study. As regards the percentage of dead trees, B points presented
higher values, thus indicating the possible inluence of
salt concentration. The higher salinity for the B points was most likely due to the higher evaporation rates resulting
from lesser looding frequency. In the Vitória region the
precipitation and potential evapotranspiration are similar (SCHAEFFER-NOVELLI et al., 1990). Evaporation and plant transpiration are biological factors that may increase pore-water salinity (MARCHAND et al., 2004).
Species composition is an important factor inluencing
the dynamics of organic matter in mangrove forests (GLEASON; EWE, 2002). In this study, forests dominated by R. mangle had muddier loors and presented higher
values of organic matter. These results are consistent with those given by CINTRÓN and SCHAEFFER-NOVELLI
(1983), who conirmed that Rhizophora soils consist of a
ibrous structure composed of roots and organic matter and
generally contain higher percentages of organic material than other mangrove forests. MIDDLETON and MCKEE (2001) reported the formation of peat bogs in mangroves forests dominated by this species. Furthermore, the higher content of sedimentary organic carbon is related to mangrove aging (MARCHAND et al., 2003), agreeing with the results of this study, whose R. mangle forests are more mature.
In general, B forest had higher organic matter and litter mass content than the F forest. This result is to be explained by the restricted movement of water in B forests (SCHAEFFER-NOVELLI et al., 2000) which also explains the higher salt concentration in these forests. The highest litter mass values occurred in the winter due to reduced rainfall (resulting in less washing) and lower forest production.
In relation to the temporal variation of the
concentration of ine sediments, pH and salinity, there was no clear seasonal pattern. The concentration of ine
was higher in the summer of 2012 and may be associated with periods of higher rainfall and consequent river
lows. Salinity and pH were higher in summer 2013. Soil
pH is a function of moisture content and changes at the level of groundwater sheets (CINTRON,
SHAEFFER-NOVELLI, 1983) and salinity is inluenced by daily variations in tides and river lows.
This study demonstrated the presence of structural
heterogeneity inluenced by anthropogenic stressors
and both high and intermediate development stages and degraded forests were observed. The points in the inner areas of the bay (2, 3 and 4) are located in areas further from urban occupation and therefore have more developed trees (greater heights and DBH values) than outer points of the bay, which suffer more anthropogenic pressure from occupation and have the least developed trees (1 and 7). The characteristic mosaic structure of mangrove forests has been related to disturbances (SMITH, 1992; SOARES, 1999; SOARES et al., 2003), and the distribution of individuals within each diameter class can serve to evaluate forest regeneration processes (LUGO; SNEDAKER, 1974; JIMENEZ et al., 1985).
The synergy of human and ecological processes on different local, spatial and temporal scales, as suggested by ALONGI (2009), affects the natural processes of succession. The results of this study indicate that an evaluation of environmental heterogeneity should focus on individual mortality, mean and mode heights of individuals, dominance in basal area per species, and mean DBH and density. The latter are used to classify forests regarding their degree of maturity (LUGO, 1980). However, mean DBH and density alone cannot be used to assess forest heterogeneity, which is a response to local stressors, as was observed in this study. In addition to these important factors, mangrove management must also focus on abiotic factors, particularly sediment grain size, organic matter content and salinity.
An estimated one-third of global mangrove forests have been lost in the last 50 years (ALONGI, 2002). According to SOARES et al. (2003), a current challenge relative to the mangroves of Guanabara Bay, Rio de Janeiro, relates to the conservation of their structural and functional integrity, following the
sharp loss of their original area and the conlicts of
land usage arising from urban expansion. The entire
mangrove forest area of Vitória Bay has been under the protection of Conservation Units since 2010 (State Decree No. 2625). Due to anthropic pressure on the mangrove areas of Vitória Bay, forests were observed in different stages of development, thus indicating the importance of the conservation of these environments for the recovery of degraded areas and demonstrating that recovery is possible by the due maintenance of the areas concerned. CAVALCANTI et al. (2009) also concluded that establishing protection areas, together with the maintenance and management of the remaining mangrove areas, is essential for their preservation. SAKHO et al. (2011) have observed that mangroves damaged by anthropogenic actions can regenerate quickly under favourable environmental conditions when protected by appropriate public policies.
The Vitória Bay mangrove areas, due to the intense
impacts inlicted on them by many anthropogenic
activities, possess forests presenting different degrees of maturity and structural heterogeneity. The areas that are furthest from direct anthropogenic effects, along the northwest portion of the bay, have forest with a higher degree of development and environmental quality than do points in the areas closer to urban pressures (characterized by sewage, garbage, urban occupation, changes in grain size), thus indicating lower environmental quality. Intermediate development levels were also observed and may be interpreted as pulses of environmental change,
subject to speciic and non-chronic stressors. The data
indicate that on the local scale, in the Vitória Bay, human intervention has led to changes in the development of the forest, increasing the mortality rate and reducing the diameter and height of the trees and therefore the biomass available for the food web. This pattern is already well known to the literature on systems subjected to intense human pressure (SOARES et al., 2003; PELLEGRINI et al., 2009; PEREIRA et al., 2009; CAVALCANTI et al., 2009). The maintenance of the environmental quality of the estuary is heavily dependent on the plasticity of mangrove forests in response to environmental stressors.
Multivariate analyses contributed to the
understanding of the inluence of anthropogenic stressors
on abiotic factors, such as an increased concentration of sand and lower concentration of organic matter at the
most affected points, and consequently, the inluence
The analysis of the vegetation structure and the related abiotic factors led to the conclusion that the mangroves of Vitória Bay exhibit an environmental heterogeneity of high quality, in view of the development of the forest in the most protected areas of the Bay, in contrast to areas closer to urban occupation. Thus, the factors analyzed are useful indicators for the evaluation of ecosystem quality, providing a basis for future management and indicating priority areas for conservation. The management of estuarine systems under great pressure from urban expansion should establish areas to maintain and expand their mangrove forests.
ACKNOWLEDGMENTS
Special thanks are due to Rosalor Oliveira, in memoriam, and to Alan Christian M. Santos, Karina M. Menezes, Marcella B. Ribeiro and other colleagues of the Laboratório de Malacologia (UFES) for their assistance in
the ield work and laboratory. This study received inancial
support from the Companhia Docas do Espírito Santo
(CODESA) (n. 06/2011). The irst author was supported
during the study by a scholarship awarded by Coordenação de Aperfeiçoamento de Pessoal de Nível Superior (CAPES). The second author is Scholarship researcher of FAPES (Fundação de Apoio à Pesquisa do Espírito Santo),(Process 60127627/2012).
REFERENCES
ALONGI, D. M. Present state and future of the world’s mangrove forests. Environ. Conserv., v. 29, n. 3, p. 331-34, 2002. ALONGI, D. M. Mangrove forests: Resilience, protection from
tsunamis, and responses to global climate change. Estuar. Coast. Shelf Sci., v. 76, n. 1, p. 1-13, 2008.
ALONGI, D. M. Paradigm shifts in mangrove biology. In: PERILLO, G. M. E.; WOLANSKI, E.; CAHOON, D. R.; BRINSON, M. M. (Eds.). Coastal wetlands: an integrated ecosystem approach. Amsterdam: Elsevier, 2009. p. 615-640. ARRIVABENE, H. P.; SOUZA, I. C.; CÓ, W. L. O.; CONTI, M. M.;
WUNDERLIN, D. A.; MILANEZ, C. R. D. Effect of pollution by particulate iron on the morphoanatomy, histochemistry, and bioaccumulation of three mangrove plant species in Brazil. Chemosphere, v. 127, p. 27-34, 2015.
BADOLA, R.; BARTHWAL, S.; HUSSAIN, S. A. Attitudes of local communities towards conservation of mangrove forests: A case study from the east coast of India. Estuar. Coast. Shelf Sci., v. 96, n. 1, p. 188-196, 2012.
BALL, M. C. Ecophysiology of mangroves. Trees, v. 2, n. 3, p. 129-142, 1988.
BASTOS, A. C.; VILELA, C. G.; QUARESMA, V. S.; ALMEIDA,
F. K. Mid-to Late-Holocene estuarine inilling processes
studied by radiocarbon dates, high resolution seismic and biofacies at Vitoria Bay, Espirito Santo, Southeastern Brazil. An. Acad. Bras. Cienc., v. 82, n. 3, p. 761-770, 2010.
BLANCO, J. F.; BEJARANO, A. C.; LASSO, J.; CANTERA, J. R. A new look at computation of the complexity index in mangroves: do disturbed forests have clues to analyze canopy height patchiness? Wetl. Ecol. Manag., v. 9, n. 2, p. 91-101, 2001. CALEGARIO, G.; SALOMÃO, M. S. M. B.; REZENDE, C. E.;
BERNINI, E. Mangrove Forest Structure in the São João River Estuary, Rio de Janeiro, Brazil. J. Coast. Res., v. 31, n. 3, p. 653-660, 2015.
CARDONA, P.; BOTERO, L. Soil characteristics and vegetation structure in a heavily deteriorated mangrove forest in the Caribbean Coast of Colombia. Biotropica, v. 30, n. 1, p. 24-34, 1998.
CARMO, T. M. S.; BRITO-ABAURRE, M. G.; SENNA-MELO, R. M.; ZANOTTI-XAVIER, S.; COSTA, M. B.; HORTA, M. M. M. Os manguezais da baía norte de Vitória, Espírito Santo: um ecossistema ameaçado. Rev. Bras. Biol., v. 55, n. 4, p. 801-808, 1995.
CASTANEDA-MOYA, E.; RIVERA-MONROY, V. H.; TWILLEY, R. R. Mangrove Zonation in the Dry Life Zone of the Gulf of Fonseca, Honduras. Estuar. Coast., v. 29, n. 5, p. 751-764, 2006. CAVALCANTI, V. F.; SOARES, M. L. G.; ESTRADA, G. C. D.;
CHAVES, F. O. Evaluating mangrove conservation through the analysis of forest structure data. J. Coast. Res., v. 56, p. 390-394, 2009.
CINTRÓN, G.; SCHAEFFER-NOVELLI, Y. Introducion a ecología
del manglar. Montevideo: Oicina Regional de Ciencia y
Tecnología de la Unesco para América Latina y el Caribe, 1983. 109 p.
CUNHA, S. R.; TOGNELLA-DE-ROSA, M. M. P.; COSTA, C. S.
B. Salinity and looding frequency as determinant of mangrove
forest structure in Babitonga Bay, Santa Catarina State, Southern Brazil. J. Coast. Res., v. 39, p. 1175-1180, 2006.
CUNHA-LIGNON, M.; COELHO-JR., C.; ALMEIDA, R.; MENGHINI, R.; CORREA, F.; SCHAEFFER-NOVELLI, Y.; CINTRÓN-MOLERO, G.; DAHDOUH-GUEBAS, F. Mangrove Forests and Sedimentary Processes on the South Coast of São Paulo State (Brazil). J. Coast. Res., v. 56, p. 405-409, 2009. CUNHA-LIGNON, M.; COELHO JR., C.; ALMEIDA, R.;
MENGHINI, R. P.; SCHAEFFER-NOVELLI, Y.; CINTRÓN, G.; DAHDOUH-GUEBAS, F. Characterization of mangrove forest types in view of conservation and management: a review of mangals at the Cananéia region, São Paulo State, Brazil. J. Coast. Res., v. 64, p. 349-353, 2011.
DANIELSEN, F.; SØRENSEN, M. K.; OLWIG, M. F.; SELVAM, V.; PARISH, F.; BURGESS, N. D.; HIRAISHI, T.; KARUNAGARAN, V. M.; RASMUSSEN, M. S.; HANSEN, L. B.; QUARTO, A.; SURYADIPUTRA, N. Theasian tsunami: a protective role for coastal vegetation. Science, v. 310, n. 5748, p. 643, 2005.
DUKE, N.C. Gap creation and regenerative processes driving diversity and structure of mangrove ecosystems. Wetl. Ecol. Manag. v. 9, p. 257–269. 2001.
DUKE, N. C.; BALL, M. C.; ELLISON, J. C. Factors inluencing
biodiversity and distributional gradients in mangroves. Glob. Ecol. Biogeogr. Lett., v. 7, n. 1, p. 27-47, 1998.
ESTRADA, G. C. D.; SOARES, M. L. G.; CHAVES, F. O.; CAVALCANTI, V. F. Analysis of the structural variability of mangrove forest through the physiography types approach. Aquat. Bot., v. 111, p. 135-143, 2013.
FELLER, I. C.; LOVELOCK, C. E.; BERGER, U.; MCKEE, K. L.; JOYE, S. B.; BALL, M. C. Biocomplexity in mangrove ecosystems. Ann. Rev. Mar. Sci., v. 2, p. 395-417, 2010. FROMARD, F.; VEGA, C.; PROISY, C. Half a century of
dynamic coastal change affecting mangrove shorelines of French Guiana. A case study based on remote sensing data
analyses and ield surveys. Mar. Geol., v. 208, n. 2/4, p.
265-280, 2004.
GARONCE, F. A.; QUARESMA, V. S. Hydrodynamic aspects at Vitória Bay Mouth, ES. An. Acad. Bras. Cienc., v. 86, n. 2, p. 555-570, 2014.
GIRI, C.; OCHIENG, E.; TIESZEN, L. L.; ZHU, Z.; SINGHS, A.; LOVELANDS, T.; MASEK, J.; DUKE, N. Status and distribution of mangrove forests of the world using earth observation satellite data. Glob. Ecol. Biogeogr., v. 20, n. 1, p. 154-159, 2011.
GLEASON, S. M.; EWE, K. C. Organic matter dynamics
on the forest loor of a Micronesian mangrove forest: an
investigation of species composition shifts. Biotropica, v. 34, n. 2, p. 190-198, 2002.
GRILO, C. F.; NETO, R. R.; VICENTE, M. A.; CASTRO, E. V. R.; FIGUEIRA, R. C. L.; CARREIRA, R. S. Evaluation of
the inluence of urbanization processes using mangrove and fecal markers in recent organic matter in a tropical tidal lat
estuary. Appl. Geochem., v. 38, p. 82-91, 2013.
HOGARTH, P. J. Mangrove ecosystems. In: LEVIN, S. A. (Ed.). Encyclopedia of biodiversity. San Diego: Academic Press, 2001. p. 853-870.
HORSTMAN E. M.; DOHMEN-JANSSEN, C. M.; NARRA, P. M. F.; VAN DEN BERG; N. J. F.; SIEMERINK, M.; HULSCHER, S. J. M. H. Wave attenuation in mangroves:
A quantitative approach to ield observations. Coast. Eng.,
v. 94, p. 47-62, 2014.
INMET. Instituto Nacional de Meteorologia. Banco de dados meteorológicos para ensino e pesquisa. Available: <www. inmet.gov.br>. Accessed: December 2014.
JIMENEZ, J. A. A structure and function of dry weather mangroves on the Pacitic Coast of Central America, with emphasis onAvicennia bicolorforests. Estuaries, v. 13, n. 2, p. 182-192, 1990.
JIMENEZ, J. A.; LUGO, A. E.; CINTRON, G. Tree mortality in mangrove forests. Biotropica, v. 17, n. 3, p. 177-185, 1985. KOMIYAMA, A.; ONG, J. E.; POUNGPARN, S. Allometry,
biomass, and productivity of mangrove forests: A review. Aquat. Bot., v. 89, n. 2, p. 128-137, 2008.
KRUITWAGEN, G.; PRATAP, H. B.; COVACI, A.; WENDELAAR BONGA, S. E. Status of pollution in mangrove ecosystems along the coast of Tanzania. Mar. Pollut. Bull., v. 56, n. 5, p. 1022-1031, 2008.
LEE, S. K. Mangrove macrobenthos: Assemblages, services, and linkages. J. Sea Res., v. 59, n. 1/2, p. 16-29, 2008. LEGENDRE, P.; LEGENDRE, L. Numerical ecology.
Amsterdam: Elsevier, 1994.
LUGO, A. E. Mangrove ecossistems: successional or steady state? Biotropica, v. 12, n. 2, p. 65-72,1980.
LUGO, A. E.; SNEDAKER, S. C. The ecology of mangroves. Ann. Rev. Ecol. Syst., v. 5, p. 39-64, 1974.
MARTINS, P. T. A.; COUTO, E. C. G.; DELABIE, J. H. C. Fitossociologia e estrutura vegetal do Manguezal do rio Cururupe (Ilhéus, Bahia, Brasil). Rev. Gest. Cost. Integr., v. 11, n. 2, p. 163-169, 2011.
MARCHAND, C.; LALLIER-VERGES, E.; BALTZER, F. The composition of sedimentary organic matter in relation to the dynamic features of a mangrove-fringed coast in French Guiana. Estuar. Coast. Shelf Sci., v. 56, n. 1, p. 119-130, 2003.
MARCHAND, C.; BALTZER, F.; LALLIER-VERGÉS, E.; ALBÉRIC, P. Pore-water chemistry in mangrove sediments: relationship with species composition and developmental stages (French Guiana). Mar. Geol., v. 208, n. 2/4, p. 361-381, 2004.
MAZDA, Y.; WOLANSKI, E.; RIDD, P. V. The role of physical processes in mangrove environments: manual for the preservation and utilization of mangrove ecosystems. Tokyo: Terrapub, 2007.
MIDDLETON, B. A.; MCKEE, K. L. Degradation of mangrove tissues and implications for peat formation in Belizean island forests. J. Ecol., v. 89, n. 5, p. 818-828, 2001.
NAIDOO, G.; NAIDOO, Y. Coal Dust Pollution Effects on Wetland Tree Species in Richards Bay, South Africa. Wetl. Ecol. Manag., v. 13, n. 13, p. 509-515, 2005.
PELLEGRINI, J. A. C.; SOARES, M. L. G.; CHAVES, F. O.; ESTRADA, G. C. D.; CAVALCANTI, V. F. A. Method for the Classification of Mangrove Forests and Sensitivity/ Vulnerability Analysis. J. Coast. Res., v. 56, p. 443-447. 2009.
PEREIRA, L.C.C.; MENDES, C.M.; MONTEIRO, M.C. & ASP, N.E. Morphological and sedimentological changes in a macrotidal sand beach in the Amazon Littoral (Vila dos Pescadores, Pará, Brazil). Journal of Coastal Research SI 56: 113-117, 2009
SAKHO, I. S.; MESNAGE, V.; DELOFFRE, J.; LAFITE, R.; NIANG, I.; FAYE, G. The influence of natural and anthropogenic factors on mangrove dynamics over 60 years: The Somone Estuary, Senegal. Estuar. Coast. Shelf Sci., v. 94, n. 1, p. 93-101, 2011.
SCHAEFFER-NOVELLI, Y.; CINTRÓN, G. Guia para estudo de áreas de manguezal, estrutura, função e flora. São Paulo: Caribbean Ecological Research, 1986. 150 p. SCHAEFFER-NOVELLI, Y.; CINTRÓN-MOLERO, G.;
ADAIME, R. R.; CAMARGO, T. M. Variability of mangrove ecosystems along the brazilian coast. Estuaries, v. 13, n. 2, p. 204-218, 1990.
SCHAEFFER-NOVELLI, Y.; CINTRÓN-MOLERO, G.; SOARES, M. L. G.; TOGNELLA-DE-ROSA, M. M. P. Brazilian mangroves. Aquat. Ecosyst. Health Manag., v. 3, n. 4, p. 561-570, 2000.
SMITH, T. J. III. Forest structure. In: ROBERTSON, A. I.; ALONGI, D. (Eds.). Tropical mangrove ecosystems. Washington: American Geophysical Union, 1992. p. 101-136.
SOARES, M. L. G.; CHAVES, F. O.; CORRÊA, F. M.; SILVA JÚNIOR, C. M. G. Diversidade estrutural de bosques de mangue e sua relação com distúrbios de origem antrópica: o caso da baía de Guanabara (Rio de Janeiro). Anu. Inst. Geocienc., v. 26, p. 101-116, 2003.
SOUZA, I. C.; MOROZESK, M.; DUARTE, I. D.; BONOMO, M. M.; ROCHA, L. D.; FURLAN, L. M.; ARRIVABENE, H. P.; MONFERRÁN, M. V.; MATSUMOTO, S. T.; MILANEZ, C. R. D.; WUNDERLIN, D. A.; FERNANDES, M. N. Matching pollution with adaptive changes in mangrove plants by multivariate statistics. A case study, Rhizophora
mangle from four neotropical mangroves in Brazil.
Chemosphere, v. 108, p. 115-124, 2014a.
SOUZA, I. C.; BONOMO, M. M.; MOROZESK, M.; ROCHA, L. D.; DUARTE, I. D.; FURLAN, L. M.; ARRIVABEBE, H. P.; MONFERRÁN, M. V.; MATSUMOTO, S. T.; MILANEZ, C. R. D.; WUDERLIN, D. A.; FERNANDES, M. N. Adaptive plasticity of Laguncularia racemosa in response to different environmental conditions: Integrating chemical and biological data by chemometrics. Ecotoxicology, v. 23, n. 3, p. 335-348, 2014b.
SPALDING, M.; KAINUMA, M.; COLLINS, L. World atlas of mangroves. London: Earthscan, 2010.
TOGNELLA-DE-ROSA, M. M. P.; OLIVEIRA, R. G.; SOARES, M. L. G.; SCHAELLENBERGER, B. H.; MARINHEIRO, F. B. G.; CUNHA, S. R. Estrutura do manguezal do Rio Lagoa do Furado, Penha, SC. In: BRANCO, J. O.; MARENZI, A. W. C. (Eds.). Bases ecologicas para um desenvolvimento sustentável: Estudo de caso em Penha, SC. Itajaí. Penha: Univali, 2006. p. 77-92.
TWILLEY, R. R.; SNEDAKER, S. C.; YAÑEZ-ARANCIBIA, A.; MEDINA, E. Biodiversity and ecosystem processes in tropical estuaries: perspectives from mangrove ecosystems. In: MOONEY, H.; CUSHMAN, H.; MEDINA, E. (Eds.). Biodiversity and ecosystem functions: a global perspective. New York: John Wiley and Sons, 1996. p. 327-370.
UKPONG, I. E. Soil-vegetation interrelationships of mangrove swamps as revealed by multivariate analyses. Geoderma, v. 64, n. 1/2, p. 167-181, 1994.
VALE, C. C.; FERREIRA, R. D. Os Manguezais do Litoral do Estado do Espírito Santo. In: Anais do Simpósio de Ecossistemas da Costa Sul e Sudeste Brasileira. São Paulo: Publicações ACIESP, 1998. p. 88-94.
VERONEZ JÚNIOR, P.; BASTOS, A. C.; QUARESMA, V. S. Morfologia e distribuição sedimentar em um sistema estuarino tropical: Baía de Vitória, ES. Rev. Bras. Geof., v. 27, n. 4, p. 609-624, 2009.
WOLANSKI, E.; BRINSON, M. M.; CAHOON, D. R.; PERILLO, G. M. E. Coastal Wetlands: a synthesis. In: PERILLO, G. M. E.; WOLANSKI, E.; CAHOON, D. R.; BRINSON, M. M. (Eds.). Coastal wetlands: an integrated ecosystem approach. Amsterdam: Elsevier, 2009. p. 1-62.
WOODROFFE, C. The impact of cyclone Isaac on the coast of Tonga. Pac. Sci., v. 37, n. 3, p. 181-210, 1983.
YANG, J.; GAO, J.; CHEUNG, A.; LIU, B.; SCHWENDENMANN, L.; COSTELLO, M. J. Vegetation and sediment characteristics in an expanding mangrove forest in New Zealand. Estuar. Coast. Shelf Sci., v. 134, p. 11-18, 2013.