1 Recebido para publicação em 16.2.2011 e aprovado em 16.3.2011.
2 Department of Agronomy, Gorgan University of Agricultural Sciences and Natural Resources, Gorgan 49138-15739, Iran, *Corresponding Author: Fax: +98-171-4420438/981 - Mobile: +98-911-2782644, <elias.soltani@yahoo.com>.
Q
UANTIFYINGS
EEDP
RODUCTION BYV
OLUNTEERC
ANOLA(
Brassica napus
)
ANDSinapis arvensis
1Quantificar a Produção de Sementes de Canola Voluntária (
Brassica napus
) e
Sinapis arvensis
SOLTANI, E.2
, SOLTANI, A.2
, GALESHI, S.2
, GHADERI-FAR, F.2
and ZEINALI, E.2
ABSTRACT - Volunteer canola (Brassica napus) and Sinapis arvensis are well identified weeds of different cropping systems. Quantitative information on regarding seed production by them is limited. Such information is necessary to model dynamics of soil seed banks. The aim of this work was to quantify seed production as a function of the size of those weeds. A wide range of plant size was produced by using a fan seeding system performed at two sowing dates (environments). Plant size varied from 3 to 167 g per plantfor canola and from 6 to 104 g per plant for S. arvensis. Seed production ranged from 543 to14,773 seeds per plant for canola, and from 264 to 10,336 seeds per plant for S. arvensis. There was a close relationship between seed production per plant and plant size which was well-described by a power function (y = 130.6x0.94; R2 = 0.93 for canola and y = 28x1.27; R2 = 0.95 for S.arvensis). There was also
strong relationships among the number of pods produced in individual plants and the quantity of seeds produced (g per plant) with the size of the plant. The relationships found in this study can be used in dynamic seed bank models of volunteer canola and S. arvensis.
Keywords: weed, plant size, density, planting.
RESUMO - Voluntáriosde canola(Brassica napus)eSinapis arvensissão conhecidascomo plantas daninhasnaprodução agrícola.A informação quantitativasobre a produção desementes de ervas daninhasporestasé limitada. Ainformaçãoénecessáriaparaa dinâmicado modelode bancos desementesdo solo. O objetivodestetrabalho foiquantificar aproduçãode sementesem funçãodo tamanhodestasplantas daninhas. Uma grande variedade detamanho das plantasfoiproduzido usando-seumsistema de semeadura em leque,realizado emduasépocas de semeadura(ambientes).
O tamanho da plantavariou entre3e167g por plantapara acanolae entre6e104g por planta paraS.arvensis. A produção de sementesvariouentre543e14.773 sementes por plantade canolaeentre264e10.336de sementes por plantaparaS.arvensis. Houveuma estreita relação entrea produção de sementesporplantae o tamanho da plantaquefoibemdescritapor uma função potência(y=130,6x0.94; R2 =0,93para a canolaey = 28x1.27; R2 =0,95 paraS.arvensis). Houve tambémalgumasfortes relações entre onúmerodevagensproduzidasemplantas individuaise a quantidadedesementesproduzidas(gpor planta) com o tamanho da planta. Relaçõesencontradas neste estudopodem serusadasemmodelosdinâmicosdo bancode sementesdecanolavoluntária eS.arvensis.
Palavras-chave: planta daninha, tamanho da planta, densidade, plantio.
INTRODUCTION
Canola (Brassica napus) cultivars with
undesirable characteristic of dehiscent pods lead to shattering seeds easily after maturity and desiccation, and the shattered seeds
enhance soil seed-bank of volunteer canola to a great extent. Volunteer canola is known as weed in the winter crop production fields such as winter wheat. Gulden et al. (2003) reported the average seed-bank additions of
or 3,000 viable seeds m-2
, and is 20 times greater than the normal seeding rate of 4 to
5kg ha-1
for the crop. This leads to an extensive establishment of volunteer canola populations (Lawson & Friesen, 2006). Simard et al. (2002) reported that in Europe, canola seeds persisted in the soil for at least 5 years and volunteer plants were observed in the fields until 10 years after production (Knott, 1993; Lutman & López-Granados, 1998) whereas in western Canada, it was until 4years for volunteer plants (Thomas & Leeson, 1999). Reasons to increase volunteer canola in cropping system have been explained by using genetically engineered (GE) herbicide-resistant canola varieties and due to the rise in the annual seeded area of canola (Lawson & Friesen, 2006).
Sinapis arvensis is one of the persistent
and emergent weed in winter crop production
systems. It has been reported that S.arvensis
populations of 20-80 plants m-2
resulted in a reduction of 19 to 77% in canola yield (Warwick et al., 2000). There are also some reports on yield reduction in other crops as for example flax, potato, and cabbage (Zeinali & Ehteshami, 2004). The weedy and troublesome
nature of S. arvensis are explained by its
strongly persistent seed-bank, competitive growth habit, and high fecundity (Warwick et al., 2000).
Soil seed-bank can be enriched through different mechanisms such as mechanical, wind, water, human-aided, animal aided, machinery and mimicry (Zimdahl, 2007), but established plants in crop fields are the main source of seeds in any soil seed-bank (Carvalho et al., 2005). Therefore, knowledge on seed production by weed species is necessary to understand the dynamics of soil seed-bank. Because weed and crop densities vary from field to field and affect seed production by the weed, a better substitute for density must be sought. Plant size is such a substitute, which reflects the effect of plant density and environmental conditions. Quantification of seed production as a function of plant size provides a simpler method for estimating weed seed production and an alternative to actually assessing seeds, which is very labor-intensive (Lutman, 2002). Several researchers have used this method
to estimate seed production in weedy species (Thompson et al., 1991; Lutman, 2002; Grundy et al., 2004). However, quantitative
information in volunteer canola and S.arvensis
are scarce and come from limited range of plant sizes. Therefore, the aim of this work was to quantify the relationship between seed production and plant size in volunteer canola and S. arvensis over a wide range of plant size and seed production. This study is part of a comprehensive study to model seed-bank
dynamics of volunteer canola and S. arvensis.
MATERIAL AND METHODS
Data collection
The experiments were carried out on Research Farm of Gorgan University of Agricultural Sciences and Natural Resources,
Gorgan, Iran (36o
51' N, 54o
16' E and 13 m altitude; temperate sub-humid climate). Seeds used for planting were collected from canola fields around Gorgan during May 2009.
The experimental design to study the effect of plant density was a fan design (Figure 1).
Each experimental plot was 8 x 8 m (64 m2
) and seeds were sown in 11 rows. One corner of each plot was chosen as the beginning of planting rows with inter-row spacing considered to zero and as the rows stretched away at the opposite sides, the inter-row spacing became to 1.5 m (Figure 1). To create more variation in plant size and seed production, the design was carried out at two
Figure 1 - Fan design plot used for planting. There were 4 plots for volunteer canola and Sinapis arvensis in two planting
planting dates (November 16 and December 14, 2009) as to depict different environmental conditions. Seeds were planted with 2-5 cm intra-row spacing of and increased to 5-10 cm with two times hand thinning. At the harvest time, a 0.5 m wide margin was left around each plot and the remaining area of each plot
(49 m2
) was divided into 49,1 x 1 m (1 m-2
) girds. Thus, there were 98,1 x 1 m sub-plots across the sowing dates for each species. To prevent seed shattering, sub-plots were harvested just before harvest maturity. At the harvest time, all mature plants were collected from each sub-plot and three randomly selected plants from each sub-plot were bagged separately.
In the laboratory, it was carried out measurements on plant height (cm), main stem node number, number of pods per plant, seeds per pod, seeds per plant, dry weight of pods (g per plant), seed dry weight (g per plant),
100-seeds dry weight (mg 100 seeds-1
) and plant size (g per plant). After measuring plant height and counting node number, pods were counted by hand. The pods were removed from the plants and the seeds were extracted, by hand, from the pods and were counted by hand. All the plant material was retained, oven-dried
at 70 o
C for 48h and weighed. Hundred-seed-weight was determined by counting and weighing 100 seeds manually.
Data analysis
The relationship between plant density and plant size (g per plant) was quantified by using a power equation:
b
ax
y
=
[eq. 1]in which, y = plant size, x= density and a and
b = parameters. The same equation was used
for modeling the relationship between the number of seeds produced per plant, number of pods per plant and seed production (g per plant) with plant size (g per plant). For the relationship between seed number per pod and 100-seed weight with plant size, a simple, linear regression model was used:
bx
a
y
=
+
[eq. 2]in which, y = number of seeds per pod or weight
of 100 seeds, x = plant size (g per plant) and a
and b = parameters.
Equations (1) and (2) were fitted to the data by PROC NLIN and PROC REG of SAS (Soltani, 2007). PROC MEANS was used to calculate variations and means for the studied variables (Soltani, 2007).
RESULTS AND DISCUSSION
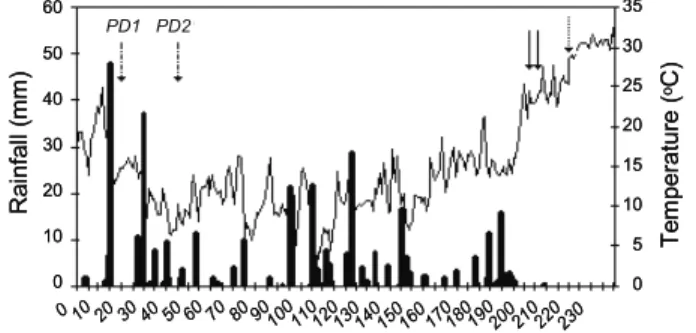
Figure 2 presents changes in precipitation and temperature during the growing season from sowing to harvest time of canola and
Sinapis arvensis. Both planting dates of
S. arvensis matured 9 days after canola
maturity in the second planting date. Early
maturity of sowing date 2 of S. arvensis must
be a result of higher temperatures during seed
filling period (Figure 2). Growing season
precipitation was 328 mm for the first sowing date and 255 mm for the second sowing date. Averagegrowing season temperature was 12.4
and 13.0 o
C for canola at first and second sowing dates, respectively. Such values for
S. arvensis were 12.7 and 13.5 o
C.
The design and sowing dates resulted in a wide range of plant density. Plant density
varied from 3 to 128 plants m-2
for canola and
from 5 to 162 plant m-2
for S. arvensis. Other plant traits studied showed a similar variation. Plant size (g per plant) ranged widely from 3 to 167 g per plant for canola, and 6 to
104 g per plant for S. arvensis. Average plant
size for canola and S.arvensis was 37.8 and
32.8 g per plant (Table 1). Average plant height of S.arvensis (177 cm) was higher than canola (111 cm) and varied from 90 to 144 cm for
Figure 2 - Mean daily air temperature (black line) and mean daily rainfall in the growing season. PD1 and PD2 show planting dates on 16 Nov. and 14 Dec 2009. Solid arrows indicate harvest dates for volunteer canola and dotted arrow show harvest date for both planting date of Sinapis arvensis.
R a in fa ll (m m) Te m p erat ure ( oC)
Days after 23 Oct PD1 PD2
60 50 40 30 20 10 0 35 30 25 20 15 10 5 0
0 10 20 30 40 50 60 70 80 90 100110120130140150160 170180190200210220230
R a in fa ll (m m) Te m p erat ure ( oC)
Days after 23 Oct PD1 PD2
60 50 40 30 20 10 0 35 30 25 20 15 10 5 0
canola and 137 to 205 cm for S. arvensis
(Table 1). Number of nodes in the main stem
was 5 to 9 for canola and 14 to 25 for S. arvensis
(Table 1), which had no significant differences as affected by planting date and densities for both species. Maximum pod number per each canola plant was 621, whereas it was as twice
as greater for S. arvensis and minimum pods
number for canola and S. arvensis were 23 and
49 (Table 1). Maximum number of seeds
produced per plant for canola and S. arvensis
were 14,773 and 10,336, and were recorded for lower densities and the first planting date (Table 1). Minimum number of seeds per plant
for canola and S. arvensis was 543 and 264,
respectively, and it was performed at the highest densities in the second planting date (Table 1). Pod dry weight and seed production (g per plant) for canola did not vary largely. But,
S. arvensis pods dry weight (9 g per plant) was about twice as much as the seed production (4 g per plant) (Table 1). The mean of seeds dry
weight ranged from 255 to 385 mg 100 seeds-1
for canola, and from 105 to 189 mg 100 seeds
-1 for S. arvensis (Table 1). Thus, thedesired
range of plant size (g per plant) and seed production were obtained.
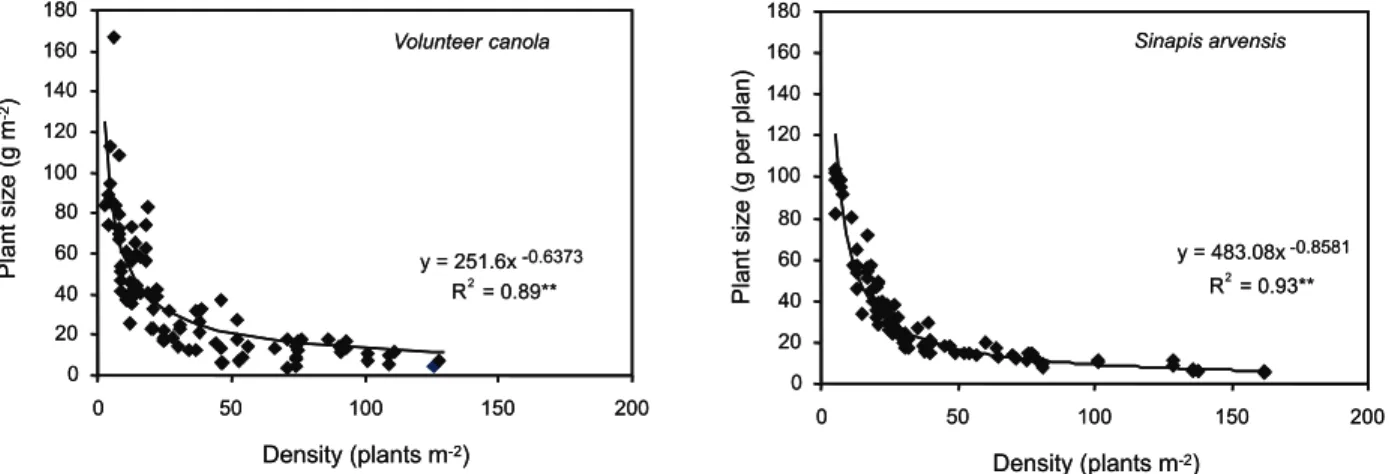
Plant size was closely dependent on plant density and decreased with the increase in plant density. This relationship was
well-described by the power equation when R2
coefficients were 0.89 and 0.93 for canola and
S . a r v e n s i s, respectively. The a and b
parameters were 251.6 and -0.64 for canola and these parameters were 483.1 and -0.86 for S. arvensis. The a parameter shows plant
size at the plant density of 1 plant m-2
. According to the model, when density
increased from 3 to 130 plant m-2
, plant size decreased from 125 to 11 g per plant for canola.
Plant size of S. arvensis decreased from
104 g per plant at 6 plant m-2
to 6 g per plant
at 162 plant m-2
(Figure 3).
Density and planting dates can have a great effect on seed production of species (Sester et al., 2004; Nurse & DiTommaso, 2005). High plant density led to decrease in individual plant size and the amount of seeds produced by the plant (Pacala & Silander, 1990).
High plant density could also have delayed seed
set (Wulff, 1986; Watkinson et al., 1989). Weiner et al. (1997) pointed that high plant densities have little effect on average seed
weight. One of the most important causes of plant size and seed production in individual plants may be competition for nutrients and other resources (such as water and light), which limits individual plant growth. However, density and planting date effects will be no longer discussed in this work because these treatments were applied to obtain a wide range of plant sizes in order to quantificate seed production. Results indicated that these treatments were successful in creating a wide range of plant sizes (Table 1 and Figure 3).
Number of seeds per plant, number of pods per plant and weight of seeds per plant (g per plant) were described by using a simple
allometric relation (y = axb
) as a function of
plant size (g per plant). R2
values were 0.93 for seeds per plant, 0.92 for pods per plant and 0.98
for seed yield per plant. The a and b parameters
estimate of power equation for volunteer canola are presented in Figure 4a, b, c, d and e.
According to these relationships, canola plants with a plant size of 1, 10 and 100 g per plant would produce approximately 130,116 and 10,330 seeds per plant respectively and number of pods would be around 6, 50 and 417 per plant (Figure 4A and B). Plant size of 1, 10 and 100 g per plant lead to a production of 0.3, 3 and 29 g seeds per plant (Figure 4C).
A linear regression model showed that there was no relationship between seed number per pod and the weight of 100 seeds with plant size. Each pod would produce almost 24 seeds in canola (Figure 4D) and the weight
of 100 seeds was 305 mg (Fig 4E). Similar
results were also obtained for S. arvensis
(Figure 5). Relationships among number of produced seeds in individual plant, number of produced pods in individual plant and produced seeds (g per plant) and plant size (g per plant) could be properly describe by power equation
inasmuch as R2
coefficients were 0.95, 0.94 and 0.86, respectively (Figure 5A to C). The
a and b parameters estimate of power equation
for S. arvensis are presented in Figure 5A to E.
Plant sizes of 1, 10 and 100 g per plant would produce approximately 28, 526 and 9,884 seeds per plant, respectively and number of produced pods would be approximately 6, 94 and 1560 per plant (Figure 5A and B). Plant sizes of 1, 10 and 100 g per plant would produce 0.04, 0.8 and 16 g seeds per plant (Figure 5C).
Number of seeds number per pod of S. arvensis
increased linearly by increasing plant size (0.01 seed per g per plant), and the weight of
100 seeds increased 0.23 mg linearly by
increasing plant size (Figure 5D and E).
Different methods had been used to estimate seed production in different species. Sester et al. (2004) evaluated weed beet growth and reproduction at a wide range of plant
densities and in various crops(winter wheat,
spring barley, spring pea, sugarbeet, maize and ryegrass). Those authors related bolting rate to flower and seed production per plant to
density by using y = 1/(1 + a . densityb). Poggio
et al. (2005) examined the effect of radiation and temperature during the seed set period on pod number per square meter (PN) and seed
0 20 40 60 80 100 120 140 160 180
0 50 100 150 200
Density (plants m-2)
P lant s ize (g m -2)
y = 251.6x-0.6373
R2= 0.89**
Volunteer canola
y = 483.08x-0.8581
R2= 0.93**
0 20 40 60 80 100 120 140 160 180
0 50 100 150 200
Density (plants m-2)
P lant s ize (g per p la n) Sinapis arvensis 0 20 40 60 80 100 120 140 160 180
0 50 100 150 200
Density (plants m-2)
P lant s ize (g m -2)
y = 251.6x-0.6373
R2= 0.89**
Volunteer canola
y = 483.08x-0.8581
R2= 0.93**
0 20 40 60 80 100 120 140 160 180
0 50 100 150 200
Density (plants m-2)
P lant s ize (g per p la n) Sinapis arvensis
number per square meter (SN) during grain filling on unit seed weight in field pea. They
showed that both PN and SN were strongly
correlated with the mean daily value of the photothermal quotient (PQ = incident
radiation/ (mean temperature “ base temperature)) for the seed-setting phase. Forcella et al. (2000) studied seed production
of weedy species of Setaria in maize and
soybean and indicated that viable seed
(B) (A)
y = 130.58x0.9431 R2= 0.93**
0 2,000 4,000 6,000 8,000 10,000 12,000 14,000 16,000 18,000
0 50 100 150 200
Plant size (g per plant)
Num
ber
of
s
ees
d
p
er
pl
ant
y = 5.78x0.9289 R2= 0.92**
0 100 200 300 400 500 600 700 800
0 50 100 150 200
Plant size (g per plant)
Num
b
er
of
pods
per
p
la
nt
y = -0.17x + 310.29 R2= 0.03ns
0 50 100 150 200 250 300 350 400 450
0 50 100 150 200
Plant size (g per plant)
W
e
ight
of
100
s
eeds
(m
g
)
y = 0.01x + 23.37 R2= 0.02ns
10 12 14 16 18 20 22 24 26 28 30
0 50 100 150 200
Plant size (g per plant)
Num
b
er
of
s
e
eds
per
p
od
(D)
y = 0.27x1.0125
R2= 0.98**
0 10 20 30 40 50 60
0 50 100 150 200
Plant size (g per plant)
S
e
ed
prod
uc
ti
on
(g
per
pl
ant
) (C)
(E)
production in Setaria was curvilinearly related to panicle length.
Some researchers have used a simple method to estimate seed production by weed
dry matter at harvest. Thompson et al. (1991) demonstrated a strong linear relationship between reproductive and vegetative weight. Cousens & Mortimer (1995) related fecundity to plant size by using a simple allometric
y = 27.96x1.2742
R2= 0.95**
0 2000 4000 6000 8000 10,000 12,000 14,000 16,000 18,000
0 20 40 60 80 100 120
Num
ber
of
s
eeds
per
pl
ant
y = 5.61x1.2222
R2= 0.94**
0 200 400 600 800 1,000 1,200 1,400 1,600 1,800
0 20 40 60 80 100 120
num
ber
of
pods
per
pl
ant
y = 0.04x1.2983
R2= 0.86**
0 2 4 6 8 10 12 14 16 18
0 20 40 60 80 100 120
S
eed
prod
uc
ti
on
(g
per
pl
ant
)
y = 0.01x + 5.49 R2= 0.27**
0 1 2 3 4 5 6 7 8 9
0 20 40 60 80 100 120
S
eeds
num
ber
per
p
od
y = 0.23x + 137.24 R2= 0.09* 0
20 40 60 80 100 120 140 160 180 200
0 20 40 60 80 100 120
Plant size (g per plant)
W
e
ight
of
100
s
eeds
(m
g)
Plant size (g per plant) Plant size (g per plant)
Plant size (g per plant) Plant size (g per plant)
(B) (A)
(D) (C)
(E)
Figure 5 - Relationships between plant traits and plant size in Sinapis arvensis. Plant traits are: number of seeds per plant (A),
equation s = cWk
for many species, in which
W = plant weight, s = seed number and c and
k = parameters. Some recent works also
statedhat seed production is related to plant size (Lutman, 2002; Grundy et al., 2004; Nurse
& DiTommaso, 2005; Franke et al., 2007).
Lutman (2002) used linear regression to quantify seed production of Sinapis arvensis, Tripleurospermum inodorum and Stellaria media.
Grundy et al. (2004) showed that a linear
relationship was adequate between logarithm
of Chenopodium album seed production and
logarithm of biomass which was robust over a range of competitive situations with onion and cabbageat different planting densities and in several growing seasons. Nurse & DiTommaso (2005) indicated that seed production of velvetleaf increased as biomass increased in a linear regression. Franke et al. (2007) observed that total seed weight had a strong linear correlation with the aboveground biomass of the mother plant and individual seed weight. It was little affected by the weight of the mother plant, however.
Overall, the results in this study indicated that there is an adequate relationship between seed production and plant size in both species. This relation is a key element in the construction of weed population dynamics models and the seed production of the
volunteer canola and S. arvensis which can
be used in the models (e.g. GENESYS by Colbach et al., (2001a, b) Sester et al., (2008) ALOMYSYS by Colbach et al. (2006). Weed population dynamic models can be used to explore the effect of management on weed numbers (Rasmussen et al., 2002). One key stage in the dynamics of weed population is the return of produced weed seeds back into the soil seed-bank. This study also will be helpful for future studies of volunteer canola and S. arvensis biology and ecology.
LITERATURE CITED
CARVALHO, S. J. P. et al. Growth, development and seed production of Chloris polydactyla.Planta Daninha, v. 23, n. 4, p. 603-609, 2005.
COLBACH, N. et al. GENESYS: a model of the influence of cropping system on gene escape from herbicide tolerant rapeseed crops to rape volunteers. I. Temporal evolution of a population of rapeseed volunteers in a field. Agric. Ecosyst. Environ.,v.83, n. 3, p. 235-253, 2001a.
COLBACH, N. et al. GENESYS: A model of the influence of cropping system on gene escape from herbicide tolerant rapeseed crops to rape volunteers. II. Genetic exchanges among volunteer and cropped populations in a small region. Agric. Ecosyst. Environ., v. 83, n. 3, p. 255-270, 2001b.
COLBACH, N. et al. AlomySys: Modelling black-grass (Alopecurus myosuroides Huds.) germination and emergence, in interaction with seed characteristics, tillage and soil climate I. Construction. Europ. J. Agron., v. 24, n. 2, p. 95-112, 2006.
COUSENS, R. D.; MORTIMER, A. M. Dynamics of weed populations. Cambridge: Cambridge University Press, 1995. 348 p.
FORCELLA, F. et al. Estimating seed production of three
Setaria species in row crops. Weed Sci.,v. 48, n. 4, p. 436-444, 2000.
FRANKE, A. C. et al. Phalaris minor seedbank studies: longevity, seedling emergence and seed production as affected by tillage regime. Weed Res.,v.47, n. 1, p. 73-83, 2007.
GRUNDY, A. C. et al. Seed production of Chenopodium album in competition with field vegetables. Weed Res.,v. 44, n. 4, p. 271-281, 2004.
GULDEN, R. H. et al. Harvest losses of canola (Brassica napus) cause large seedbank inputs. Weed Sci.,v. 51, n. 1, p. 83-86, 2003.
KNOTT, C. M. Control of volunteer oilseed rape in peas. In: BRIGHTON CROP PROTECTION CONFERENCE-WEEDS, 1993, Brighton. Proceedings… Brighton, 1993. p. 889-894.
LAWSON, A. N.; FRIESEN, L. F. Emergence timing of volunteer canola in spring wheat fields in Manitoba. Weed Sci., v. 54, n. 5, p. 873-882, 2006.
LUTMAN, P. J. W. Estimation of seed production by Stellaria media, Sinapis arvensis and Tripleurospermum inodorum in arable crops. Weed Res., v. 42, n. 5, p. 359-369, 2002.
LUTMAN, P. J. W.; LÓPEZ-GRANADOS, F. The
persistence of seeds of oilseed rape (Brassica napus). Aspects Appl. Biol.. v. 51, n. 2, p. 147-152, 1998.
NURSE, R. E.; DITOMMASO, A. Corn competition alters the germinability of velvetleaf (Abutilon theophrasti ) seeds.
Weed Sci.,v. 53, n. 4, p. 479-488, 2005.
PACALA, S. W.; SILANDER, J. A. Field tests of neighborhood population dynamic models of two annual weed species. Ecol. Monogr., v. 60, n. 2, p. 113-134, 1990.
RASMUSSEN, I. A. et al. Computer model for simulating the long-term dynamics of annual weeds under different
cultivation practices. In: WORKSHOP ON PHYSICAL AND CULTURAL WEED CONTROL, 5., 2002, Pisa.
Proceedings… Pisa: 2002. p. 6-13, 2002.
SESTER, M. et al. Crop and density effects on weed beet growth and reproduction. Weed Res., v. 44, n. 1, p. 50-59, 2004.
SESTER, M. et al. GeneSys-Beet: A model of the effects of cropping systems on gene flow between sugar beet and weed beet. Field Crops Res., v. 107, n. 3, p. 245-256, 2008.
SIMARD, M. J. The frequency and persistence of volunteer Canola (Brassica napus) in Québec cropping systems. Weed Technol., v. 16, n. 2, p. 433-439, 2002.
SOLTANI, A. Application of SAS in statistical analysis. Mashhad: JDM Press, 2007. (In Persian, programs in English)
THOMAS, A. G.; LEESON, J. Y. Persistence of volunteer wheat and canola using weeds survey data [abstract]. In: EXPERT COMMITTEE ON WEEDS, 1999, Ottawa. Proceedings… Sainte-Anne-de-Bellevue, QC, Canada: Expert Committee on Weeds, 1999. p. 94.
THOMPSON, B. K. et al. Size dependent reproductive output in agricultural weeds. Canad. J. Bot., v. 69, n. 3, p. 442-446, 1991.
WARWICK, S. I. et al. The biology of canadian weeds. 8.
Sinapis arvensis. L. (updated). Canad. J. Plant Sci., v. 80, n. 6, p. 939-961, 2000.
WATKINSON, A. R. et al. Modelling the population dynamics of the annual plant Sorghum intrans in the wet–dry tropics. J. Ecol., v. 77, n. 2, p. 162-181, 1989.
WEINER, J. et al. How important are environmental maternal effects in plants? A study with Centaurea maculosa. J. Ecol., v. 85, n. 2, p. 133-142, 1997.
WULFF, D. Seed-size variation in Desmodium paniculatum. I. Factors affecting seed size. J. Ecol., v. 74, n. 1, p. 87-97, 1986.
ZEINALI, E.; EHTESHAMI, M. R. Biology and control of important weed species. Gorgan: Iran GUASNR, 2004. (In Persian)