Article
J. Braz. Chem. Soc., Vol. 26, No. 5, 899-909, 2015. Printed in Brazil - ©2015 Sociedade Brasileira de Química 0103 - 5053 $6.00+0.00
A
*e-mail: [email protected]
Kinetic Investigation of Thermal Formation Processes of SiOC Glasses Derived
from C-Containing Hybrid Polymeric Networks
Naiara V. Godoy and Mariana G. Segatelli*
Departamento de Química, Universidade Estadual de Londrina (UEL), Rodovia Celso Garcia Cid, km 380, 86050-482 Londrina-PR, Brazil
In this study, hybrid polymeric networks were prepared by hydrosilylation reaction as precursors to silicon oxycarbide (SiOC) glass. The polymeric networks were prepared from poly(methylsiloxane) (PMS) and divinylbenzene (DVB) in the 80:20 and 20:80 (PMS/DVB) compositions, with or without activated charcoal (AC), which was used as additional carbon source. Following, polymeric precursors were pyrolysed at 1000 °C, under Ar atmosphere, resulting in SiOC glasses. The effectiveness of the hydrosilylation reaction was evaluated by infrared spectroscopy. The degradation reactions and activation energy (Ea) obtained during polymer-to-glass conversion were investigated by thermogravimetric analysis applying Ozawa method for the determination of the Ea. In addition, the influence of the matrix composition and the presence of the C in both degradation processes and structure of the final products were reported. SiOC glasses were characterized by X-ray diffraction and Raman and 29Si nuclear magnetic resonance spectroscopies.
Keywords: silicon oxycarbide, activation energy, Ozawa method, hybrid polymeric networks, degradation process
Introduction
Controlled pyrolysis of polymeric precursors has been widely applied in the production of silicon oxycarbide glasses (SiOC) owing to its advantages over the conventional method of solid state reactions,1 such
as low processing temperatures, final structures with greater homogeneity, higher purity and the possibility of obtaining materials in different shapes. SiOC are commonly prepared from polysiloxanes, a class of Si-containing polymers with great variety of derivates available and when they are accordingly crosslinked, give rise to materials with high thermal stability and ceramic yield.2,3 Besides, these polymers can provide
an easy and inexpensive route to the formation of the networks with reduced shrinkage and cracking, inherent features of the materials prepared by sol-gel process.4,5
Some chemical methods for preparing Si-based precursors have been reported and the proper choice depends on the chemical composition of the macromolecular chain. The sol-gel process, for example, is the only one that allows producing precursors yielding stoichiometric or nearly stoichiometric SiOC upon pyrolysis. Hydrosilylation,
however, is the preferred reaction for the crosslinking of polymer-derived ceramics (PDC) because it improves the ceramic yield, does not produce by-products, which would have to be removed from system after reaction, and it is the one that takes place at the lowest temperature.6 All
methods established in the literature reveal that controlled pyrolysis of polysiloxanes networks leads to ceramics comprising SiO4-xCx together with a separate carbon phase.
Silicon oxycarbide glass structure, in turn, is characterized by random distribution of tetrahedral silicon sites bonded to carbon and/or oxygen atoms, generating possible SiO4, SiO3C, SiO2C2, SiOC3 and SiC4 sites.
7,8
Additionally, there is a dispersed carbon phase, known as residual or free carbon (Cfree) that promotes the black
color of the final material and, consequently, this last one is named as black glass.9,10 This phase is generated
by incomplete degradation of organic groups, initially contained in the polymeric precursors. In this way, the proportion of the Cfree phase can be controlled based on the previous selection of the precursors, allowing producing carbon-poor or -rich SiOC.11,12 Unsaturated groups, such
as phenyl, vinyl and aromatic organic molecules, attached at Si-based polymeric chain, normally generate excess of the Cfree amount when compared to polymeric precursors
In the early 1980s, when polymer-derived ceramics began to be investigated, the overall formation of the Cfree phase, including the amount, distribution and the
growth mechanism, was not the main focus of researches. Actually, the aim of numerous studies was to reduce the excessive formation of the Cfree phase, once this secondary
phase, considered a negative issue for some applications, resulted in materials with low resistance to oxidation.14 In
addition, the mechanical and electrical properties of the PDC were considered dependent on the carbon content and its distribution.15,16 Nowadays, there is much interest
in the production of C-enriched SiCO because they have shown potential applications as negative eletrodes for lithium-ion batteries. This specific electrochemical behavior has been mainly justified by the presence of the Cfree phase.
17-19 The carbon content and its corresponding
structure have showed great importance to enhance electrochemical performance of the polysiloxanes-derived SiOC. It is known that Cfree evolved during
organic-inorganic transformation, by pyrolysis under inert atmosphere, exhibits a 3-D percolating cage-like structure or isolated carbon clusters in C-rich and -poor SiOC, respectively.11,16 Some routes for synthesizing C-enriched
SiOC derived from Si-based polymers have already been employed, including the use of phenyl-rich Si-polymers,20
tri-functional alkoxysilanes with phenyl and methyl substituents in different molar ratios,21 addition of carbon
or carbon-rich precursor to Si-polymers22,23 and chemical
modification of Si-polymers.18 In spite of this residual
carbon phase is widely employed on understanding of these potential applications, at the best of our knowledge, its influence with relation to kinetic of thermal formation processes from Si-based polymers to corresponding SiOC glasses has not been explored yet. Furthermore, this issue was not also reported with relation to the presence of an extra carbon source in the C-rich and -poor SiOC glasses. This study involves the preparation of C-rich and -poor SiOC derived from hybrid polymeric precursor composed by poly(methylsiloxane) (PMS) and divinylbenzene (DVB), in different molar ratios, in the presence or absence of activated charcoal as additional carbon source. The effectiveness of hydrosilylation reaction between PMS and DVB to formation of the polymeric networks and the organic-inorganic transformation that occurs during the thermal decomposition process were evaluated. In addition to this, the influence of activated charcoal in both cases was also investigated. The kinetic study was performed by Ozawa method,24 which provides the activation energy
(Ea) involved in each step of the degradation process. The
structural characterization of the final glasses obtained after pyrolysis process of the polymeric precursors at
1000 °C was performed by X-ray diffraction (XRD) and Raman and nuclear magnetic resonance (29Si MAS NMR)
spectroscopies.
Experimental
Starting materials
Poly(methylsiloxane) (PMS, [HSi(CH3)O]n Mn =
1700-3200 g mol−1), divinylbenzene (DVB), activated
charcoal (AC) Norit® and platinum(0)-1,3-divinyl-1,1,3,3-tetramethyldisiloxane complex solution, 0.05 mol L−1 in
poly(dimethylsiloxane), vinyl terminated. All the reagents were acquired by Sigma-Aldrich (São Paulo, Brazil).
Synthesis and pyrolysis of the hybrid polymeric precursors
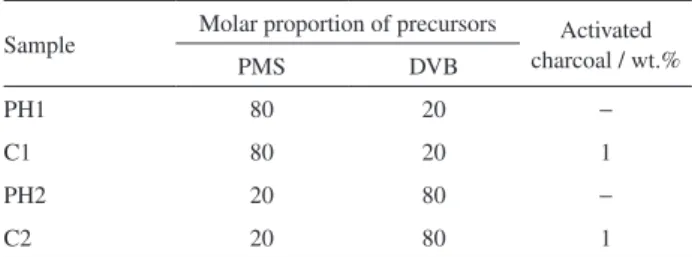
The hybrid polymeric network was obtained by hydrosilylation reaction between PMS and DVB catalyzed by Pt(0)-complex, with or without adding 1 wt.% activated charcoal. The polymeric networks were produced in four different compositions, as shown in Table 1. The relative proportion of PMS and DVB starting reagents was chosen to generate polymeric networks with different amounts of aromatic carbon bridges and they follow the relation of Si−H:C=C molar ratios.
The production of the hybrid polymeric precursors was performed according to the procedure described by Segatelli et al.25 The curing time was 40 h at room
temperature and additional curing was carried out at 100 °C for 8 h. The activated charcoal-containing hybrid polymeric precursors were prepared by the same procedure, with the addition of 1 wt.% AC after the addition of PMS. The viscous solution obtained in this step was cast in steel mold of 0.6 × 0.8 × 12 cm and pressed at 100 °C for 2 h at 8 MPa. The corresponding silicon oxycarbide glasses were obtained by pyrolysis under flowing argon (about 20 mL min−1) in an adapted tubular
alumina furnace (EDG10P-S) with a heating/cooling rate of 2 °C min−1 and a holding time of 60 min at the final
temperature of 1000 °C.
Table 1. Compositions of the PMS/DVB/charcoal polymeric networks
Sample Molar proportion of precursors Activated
charcoal / wt.%
PMS DVB
PH1 80 20 −
C1 80 20 1
PH2 20 80 −
Characterization techniques
The thermal degradation of the precursors was investigated by a thermogravimetric analyser (TGA 4000, Perkin Elmer) operating at various heating rates (2, 5, 10 and 20 °C min−1) from 25 to 900 °C, under flowing nitrogen of
20 mL min−1. The thermogravimetric measurements were
conducted using 14-15 mg of samples. The activation energy (Ea) for each thermal degradation process of the samples
was determined by the Ozawa method,24 an isoconversional
method in nonisothermal conditions. The method relates the logarithm of the temperature rate (β) with the inverse of the absolute temperature (T) to certain mass loss, as shown in equation 1, where R is the ideal gas constant.24,26
( )
log
0.457 1/
a
d E
d T R
β
= − (1)
The mass loss is represented by the residual mass fraction (1 −α), with α = (m0 – mT)/(m0 – mf), where α is the
degree of conversion, m0 is the initial mass, mT is the mass
at T temperature and mf is the final mass of the process.
For PH1 and C1, there are two overlapped steps between 400 and 800 °C, which will be considered in this study as a single degradation step. To investigate the behavior of charcoal phase in the DVB-rich and -poor matrices, another TG experiment was performed under flowing synthetic air of 20 mL min−1 at temperature rate of 20 °C
min−1, from 25 to 900 °C, followed by an isothermal step
of 120 min at the final temperature. The structural evolution from hybrid polymeric network to SiCxOy glasses was
monitored by Fourier transform infrared spectrophotometer (FT-IR) (IR Prestige-21, Shimadzu), using the conventional KBr pellet method for solid samples and ATR Flat Plate (ZnSe 45 degrees, Shimadzu), for PMS and DVB liquid precursors. The first method was operated in the absorption mode between 4000 and 400 cm−1, whilst for the ATR, the
range considered was between 4000 and 700 cm−1. All IR
spectra were exhibited after baseline correction and they were not normalized. The characterization of the SiOC glasses was investigated by 29Si MAS NMR and Raman
spectroscopies and XRD. 29Si NMR spectra were recorded
on a Bruker spectrometer (Advance III - 400 MHz), operating at 79.49 MHz for 29Si nucleus, applying the magic
angle spinning (MAS 54.74°). The analyses were acquired employing the high power decoupling (HPDEC) method. The recycle delay used for 29Si one-pulse experiments
was 30 s and acquisition time of 40.96 ms. Micro-Raman spectroscopy measurements were performed using a spectrometer (Horiba, model LabRAM HR) coupled with an OLYMPUS microscope (model BX41). Laser light at
514.5 nm from an Ar source was used for excitation. XRD patterns were recorded on a Rigaku diffractometer, model Ultima IV, operating at 40kV and 20 mA, with Cu Kα
radiation (λ = 0.154 nm).
Results and Discussion
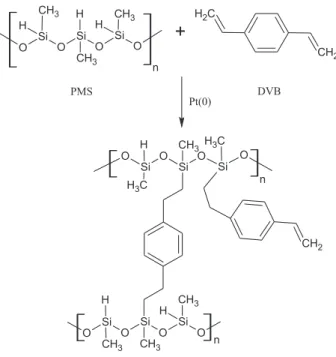
The Pt(0)-complex catalyzed hydrosilylation reaction between PMS and DVB basically involves the addition of a Si−H bond to the unsaturated C=C group, giving rise to crosslinked PMS chains by the formation of 1,4-diethylfenilene bonds, as represented in Figure 1.
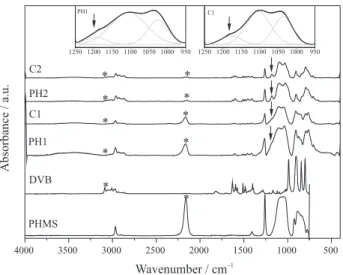
The effectiveness of the hydrosilylation reaction was confirmed by comparative analysis of IR spectra of the DVB and PMS starting reagents and those for produced hybrid polymeric precursors, as shown in Figure 2. It is observed that the hybrid precursors maintained the characteristics bands, but in lower intensity as expected, of the DVB and PMS starting reagents, such as νC−H (C=C) (3055 cm−1)
from the first one and νSi−O−Si (1080-1020 cm−1) and
νSi−H (2160 cm−1) from PMS.27 The weak absorption at
about 1180 cm−1, related to νSi−CH
2,27 corresponds to
Si−CH2−CH2−phenyl bond, formed during the reaction. As
can be seen in Figure 2, this band is clearly defined just for the PH2 and C2 samples, while for PH1 and C1 is only possible to observe it by deconvolution of the band from νSi−O−Si, as illustrated in the insets of Figure 2, since the referred band appears as a shoulder on the left side of this one.
CH2 C
H2
+
SiO O Si O Si O
CH3 H
CH3 CH3
H H
PMS
Pt(0)
DVB
n
C H3 O
Si O
Si H
O Si
O CH3 H3C
CH2
Si
O O
Si O Si
O
CH3 H
CH3
CH3 H
n
n
PMS/DVB hybrid polymeric network
Besides these observations, the reaction was evaluated by the comparative relation between the νSi−H (2160 cm−1)
and δCH3 (Si−CH3) (1260 cm−
1) absorptions, since Si−CH 3
is a completely inactive bond in the hydrosilylation reaction. By comparing Si−H/Si−CH3 intensity ratio of the
pristine PMS (which possesses 100% of Si−H free bonds, e.g., uncrosslinked) with the polymeric networks, the reduction of this ratio indicates the consumption of Si−H bonds. The relative intensity of the νSi−H and δCH3 bands
for PMS and samples are, respectively: 1.23 and 1.34 for PMS, 0.37 and 0.56 for PH1, 0.23 and 0.34 for C1, 0.03 and 0.40 for PH2 and 0.03 and 0.31 for C2. All samples presented values lower than pristine PMS ratio, confirming that reaction occurred successfully.
PH1 and C1 samples showed ceramic yields higher than PH2 and C2, presenting values equal to 84, 83, 61 and 56%, respectively, as can be seen in Figure 3. This result was expected since PH1 and C1 samples are composed by high amounts of inorganic component (PMS) taking into account that polysiloxanes are more thermally stable (Si−O: 450 kJ mol−1 and Si−C: 325 kJ mol−1).28,29
As described, PH1 and C1 did not exhibit significant differences in the ceramic yield values, indicating that the activated charcoal in the 80:20 (PMS/DVB) matrix did not change both thermal stability of the material and the crosslinking process between PMS and DVB. This behavior suggests that the charcoal possesses higher physical adherence in the matrix during the hydrosilylation reaction, staying encapsulated inside it. However, the presence of the charcoal in the matrix with higher DVB-content promoted a reduction of the thermal stability as well as the decrease in the ceramic yield (Figure 3). In this case, the high organic
groups-content associated with the lower crosslinking degree of the hybrid polymer resulted in a more exposed and less adhered dispersed charcoal phase to the matrix, which justifies the reduction of the two parameters.
The behavior of the activated charcoal inside the matrices was investigated by a TG experiment, under flowing synthetic air, as shown in Figure 4.
PH1 and C1 samples did not presented differences in oxidation resistance, showing the same thermal stability and residue of 73%, however, C2 revealed thermal stability lower than PH2, in spite of both present 37% of residue. Therefore, these two different behaviors of the charcoal in the hybrid matrices confirm the hypothesis of the better adhesion of this phase in the 80:20 matrix in relation to the opposite composition, where it seems to be more exposed, as previously suggested. The isothermal behavior (not shown) indicated higher resistance to oxidation for SiOC materials than expected, revealing mass losses below 3% 4000 3500 3000 2500 2000 1500 1000 500
*
* *
* *
*
*
* *
C2
PH2
Absorbance / a.u.
Wavenumber / cm-1
PHMS DVB PH1 C1
*
1250 1200 1150 1100 1050 1000 950 PH1
1250 1200 1150 1100 1050 1000 950 C1
Figure 2. IR spectra of DVB and PMS starting reagents and the PH1, PH2, C1 and C2 polymeric precursors. The arrows indicate the absorption of
νSi−CH2 and the insets show the deconvolution of 1250-950 cm−1 region for PH1 and C1 ; *represents the main bands associated to DVB (νC-H, 3055 cm-1) and PMS (νSi-H, 2160 cm-1).
100 200 300 400 500 600 700 800 900
60 70 80 90 100
56% 61% 83%
M
a
ss
/
%
Temperature / °C PH1
C1 PH2 C2
84%
Figure 3. TG curves for the PH1, C1, PH2 and C2 hybrid polymeric networks, under nitrogen atmosphere.
100 200 300 400 500 600 700 800 900
40 50 60 70 80 90 100
M
a
ss
/
%
Temperature / °C PH1
C1 PH2 C2
for all samples during 120 min under synthetic air. The oxidation resistance of the SiOC glass produced in this study was higher when compared to carbon-enriched SiOC glass30 and carbon-poor SiOC glass31 derived from
PMS/DVB polymeric networks with high DVB and PMS contents, respectively.
Another explanation for the higher ceramic yield observed for the samples with high PMS-content (PH1 and C1) was the additional crosslinking that can occur after hydrosilylation reaction. At the 80:20 (PMS:DVB) composition there is an excess of Si−H bonds in relation to C=C from DVB, so the curing process at room temperature for 40 h and 8 h at 100 °C or at 100 °C for 2 h during the pressing process, can promote parallel reactions such as de-hydrogen coupling parallel reactions.25 In these
reactions, the Pt-catalyst induces reactions between the excess Si−H bonds and environmental moisture, producing Si−OH bonds that, by posterior condensation reactions, will generate Si−O−Si bridges among PMS chains, as represented by equations 2-4:32,33
( )
2 2g
Si H H O Si OH H
≡ − + Pt-catalyst ≡ − + (2)
( )
2 Pt-catalyst
g
Si H Si OH Si O Si H
≡ − + ≡ − ≡ − − ≡ + (3)
2
Heat
Si OH Si OH Si O Si H O
≡ − + ≡ − ≡ − − ≡ + (4)
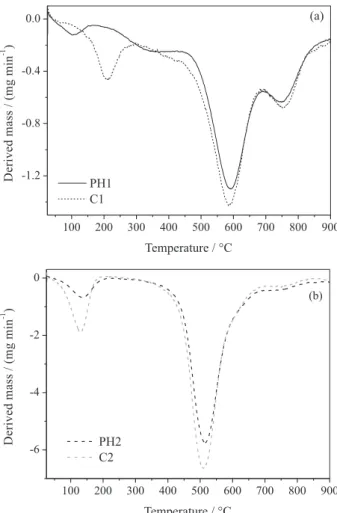
Figure 5 illustrates the DTG curves for all samples. As can be seen, the 80:20 and 20:80 (PMS:DVB) matrices displayed similar profile, with basically three main thermal degradation processes for the first composition and two processes for the second one. The first degradation process for PH1 and C1 (Figure 5a) occurred with temperature at the maximum degradation rate (Tmax) at 108 and 210 °C,
respectively. For PH1, the mass loss was associated with water adsorbed at material surface as well as the volatilization of DVB molecules occluded in the polymeric network.34,35
However, the shift for higher temperatures observed for C1 can be related to the release of organic compounds anchored at activated charcoal surface (as can be verified by the IR spectrum, TG and DTG curves of activated charcoal exhibited in the Supplementary Information (SI) section).
The second degradation process, with Tmax around
590 °C for both samples (Figure 5a), was associated with the degradation of the organic groups, such as CH3 and CH2,
derived from the cleavage of Si−C, C−C and C−H bonds from Si−CH3 and Si−CH2−CH2 groups.25,34,35 After cleavage,
the structures formed can rearrange themselves during the heating process, resulting in unsaturated species embedded in the matrix. Soon after, the degradation of aromatic rings takes place, once these are more thermally stable than
other organic groups.25,34 The last process, with T
max around
750 °C, corresponds to the degradation of organic structures producing carbonyl molecules such as CO2, as a result of
the oxidation processes, and the mineralization step of the residual polymer. In this last step, redistribution reactions of the different silicon sites can also occur and, subsequently, originate SiOxCy,
30,35 with the respective ceramic yields
of 84 and 83% for PH1 and C1, as previously described. For samples with higher organic component amount (Figure 5b), the first degradation occurs with Tmax at 130 °C,
which was referred to the volatilization of DVB molecules occluded in the polymeric network and the liberation of organic compounds, as mentioned above. The second process was promoted at 515 °C (Tmax) because, at these
compositions, there are DVB molecules in excess, which are not crosslinked among the PMS chains, becoming easier to be degraded. The excess of vinyl groups in relation to Si−H bonds also justifies the displacement to lower temperatures as well as the higher intensity of this degradation process. These groups, in turn, are susceptible to participate of thermally induced free radical reactions giving rise to new organic groups with different sizes in
100 200 300 400 500 600 700 800 900
-1.2 -0.8 -0.4 0.0
D
e
ri
v
ed
m
a
ss
/
(m
g
m
in
-1 )
Temperature / °C PH1
C1
(a)
100 200 300 400 500 600 700 800 900
-6 -4 -2 0
D
e
ri
v
ed
m
a
ss
/
(m
g
m
in
-1 )
Temperature / °C PH2
C2
(b)
the polymeric network. The third degradation process is almost imperceptible for PH2 and C2, due to the lower PMS-content in the structure and, consequently, the ceramic yields of these samples are lower than those verified for PH1 and C1 (Figure 3).
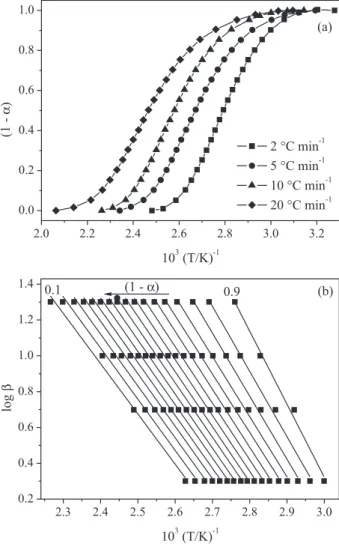
The first degradation for PH2 sample was chosen to illustrate the calculations of the Ozawa method. In Figure 6 is exhibited the range of (1 −α) as a function of 1/T (Figure 6a) and Ozawa plot (Figure 6b), represented by the linear adjust of log βversus 1/T to each value of (1 −α), with great linearity.
The average values of Ea of each thermal degradation
process for the prepared samples were calculated by the mean of Ea found for each value of (1 −α) ranging from
0.1 to 0.9 and they are presented in Table 2. The values of Ea found for the second process for all samples are close
to that observed for poly(dimethylsiloxane) (PDMS) (about 209 kJ mol−1),36 which presents structure similar to
PMS. Samples with higher DVB-content exhibited lower Ea than the PMS-rich samples, similar profile verified by
Deshpande and Rezac37 after the incorporation of phenyl
groups in polysiloxanes backbones. The reduction of Ea
verified for 20:80 (PMS:DVB) follows the knowledge of decreased thermal stability of polysiloxanes with increasing of phenyl content.38 The lower activation energy
of the samples with higher DVB-content suggests that the dominant degradation reaction has been changed,37 mainly
for the second degradation process.
Figure 7 shows the relation between Ea and degree of
conversion (α). The increase of Ea with the extension of
reaction is typical of polymers,39,40 since the dependence
of Ea on the extent of degradation indicates a complex
degradation process, i.e., a degradation occurring in multi-steps.41 On the contrary, the independence of E
a with
α indicates a simple process, composed by single-step degradation,41 which was observed for PH1, PH2 and C2
at first degradation process, as can be seen in Figure 7. Therefore, from the average values of Ea (Table 2) and the
profiles obtained from Figure 7, the greater complexity of the degradation for the second process was confirmed in relation to the first one, as expected, due to typical degradation reactions previously discussed for these materials.
All samples exhibited activation energy values lower than Si−C and Si−O bond energies (325 and 450 kJ mol−1,
respectively), suggesting that the global degradation process is governed by kinetic considerations, although there is a contribution from molecular structure by thermodynamic aspect due to the high crosslinking density, mainly for PH1 and C1.42
C1 showed Ea higher than PH1 for both degradation
processes, which is probably related to the distribution and interaction of the activated charcoal phase in the hybrid polymeric network. As previously mentioned, this behavior suggests that the dispersed charcoal phase is more adhered in the more crosslinked structure and, probably, encapsulated in it, making the degradation process slower.40,42 The increase of E
a with the presence of
charcoal does not follow the behavior of thermal stability,
2.0 2.2 2.4 2.6 2.8 3.0 3.2
0.0 0.2 0.4 0.6 0.8 1.0
(a)
2 °C min-1
5 °C min-1
10 °C min-1
20 °C min-1
(1
-α
)
103(T/K)-1
2.3 2.4 2.5 2.6 2.7 2.8 2.9 3.0 0.2
0.4 0.6 0.8 1.0 1.2 1.4
0.9
lo
g
β
103(T/K)-1
0.1 (1 -α) (b)
Figure 6. Residual mass fraction of the first degradation for PH2 versus
the inverse of absolute temperature (a) and Ozawa plots for (1 −α) values ranging from 0.1 to 0.9, with R values above 0.99 (b).
Table 2. Average values of Ea of the degradation processes for all samples
Sample Ea / (kJ mol
−1)
First process Second process
PH1 64.80 202.46
C1 94.62 211.15
PH2 57.69 189.92
which was similar for both PH1 and C1 (Figure 3). In spite of the charcoal promotes a delay towards gel point during hydrosilylation reaction, by physical hindrance, it did not change the crosslinking degree, by comparison of Si−H/Si−CH3 absorbance intensity ratio, and ceramic yield
of both samples, as described. So, as the network structure was not changed by adding charcoal, the thermal stability profiles of these materials remained the same.
For PH2 and C2 samples, the charcoal did not promote significant changes of Ea in the first process. However, its
incorporation resulted in lower values of Ea for the second
degradation. This can be explained by lower adherence of carbon phase in the network, making easier the degradation process and acting in opposite direction to protective effect observed by the presence of charcoal in the more densely crosslinked matrix (C1). As can be observed, the decrease of Ea with the presence of the charcoal follows the reduction
of ceramic yield and thermal stability of these materials (Figure 3).
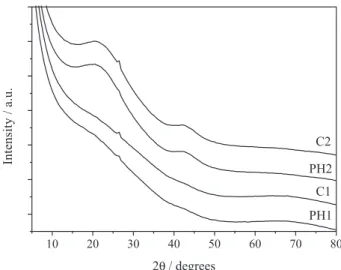
The XRD patterns of the corresponding SiOC glasses derived from the hybrid polymeric networks (Figure 8)
exhibited a broad halo centered at around 23° (2θ), assigned to opaline silica, typical of non-crystalline SiOC and a weak signal at ca. 26.5°, related to diffraction of (002) graphitic carbon plane within the free carbon phase.31 Furthermore,
a broad hump around 43° (2θ) was observed, mainly for high-DVB samples, and corresponds to (100) graphitic carbon planes.31 The broadening of this peak is related
to graphene sheets randomly displaced, characteristic for disordered carbons, suggesting the existence of hexagonal networks layers with low regularity of carbon, i.e., presence of turbostratic carbon.17,43-45 XRD patterns state
the dispersion of ordered and mainly disordered carbon together with opaline silica in the non-crystalline matrix, especially for PH2 and C2, since the signals are not so evident for PH1 and C1, as verified in Figure 8.
Raman spectroscopy was employed to investigate the structural behavior of the segregated carbon phase within SiOC matrices with different compositions. Raman spectra recorded for all samples exhibited two typical sharp modes of disordered graphite-like carbon in SiOC samples: D- and G-bands around 1330 and 1585 cm−1. The D mode has
A1g symmetry and corresponds to the breathing mode of
aromatic rings but it is forbidden in perfect graphite, being active in the presence of structural disorder; the G mode has E2g symmetry and is related to in-plane bond-stretching
of the C-sp2 pairs, being active for all C-sp2 sites, but not
necessarily requires the presence of sixfold rings.46,47
Therefore, the D mode is associated with low repeatability of the carbon structures and the G mode is related to the repetitive structures of the crystal.48
In all spectra, the integral intensity of the D-band is stronger than that of the G-band, demonstrating the carbon phase of predominant amorphous and disordered nature, as
0.1 0.2 0.3 0.4 0.5 0.6 0.7 0.8 0.9 60
90 120 150 180 210 240 270 300
A
c
ti
v
at
io
n
e
n
e
rg
y
/
(k
J
m
o
l
-1 )
Degree of conversion (α)
PH1 first process C1 first process PH1 second process C1 second process
(a)
0.1 0.2 0.3 0.4 0.5 0.6 0.7 0.8 0.9 60
90 120 150 180 210 240
A
c
ti
v
at
io
n
e
n
e
rg
y
/
(k
J
m
o
l
-1 )
Degree of conversion (α)
PH2 first process C2 first process PH2 second process C2 second process
(b)
Figure 7. Relation between the activation energy (kJ mol−1) and the degree
of conversion (α) for the PH1 and C1 (a) and PH2 and C2 (b). 10 20 30 40 50 60 70 80
In
te
n
si
ty
/
a
.u
.
2θ / degrees
PH1 C1 PH2 C2
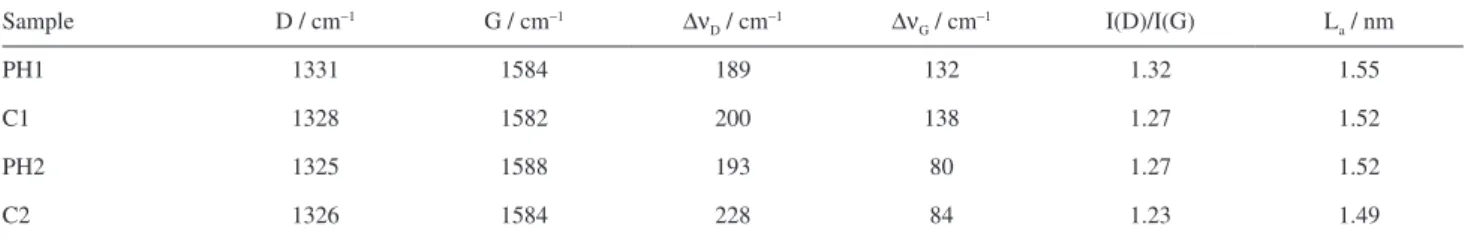
already suggested by XRD patterns. It is well established that narrow full width half-maxima (FWHM) of D-band is related to the ordering process within the Cfree phase, while
the position of G-band is affected by the amount of C-sp3
sites in this phase.47,49 C-rich samples revealed the presence
of more disordered carbon clusters than the corresponding C-poor samples, as verified by the widest width of the D-band in Table 3. All samples presented similar amount of defects, originated by C-sp3 sites, as can be seen by close
values of the G-bands positions.
The carbon-cluster size was estimated by Ferrari and Robertson’s equation,47 proposed to investigate the
completely disordered amorphous carbon phase containing mainly C-sp2 bonds, with low number of ordered rings. It
is interesting to notice that all samples presented the same lateral size of graphitic domains, around 1.5 nm (Table 3). This indicates that the free carbon phase, produced by adding high DVB content or activated charcoal does not influence on the graphitic domains size, but probability on their amounts. It seems that there are a larger number of carbon-clusters in structures with greater amount of DVB and activated charcoal, however, there are not clusters with larger sizes.46
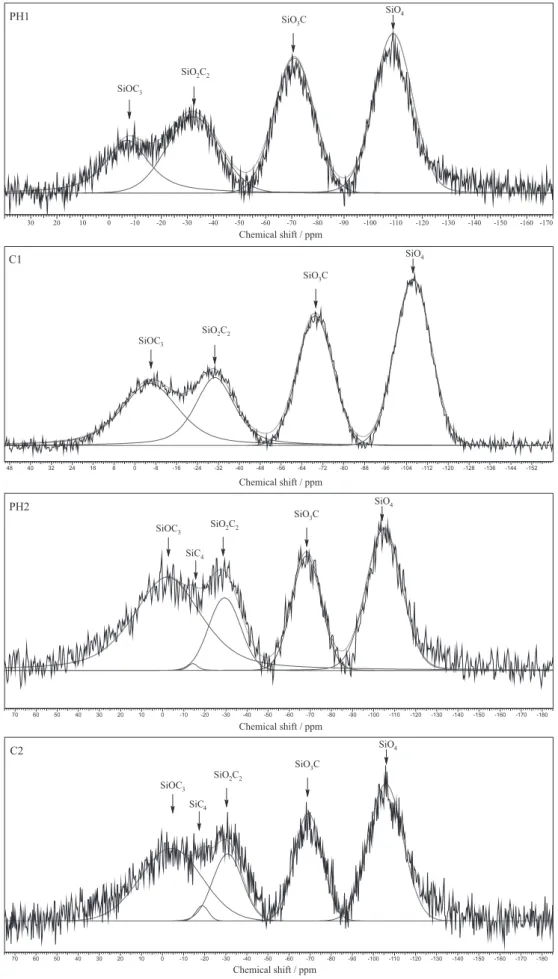
29Si MAS NMR spectra of SiOC glasses are reported
in Figure 9. In order to identify more clearly the bands, the deconvolution of the peaks by straight baseline correction and the mixed Gaussian-Lorentzian functions were carried out. The samples displayed typical profile of SiOC disordered glass network with broad peaks at ca. −107,
−69, −31, −17 and −2 ppm, corresponding to the different Si-units: SiO4 (Q), SiO3C (T), SiO2C2 (D), SiC4 (C) and
SiOC3 (M), respectively. 7,46
PH2 and C2 showed five signals corresponding to Si-units, while PH1 and C1 did not present the signal assigned to SiC4 unit. This result implies that the increase in the
carbon content, promoted by adding DVB in PH2 and C2 samples, enabled the production of the SiC4 unit.
On the contrary, the limited amount of carbon generated by PMS-rich samples did not favor the growth of the silicon carbide (SiC) thermodynamically stable phase. The presence of the extra carbon source did not promote
significant changes on the microstructure of the respective poor- and rich-DVB matrices, as regards to the distribution of Si-mixed units and non-crystalline and crystalline phases. According to this result, the microstructure showed to be only influenced in the presence of carbon at molecular level when compared to charcoal dispersed phase, which presented changes on the thermal stability, due to its distribution in the polymeric matrices containing different crosslinking degrees.
Conclusions
In the present study, PMS/DVB hybrid polymeric networks were prepared in the presence or absence of activated charcoal as an additional carbon source. The influence of charcoal on the hydrosilylation reaction, degradation process and microstructure of final products, obtained after pyrolysis, was evaluated.
PMS-rich samples showed higher thermal stability as well as ceramic yield when compared to corresponding PMS-poor samples, owing to elevated crosslinking degree. In this composition, the charcoal did not influence the hydrosilylation reaction, as observed for DVB-rich sample. In the degradation processes, the activated charcoal showed a positive influence in the PMS-rich sample resulting in higher activation energy (Ea) values,
while it decreased in the opposite composition. The kinetic experiments allowed to verify higher Ea for the second
degradation process than the first one, as expected. The lower Ea of the degradation steps demonstrates their
occurrence principally by kinetic considerations, with thermodynamic influence for PH1 and C1. The final SiOC glasses also exhibited differences in structure and composition due to the distinct compositions and crosslinking degrees.
Samples based on the SiOC system exhibit a wide range of potential applications at high temperatures, including sensors, coatings, components for electrical heating, anode materials in Li-ion batteries, fibers and ceramic-matrix composites. These applications are related to chemical nature of the precursors and phases formed Table 3. Raman data for positions of D- and G-bands, half-height width of D and G bands (∆νD and ∆νG), I(D)/I(G) ratio and carbon-cluster size (La) for SiOC glasses obtained from PH1, C1, PH2 and C2
Sample D / cm−1 G / cm−1 ∆ν
D / cm−1 ∆νG / cm−1 I(D)/I(G) La / nm
PH1 1331 1584 189 132 1.32 1.55
C1 1328 1582 200 138 1.27 1.52
PH2 1325 1588 193 80 1.27 1.52
30 20 10 0 -10 -20 -30 -40 -50 -60 -70 -80 -90 -100 -110 -120 -130 -140 -150 -160 -170
PH1 SiO
3C
SiO2C2
SiOC3
SiO4
48 40 32 24 16 8 0 -8 -16 -24 -32 -40 -48 -56 -64 -72 -80 -88 -96 -104 -112 -120 -128 -136 -144 -152
C1
SiO3C
SiO2C2
SiOC3
SiO4
70 60 50 40 30 20 10 0 -10 -20 -30 -40 -50 -60 -70 -80 -90 -100 -110 -120 -130 -140 -150 -160 -170 -180
PH2
SiO3C SiO2C2
SiOC3
SiO4
Chemical shift / ppm Chemical shift / ppm Chemical shift / ppm
SiC4
70 60 50 40 30 20 10 0 -10 -20 -30 -40 -50 -60 -70 -80 -90 -100 -110 -120 -130 -140 -150 -160 -170 -180
C2
SiO3C
SiO2C2 SiOC3
SiO4
Chemical shift / ppm SiC4
in the thermally stable matrix. Materials revealing high resistance to oxidation can also be obtained if the rearrange and distribution of Cfree phase within matrix becomes
appropriate. In this way, the production of new ceramic materials employed for protecting substrate surfaces against oxidation and corrosion is considered a relevant research field, and in this way, the respective degradation processes need to be investigated.
Supplementary information
Supplementary spectra are available free of charge at http://jbcs.sbq.org.br as PDF file.
Acknowledgments
The authors are grateful to UEL, CAPES, LABESPEC-UEL, IQ-UFRJ, CETEM, UNICENTRO/CEDETEG and Centro Multiusuário UNESP-IBILCE.
References
1. Campostrini, R.; D’Andrea, G.; Carturan, G.; Ceccato, R.; Sorarù, G. D.; J. Mater. Chem. 1996, 6, 585.
2. Michalczyk, M. J.; Farneth, W. E.; Vega, A. J.; Chem. Mater.
1993, 5, 1687.
3. Colombo, P.; Riedel, R.; Riedel, G. M.; Sorarù, G. D.; J. Am. Ceram. Soc. 2010, 93, 1805.
4. Radovanovic, E.; Gozzi, M. F.; Gonçalves, M. C.; Yoshida, I. V. P.; J. Non-Cryst. Solids 1999, 248, 37.
5. Gumula, T.; Paluszkiewicz, C.; Blazewicz, S.; J. Anal. Appl. Pyrolysis 2009, 86, 375.
6. Nyczyk-Malinowska, A.; Wójcik-Bania, M.; Gumuła, T.; Hasik, M.; Cypryk, M.; Olejniczak, Z.; J. Eur. Ceram. Soc.
2014, 34, 889.
7. Renlund, G. M.; Prochazka, S.; Mater. Res. Soc. Symp. Proc.
1991, 6, 2723.
8. Pantano, C. G.; Singh, A. K.; Zhang, H.; J. Sol-Gel Sci. Technol.
1999, 14, 7.
9. Renlund, G. M.; Prochazka, S.; Mater. Res. Soc. Symp. Proc.
1991, 6, 2716.
10. Kroll, P.; J. Non-Cryst. Solids 2005, 351, 1121.
11. Kleebe, H.-J.; Blum, Y. D.; J. Eur. Ceram. Soc. 2008, 28, 1037. 12. Bréquel, H.; Parmentier, J.; Walter, S.; Badheka, R.;
Trimmel, G.; Masse, S.; Latournerie, J.; Dempsey, P.; Turquat, C.; Desmartin-Chomel, A.; Le Neindre-Prum, L.; Jayasooriya, U. A.; Hourlier, D.; Kleebe, H.-J.; Sorarù, G. D.; Enzo, S.; Babonneau, F.; Chem. Mater. 2004, 16, 2585. 13. Mutin, P. H.; J. Sol-Gel Sci. Technol. 1999, 14, 27.
14. Brewer, C. M.; Bujalski, D. R.; Parent, V. E.; Su, K.; Zank, G. A.; J. Sol-Gel Sci. Technol. 1999, 14, 49.
15. Bakumov, V.; Blugan, G.; Roos, S.; Graule, T.; Fakhfouri, V.; Grossenbacher, J.; Gullo, M.; Kiefer, T.; Brugger, J.; Parlinska, M.; Kuebler, J.; J. Eur. Ceram. Soc. 2012, 32, 1759. 16. Cordelair, J.; Greil, P.; J. Eur. Ceram. Soc. 2000, 20, 1947. 17. Kaspar, J.; Graczyk-Zajac, M.; Riedel, R.; J. Power Sources
2013, 244, 450.
18. Dibandjo, P.; Graczyk-Zajac, M.; Riedel, R.; Pradeep, V. S.; Soraru, G. D.; J. Eur. Ceram. Soc. 2012, 32, 2495.
19. Graczyk-Zajac, M.; Mera, G.; Kaspar, J.; Riedel, R.; J. Eur. Ceram. Soc. 2010, 30, 3235.
20. Liu, X.; Zheng, M.-C.; Xie, K.; Liu, J.; Electrochim. Acta 2012,
59, 304.
21. Wilamowska, M.; Pradeep, V. S.; Graczyk-Zajac, M.; Riedel, R.; Sorarù, G. D.; Solid State Ionics 2014, 260, 94.
22. Ji, F.; Li, Y.-L.; Feng, J.-M.; Su, D.; Wen, Y.-Y.; Feng, Y.; Hou, F.; J. Chem. Mater. 2009, 19, 9063.
23. Fukui, H.; Ohsuka, H.; Hino, T.; Kanamura, K.; ACS Appl. Mater. Interfaces 2010, 2, 998.
24. Ozawa, T.; Bull. Chem. Soc. Jpn. 1965, 38, 1881.
25. Segatelli, M. G.; Pires, A. T. N.; Yoshida, I. V. P.; J. Eur. Ceram. Soc. 2008, 28, 2247.
26. Koga, N.; J. Therm. Anal. Calorim. 2013, 113, 1527. 27. Colthup, N. B.; Daly, L. H.; Wiberley, S. E.; Introduction to
Infrared and Raman Spectroscopy, 3th ed.; Academic Press Inc.:
San Diego, 1990.
28. Jovanovic, J. D.; Govedarica, N.; Dvornic, P. R.; Popovic, I. G.;
Polym. Degrad. Stab. 1998, 61, 87.
29. Camino, G.; Lomakin, S. M.; Lazzari, M.; Polymer 2001, 42, 2395.
30. Blum, Y. D.; MacQueen, D. B.; Kleebe, H.-J.; J. Eur. Ceram. Soc. 2005, 25, 143.
31. Segatelli, M. G.; Radovanovic, E.; Pires, A. T. N.; Gonçalves, M. C.; Yoshida, I. V. P.; Mater. Chem. Phys. 2010, 124, 1216.
32. Rangarajan, S.; Aswath, P. B.; J. Mater.Sci. 2011, 46, 2201. 33. Bahlouol-Hourlier, D.; Latournerie, J.; Dempsey, P.; J. Eur.
Ceram. Soc. 2005, 25, 979.
34. Pinho, R. O.; Radovanovic, E.; Torriani, I. L.; Yoshida, I. V. P.;
Eur. Polym. J. 2004, 40, 615.
35. Rocha, R. M.; Cairo, C. A. A.; Graça, M. L. A.; Mater. Sci. Eng., A 2006, 437, 268.
36. Li, H.; Liu, S.; Zhao, J.; Li, D.; Yuan, Y.; Thermochim. Acta
2013, 573, 32.
37. Deshpande, G.; Rezac, M. E.; Polym. Degrad. Stab. 2002, 76, 17.
38. Zhou, W.; Yang, Y. H.; Guo, X.; Lu, J.; Polym. Degrad. Stab.
2006, 91, 1471.
39. Tutas, M.; Saglam, M.; Yüksel, M.; Güler, Ç.; Thermochim. Acta 1987, 111, 121.
40. Chiang, C.-L.; Chang, R.-C.; Chiu, Y.-C.; Thermochim. Acta
41. Vyazovkin, S.; Sbirrazzuoli, N.; Macromol. Rapid Commun.
2006, 27, 1515.
42. Schiavon, M. A.; Redondo, S. U. A.; Pina, S. R. O.; Yoshida, I. V. P.; J. Non-Cryst. Solids 2002, 304, 92.
43. Tzeng, S.-S.; Hung, K.-H.; Ko, T.-H.; Carbon 2006, 44, 859. 44. Liu, X.; Yang, Y.; Ji, W.; Liu, H.; Zhang, C.; Xu, B.; Mater.
Chem. Phys. 2007, 104, 320.
45. Gao, P.; Hu, P.; Wang, W.; Gong, W.; J. Ceram. Proc. Res. 2010,
11, 297.
46. Kleebe, H.-J.; Gregori, G.; Babonneau, F.; Blum, Y. D.; MacQueen, D. B.; Masse, S.; Int. J. Mater. Res. 2006, 96, 699.
47. Ferrari, A. C.; Robertson, J.; Phys. Rev. B: Condens. Matter Mater. Phys. 2000, 61, 14095.
48. Gonçalves, E. S.; Rezende, M. C.; Baldan, M. R.; Ferreira, N. G.; Quim. Nova 2009, 32, 158.
49. Peña-Alonso, R.; Mariotto, G.; Gervais, C.; Babonneau, F.; Soraru, G. D.; Chem. Mater. 2007, 19, 5694.