Thermal Expansion Contribution to the Temperature Dependence
of Excitonic Transitions in GaAs and AlGaAs
S. A. Lourenc¸o,
1I. F. L. Dias,
1J. L. Duarte,
1E. Laureto,
1L. C. Poc¸as,
1D. O. Toginho Filho,
1and J. R. Leite,
2 1Departamento de F´ısica, Universidade Estadual de Londrina, UEL, CP6001, CEP 86051-970, Londrina, PR, Brazil
2
Instituto de F´ısica, Universidade de S˜ao Paulo, IFUSP, CP 66318, S˜ao Paulo, 05315-970, SP, Brazil
Received on 21 July, 2003. Revised version received on 5 November, 2003
Photoluminescence and photoreflectance measurements have been used to determine excitonic transitions in the ternary AlxGa1
−xAs alloy in the temperature range from 2 to 300 K. The effect of the thermal expansion contribution on the temperature dependence of excitonic transitions for different aluminum concentrations in the AlxGa1
−xAs alloy is presented. Results from this study have shown that the negative thermal expansion (NTE) in the AlxGa1
−xAs alloy, in the low temperature interval, induces a small blueshift in the optical transition energy. In the temperature range from∼23 to∼95 K there is a competition between the NTE effect and the electron-phonon interaction. Using the thermal expansion coefficient in the 2 – 300 K temperature range, the thermal expansion contribution to GaAs, at room temperature, represents 21% of the total shift of the excitonic transition energy. After subtracting the thermal expansion contribution from the experimental temperature dependence of the excitonic transitions, in the AlxGa1−xAs alloy, the contribution to the electron-phonon interaction of the longitudinal optical phonon increases, relatively to the longitudinal acoustical phonon, with increasingAlconcentration.
1
Introduction
The GaAs and its related alloy AlxGa1−xAs form a very
important family of semiconductor materials used as active elements in many types of high performance optoelectronic and high-speed electronic devices [1,2]. One of the most important parameter of any semiconductor material is the band-gap energy. In AlxGa1−xAs alloys, the lowest
band-gap energy at low aluminum concentration,0 ≤x≤0.45, is a direct energy gap located at theΓpoint of the Brillouin zone, and its temperature and aluminum dependency have been the focus of many researches in the last years. The temperature dependence of the band-gap energy, in special, can be explained by the sum of two distinct mechanisms: the electron-phonon interaction and the lattice thermal expan-sion. The main contribution to the temperature dependence of the band-gap energy is attributed to electron-phonon in-teractions [3-6]. This effect can also be broken up into two contributions: the effect of the second-order electron-phonon interaction taken to first order in perturbation theory – the so-called Debye-Waller terms, and the effect of the first-order electron-phonon interaction taken to second or-der in perturbation theory – the Fan terms [4,5]. According to some researches, the contribution of the thermal expan-sion at room temperature varies between 2% and 20% in most of the semiconductor materials [6,7]. However, in the GaAs and InxGa1−xAs with low indium concentration (x=
0.06 andx= 0.15), the thermal expansion mechanism con-tributes with 40% to 45% to the total band-gap energy re-duction [8,9], which is higher than the contribution of other
semiconductor materials. Despite this significant contribu-tion to the temperature dependence in the band-gap energy or its related excitonic transition energy, the thermal expan-sion mechanism is not, generally, taken into account in the analysis of the temperature dependence of the band-gap en-ergy [9-13].
Furthermore, an interesting phenomenon related to the lattice thermal expansion, the negative thermal expansion (NTE), takes place in many tetrahedral semiconductors at low temperatures [14-17]. This apparent anomalous behav-ior is observed in many direct band-gap semiconductors as the binary materials of III-V group, GaAs [15], InP [15], AlSb [21], GaSb [21], InAs [22], and InSb [23]; and in the binary and ternary materials of II-VI group, Hg1−xCdxTe
and Hg1−xZnxTe [24], as well as in semiconductor
mate-rials with indirect band-gap energy as Si [18]. This non-monotonic dependence on T is attributed to the negative Gr¨uneissen parameters of the transverse acoustical (TA) phonon branches near the limit of the Brillouin-zone [14-16,19,20]. As well as the thermal expansion mechanism, the effect of the negative thermal expansion on semiconduc-tor materials has not been generally take into account in the analysis of the temperature dependence of the band-gap en-ergy.
In this work, we present a study of the optical transi-tions temperature dependence in the GaAs and AlGaAs in the temperature range from 2 to 300 K. Photoluminescence (PL) and photoreflectance (PR) techniques are used to study the optical transitions in bulk GaAs and AlxGa1−xAs at
Vi˜na [25] and P¨assler [9,26] models are used to fit the tem-perature dependence of the excitonic transitions energy. The effect of the thermal expansion (TE) on all the temperature range (2 – 300 K) and of the NTE on the low temperature range (T<100K) are analyzed. We show that it is necessary to take into account the thermal expansion coefficient in all the temperature range (0 – 300 K) for the present analysis of the temperature dependence of the band-gap energy for Al-GaAs semiconductor materials in the 2 – 300 K temperature range.
2
Experimental details
Three nominally undoped 0.3-µm-thick AlGaAs samples were grown by molecular-beam epitaxy (MBE) on a 0.2-µm-thick GaAs buffer and on an undoped semi-insulating (100)-GaAs substrate. The aluminum compositions were 0.17, 0.30 and 0.40. The experimental data atx= 0 were redigitalized from the work of Lautenschageret al. [27]. Excitonic transitions in AlGaAs alloy were determined by PL at temperatures up to 130 K and by PR at higher tem-peratures. The photoluminescence measurements were car-ried out between 2 and 130 K in a He flow cryostat (JA-NIS, Optical SuperVari.Temp. model 7.7C) equipped with a Lake Shore temperature controller (Model 805) using the 441.6 nm line of an He-Cd laser as the excitation source, with an intensity of∼20 W/cm2
. The emission spectra were analyzed with a 0.5 m monochromator and detected by a liquid N2 cooled Ge photodetector, using standard lock-in techniques. The photoreflectance was measured with a con-ventional system consisting of a white light from a tung-sten lamp disperse through a 0.5 m focal length monochro-mator shining onto the sample at an incident angle of ap-proximately 45o. The optical modulation was provided by the 632.8 nm line of an He-Ne laser beam mechanically chopped at a frequencyf = 200 Hz and incident at an an-gle of 30o. A long pass filter of 665 nm cut off was used
to prevent scattered radiation from the laser to overwhelm the detector. Specular reflection light was detected using a Si photodiode, whose signal was fed in a lock-in amplifier (STANFORD SR 510) tuned to 200 Hz. The signal was pro-cessed by a microcomputer to obtain∆R/R as a function of photon energy. Temperature dependent PR measurements were carried out by mounting the sample on the cold fin-ger of a liquid nitrogen variable temperature cryostat, whose temperature can be varied between 85 and 330 K. The sam-ple temperature was measured from 130 K to 300 K with a calibrated copper-constantan thermocouple in good thermal contact with the sample. The uncertainty in the temperature determination is estimated to be±1.5 K and the tempera-ture stability during each spectrum was better than±1 K. The composition of the layer was determined by the Double Crystal X-Ray Diffraction at a 0.5% accuracy rate [28].
3
Theoretical models
Many analytical models used to describe the temperature de-pendence of the band-gap energy have been developed in the last decades [9,25]. A recent work [29] pointed out that the Vi˜naet al.[25] and the P¨assler [9] models are the most suitable ones to fit the temperature dependence either of the band-gap energy or of the excitonic transition energy. The Vi˜na approach is defined by the expression:
Eg(T) =EB−aB
1 + 2 exp(ΘB/T)−1
(1)
whereaBrepresents the strength of the electron-phonon
in-teraction, ΘB ≡ w/kB is the characteristic temperature
parameter representing the effective phonon energy on the temperature scale [11,25] andEg(T = 0) =EB−aB. The
P¨assler [9] model is characterized by the expression:
Eg(T) =Eg(T = 0)−
αΘ 2
p
1 +
2T
Θ p
−1
(2)
whereEg(T = 0)is the energy gap at zero Kelvin
tem-perature, α ≡ S(∞) ≡ −(dE(T)/dT)T−→∞ is the
high-temperature limit value for the forbidden gap entropy [30,31],Θis a characteristic temperature parameter of the material representing the effective phonon energy w ≡ kBΘin units of absolute temperature (similar to theΘB
de-fined for the Vi˜na model), andpis an empirical parameter related to the shape of the electron-phonon spectral func-tions [9,32]. In this work, Eg(T)represents the excitonic
transitions energy in bulk GaAs and AlGaAs. We work with excitons in the GaAs and AlGaAs alloys to obtain direct experimental evidence of transitions and to avoid possible errors due to the composition dependence of the excitonic binding energies in the these alloys [10]. The least-square fit was used as an accuracy criterion in the description of the experimental data point fits.
The variation of the band-gap energy with temperature induced by thermal expansion,∆Eth(T), can be written as
[8,33-35]:
∆Eth(T) =−3B
∂E
∂P
T
T
0
αth(T,)dT, (3)
where B is the bulk modulus,dE/dpis the pressure-induced band-gap shift andαth(T)is the linear thermal expansion
coefficient. Taking into account the contribution of the TE, the equations (1) and (2) can be rewritten as:
Eg(T)−∆Eth(T) =EB, −a , B
1 + 2 exp(Θ,B/T)−1
(4) and
⌋
Eg(T)−∆Eth(T) =E,g(T = 0)−
α,Θ,
2
p
1 +
2T
Θ,
p
−1
The parameters EB,, a,B,Θ,B;E,
g(T = 0), α,,Θ, obtained
from the fit of these expressions are related exclusively to the electron-phonon interaction mechanism of the semicon-ductor material.
4
Results and discussion
Figure 1(A) shows the PL spectra for the AlxGa1−xAs
al-loy withx= 0.30 at 2 K, 77 K, and 130 K. The PL peak energy at 1.889 eV, with 7.1 meV of full width at half maxi-mum (FWHM), is identified as being due to the bound exci-ton (BE) recombination. At low temperatures, the PL spec-trum of the alloy is dominated by the excitonic recombi-nation. At 77 K, the thermal population of the higher en-ergy states is favored, thus, the band-to-band recombination is observed. Both excitonic and band-to-band recombina-tion energy peak posirecombina-tion were obtained by the least-square fits, using a number of appropriate transitions. These tran-sitions are represented by the dotted lines in Fig. 1(A). The solid lines represent the total fits (linear superposition of the dotted lines). Even with the strong contribution of the band-to-band recombination at higher temperatures, the excitonic recombination can still be identified. These re-sults are similar to those obtained by Grilliet al.[12] for the GaAs. The PL peak energy at 1.869 eV with 28.2 meV of FWHM, is associated with the recombination due to impu-rity states. The recombination involving the impurities has its intensity reduced by the increase in the temperature, dis-appearing at temperatures above 120 K. This is a classical behavior of impurity and has been observed by many re-search groups [36-38]. Additionally, the impurity nature of the lower energy PL peak was verified by analyzing its be-havior as a function of the excitation intensity (not shown in this paper). It is known that in MBE grown films carbon impurities incorporate into the lattice and produce an accep-tor state approximately 20 meV below the GaAs gap [36-38]. In our samples, the acceptor impurities are identified by its position in energy as being carbon (e, Ao). The signal obtained by PL technique decreases in temperatures above 150 K, making difficult to identify the transitions properly. So, the PR technique was used in the 130 to 300 K tem-perature range. The Fig. 1(B) shows the PR experimental spectra at different temperatures. Experimental line shape in low field PR can be fitted by expression of the type [39-41]: ∆R/R= Re[Ceiϕ(E−E
g+iΓ)
−n
], whereCis an amplitude coefficient,ϕis a phase factor,E is the photon energy,Eg is the transition energy andΓis the broadening
parameter. The exponentnis a parameter that depends on the type of critical point. According to Aspnes [39], n= 2, 2.5 and 3 for an exciton or impurity in bulk material, a 3D band-to-band, and a 2D band-to-band transition, respec-tively. The least-square fits of the PR spectrum presents two components that are quite close in energy at all measured temperatures. These components have been observed in all AlGaAs samples discussed in this text. The inset of Fig. 1B shows these components for sample #3 at 300 K. These components were identified as conduction-band-to-acceptor and excitonic transitions. Several research groups have also
reported the observation of impurity and excitonic compo-nents in the PR spectra at room temperature [42-47].
Figure 1. PL and PR spectra of the Al0.30Ga0.70As alloy are shown at different temperatures. Fig.1(A) shows the PL spectra at 2, 77 and 130 K. At 2 K there are two radiative channels (dotted lines) identified as the recombination from the conduction band to the carbon acceptor state with peak at 1.869 eV and the bound ex-citon recombination with peak at 1.889 eV. At 77 K another ra-diative channel appears along the side of highest energy, identi-fied as the band-to-band transition. The solid lines are the total fit for the experimental data (linear superposition of the dotted lines). Fig.1(B) shows the PR spectra for the following temper-atures:130, 150, 270 and 300 K. The squares are the experimental points and the solid lines are the least-square fits using the line shape∆R/R= Re[Ceiϕ(E−E
g+iΓ)−n][39-41].
Due to the different physical processes involved in the different techniques, a difference in energy, called “Stokes shift”, is expected. However, some researchers have ob-served that, either at sufficiently high-excitation intensity or at adequately high temperatures [48-51], the energy dif-ference between the photoluminescence spectrum and the absorption (or photoreflectance) spectrum of some semi-conductor alloys with a random distribution, such as the AlxGa1−xAs, is nearly null. In this work the
photore-flectance spectra were obtained for temperatures over 130 K and for alloy with a random distribution (homogeneous samples) [50]. Therefore, a negligible Stokes shift between the PL and PR spectra has been observed [29].
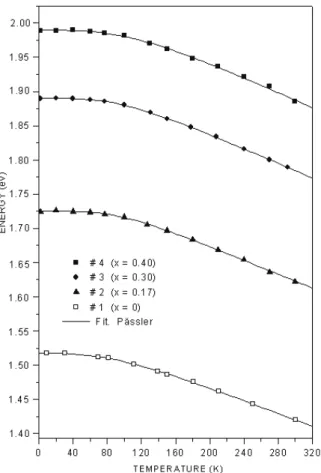
Figure 2 shows the temperature dependence of excitonic transitions in the GaAs and AlxGa1−xAs alloys atx= 0.17,
TABLE I. Parameters of the Vi˜na and P¨assler expressions obtained from temperature dependence fits of excitonic transitions in the AlxGa1−xAs and GaAs materials.
Sample EB (meV)
Eg(T = 0) (meV)
aB (meV)
α(10−4 eV/K)
ΘB (K) Θ (K)
kBΘB(meV)
kBΘ(meV) p
#1 (x= 0) 1576.6±1.6 1517.6±1.1
59.7±7.4
4.9±0.2
241±7
203±8
20.7 17.5
– 2.85
#2(x= 0.17) 1802.4±4.1 1725.1±0.6
76.9±4.4
5.1±0.1
275±11
208±9
23.7 17.9
– 4.0
#3(x= 0.30) 1975.7±2.2 1890.0±0.3
85.9±2.3
5.5±0.1
289±6
220±7
24.9 18.9
– 3.5
#4(x= 0.40) 2081.2±4.6 1989.7±0.6
94.4±4.8
5.9±0.1
317±10
275±9
27.3 23.7
– 2.9
Figure 2. The experimental temperature dependence of the exci-tonic transitions in AlxGa1−xAs samples (#1, #2, #3, #4) at differ-ent aluminum compositions (x= 0.0, 0.17, 0.30, 0.40). The solid lines are least-squares fits of the P¨assler model [Eq.(2)].
A large series of experimental papers have discussed the fitting of the temperature dependence of excitonic transi-tions in semiconductor materials within the framework of the electron-phonon interaction only (the thermal expan-sion mechanism of the lattice is not taken into account) [9,10,11,32]. Moreover, the negative thermal expansion phenomenon can give important contributions to the vari-ation of the excitonic transitions energy with temperature in the low temperatures range (T<100 K). The importance of this contribution to GaAs is shown in Fig. 3. Fig. 3A shows the experimental data points of the thermal
expan-sion coefficients,αth(T), for the GaAs, obtained by Soma
et al.[15]. A good fit for the thermal expansion coefficient was obtained using a polynomial expansion under the fol-lowing condition: αth = 0 anddαth/dT = 0atT = 0
K. The negative thermal expansion is observed in the tem-perature range from 10 to 70 K, reaching its maximum at T ∼= 45K(αth ∼= −0.5·10
−6
K−1
). The energy shift, ∆Eth(T), associated with the thermal expansion is shown
in Fig. 3B. The solid curve in Fig. 3B represents the cal-culation of the energy shift, using expression (3) with the thermal expansion coefficient,αth(T), as a function of
tem-perature as shown in Fig. 3A. The energy variation induced by the TE, consideringαth(T), is practically null up to∼23
K. In the temperature range from 23 to 61 K, however, it in-creases due to the NTE effect, and finally dein-creases at higher temperatures. The dash-dotted line represents∆Eth(T)
cal-culated by the expression (3) withαth(T = 300K). The
energy variation with temperature induced by the TE, con-sideringαth(T = 300K), is linear and decreases in all the
temperatures range. The approach that considers a constant valueαth(T = 300K)at all temperature interval has been
discussed in several papers [8,52,53]. A large difference be-tween the two curves can be seen in almost all the temper-ature range, except at the T = 0K point. The difference between the two curves increases up to∼135 K and tends to display a constant value of approximately 18.5 meV at higher temperatures.
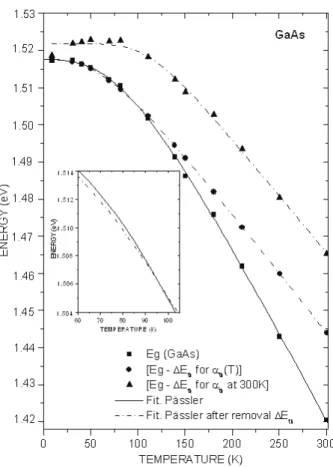
The temperature dependence of the excitonic transitions for GaAs in the 2 – 300 K temperature range is shown in Fig. 4. The solid squares represent the experimental data of the excitonic transitions dependence with temperature. The circles [triangles] represent the experimental points obtained by subtracting∆Eth(T)using αth(T)[αth(T = 300K)]
from the experimental values ofEg(T). The solid line
TABLE II. Parameters of the Vi˜na and P¨assler models obtained from temperature dependence fits of excitonic transitions in the AlxGa1 −xAs atx= 0.0, 0.17, 0.30, and 0.40 compositions, taking into account the thermal expansion contribution effects.
Sample E
, B (meV)
E,g(T= 0) (meV)
a,B (meV)
α,(10−4 eV/K)
Θ,B (K) Θ,
(K)
kBΘ,B(meV)
kBΘ,(meV) p
#1 (x= 0) 1547.5±4.5 1517.6±0.06
30.2±0.5
3.4±0.01
175±2
153±1
15.1 13.2
– 2.85
#2 (x= 0.17) 1776.2±1.7 1725.0±0.09
51.1±1.9
3.7±0.01
251±6
183±14
21.6 15.7
– 4.0
#3 (x= 0.30) 1944.7±1.1 1889.9±0.3
54.9±1.1
4.0±0.09
253±4
194±1
21.8 16.7
– 3.5
#4 (x= 0.40) 2048.0±2.3 1989.5±0.09
59.0±2.5
4.2±0.05
276±7
240±2
23.8 20.7
– 2.9
Figure 3. Fig. 3A shows the temperature dependence of the lin-ear thermal expansion coefficient for the GaAs obtained by Soma
et al. (open square) [15]. The solid curve represents a fit of ex-perimental points using a polynomial expansion. Fig. 3B shows the energy shift∆Eth(T)defined by the equation (3) associated to the temperature dependence of the thermal expansion. The solid and dash-dotted curves represent the curves using∆Eth(T), es-timated with a temperature dependence thermal expansion coef-ficientαth(T)and with a constant thermal expansion coefficient αth(T = 300K), respectively.
parameterpwere kept the values obtained before subtract-ing the thermal expansion contribution. The fittsubtract-ing of the (Eg−∆Eth)curve by the P¨assler and the Vin˜a expressions,
usingαth(T = 300K), is not as good as that usingαth(T).
The Eg(T)values, minus the energy shift ∆Eth(T),
cal-culated by the different approaches [αth(T = 300K)or
αth(T)], differ considerably in all the temperature range.
Different values of the thermal expansion contribution to the shift of the band-gap energy in GaAs atT= 300 K has been reported in the literature. Walteret al. [7], for example, ob-tained a contribution of only 13%. However, as observed by Gopalanet al. [54], Walter’s calculations completely ig-nored the contribution of the Fan term to the shift of the band gap withT. This result overestimates the shift of the band gap in GaAs by about 60 meV when the temperature is
Figure 4. Temperature dependence of the GaAs excitonic transi-tions (solid square). The circles and triangles represent the ex-perimental points minus∆Eth(T) usingαth(T)and αth(T = 300K), respectively. The solid lines represent a least-square fits using the P¨assler models [Eq.(2)] while the dash-dotted curves rep-resent least-square fits using the P¨assler model minus the thermal expansion contribution of the lattice.
the procedure adopted by Hennel in obtaining the thermal dilation contribution to GaAs. A larger value, 44%, was ob-tained for the thermal dilation contribution to the GaAs at T = 300 K [9]. The calculations used to obtain the value of 44% were based on the data listed in Table I in Biernacki’s
et al. article [34], which usedαthas constant at T = 300 K
to estimate∆Eth(T), and the experimental values dE/dT, at
room temperature; in a similar procedure to the one adopted by Hennel. High values of the thermal dilation contribu-tion were also obtained for other semiconductor materials with the constant value of the linear thermal expansion co-efficient,αth(T = 300K). For example, Hanget al. [8]
have estimated in 45% the thermal dilation contribution to the shift of the band-gap energy in InGaAs at T = 873 K. Using the adjustment parameters obtained from fittings in Ref. [8], we verified that the 45% value can be obtained even at 300 K, remaining practically constant at higher tempera-tures. Using the expression (3) and the thermal expansion coefficient,αth(T), in all the temperature interval (0 – 300
K), we obtained an intermediate value (21 %) for the con-tribution of the TE to the band-gap energy of GaAs at T = 300 K. This result shows the importance of considering the αth(T)and the experimental valueEg(T)of (instead of the
slope dE/dT) in all the temperature range when calculating the energy shift associated with the TE,∆Eth(T).
As the inset of Fig. 4 shows, the fit curve, after subtract-ing the thermal expansion contribution withαth(T), is
be-low the fit curve of the band-gap energy,Eg(T), in the range
from 23 K to 95 K. This behavior originates from the NTE and it shows that the NTE induces the gap to vary at higher energies (blueshift) in the temperature range where the NTE takes place. This effect can also be observed in Fig. 3. The difference between the fittings, with or without the thermal expansion contribution, reaches the value of∼1 meV at T = 65 K. Although this difference is small, it should be taken into account, once other physical phenomena such as the ex-citons localization by potential fluctuation in semiconductor alloys are commonly used to explain the blueshifts of this magnitude in the variation of the excitonic transitions with temperature [51,57-59]. Although the NTE induces a small blueshift of energy gap in the temperature range from 23 K to 95 K, the optical transition energy in the GaAs displays a small redshift in this same temperature range. This can be explained by the competition between the NTE and the electron-phonon interaction. Thus, for the GaAs in the tem-perature range from 23 K to 95 K, the electron-phonon inter-action is more intense than the NTE (above about 60 – 70 K the LO phonon contribution becomes important and eventu-ally dominates the shift of the band-gap energy), producing the redshift effect of the optical transition energy observed in Fig. 4, represented by the solid lines. At higher tempera-tures, the thermal expansion as well as the electron-phonon interaction induce a decrease of the band-gap energy. The total effect is a strong redshift of the band-gap energy (the linear decreasing of the band-gap energy). Some semicon-ductor materials of the group II-VI, as the CdTe, HgTe and HgCdTe have a NTE nine times larger than that observed in the GaAs [24]. Therefore, we should expect, in these mate-rials, a much larger blueshift of energy induced by the NTE
than that found for the GaAs.
Despite the large number of optical measurements car-ried out on the AlGaAs, the temperature dependence of the thermal expansion coefficients of this material in the 2 – 300 K temperature range is still unknown. As the thermal expan-sion coefficient of the AlAs binary also is not known in the range from 2 to 300 K, it is not possible to obtainαth(T)
for the AlxGa1−xAs ternary alloy from a direct linear
inter-polation between theαth(T)values of the GaAs and AlAs
binary materials. However, from the available data in the lit-erature, it is possible to obtain a reasonable estimate of the behavior of the linear thermal expansion coefficient of the AlxGa1−xAs alloy as a function of temperature. This
esti-mate is based on some experimental observations such as: a) GaAs and several other materials of similar crystalline struc-ture such as Si, GaSb, AlSb, InP, etc. present NTE at low temperatures [15,18,21]. b) Ternary materials (HgCdTe and HgZnTe), developed from binaries (HgTe, CdTe and ZnTe) which present NTE, also present the same behavior at low temperatures [24]. Moreover, the value of the temperature in which the minimum of NTE is observed in the ternary material is practically the same as that observed in the bi-nary materials [24]. c) Some experimental procedures have been shown that the temperature dependence of the lattice constant for the GaAs [17,60] is characterized by a mini-mum value at about 60 K. This behavior has also been ob-served for the Al0.32Ga0.68As alloy [17]. However, for this
alloy, the minimum value is smaller than that found for the GaAs. d) Multiple quantum wells of AlGaAs/GaAs present NTE at low temperatures [60]. It can be observed from the work of Clec’h et al. [60] that the temperature at which the lattice parameter has its minimum value, for the multi-ple quantum wells of AlGaAs/GaAs, is practically the same for different aluminum concentrations. This way, the behav-ior of the AlxGa1−xAs thermal expansion coefficient with
the temperature can be estimated from the thermal expan-sion coefficient from the GaAs in the all temperature range (2 – 300 K), from the linear interpolation between the ther-mal expansion coefficient values of the GaAs [15] and of the AlAs [61] at T = 300 K and from the experimental ob-servations mentioned above. Grimmeiss and Monemar have developed a similar procedure to obtain an estimate of the thermal expansion coefficient to the AlAs and AlP binary materials [62].
Figure 5 showsαth(T)the curve adjusted to fit the GaAs
experimental data points and the curve estimated for the AlxGa1−xAs alloy at x = 0.17, 0.30 and 0.40.
Experi-mental data for AlAs from Ref. 61 are also represented at T = 300 K. In the AlxGa1−xAs alloy system the bulk
modulus and the pressure coefficient are dependent on the Al concentration. In this work, we used the experimental dependence B(x) = (75.5 + 3.23x+ 7.93x2
−8.66x3
) GP a to the bulk modulus [63] and by means of linear in-terpolation between the GaAs and the AlAs pressure coef-ficients [2], the used pressure coefficient of the alloy was: (dE/dP)Γ
= (0.115−0.13x) eV /GP a. Similar to the GaAs material shown in Fig. 3B, the results of the band-gap shift for the AlxGa1−xAs due to the TE in the two cases,
Figure 5. The temperature dependence of linear thermal expansion coefficient for GaAs (thick solid curve) and for AlGaAs alloy atx= 0.17 (doted curve),x= 0.30 (dash-dotted curve) andx= 0.40 (fine solid curve). The experimental data for the AlAs, obtained from Ref. 61, are also represented atT = 300K. The inset shows the curves obtained in the low temperature interval (0K < T <80K).
show a large difference. This difference for the ternary Al-GaAs alloy, however, is slightly lower than the difference for the binary GaAs material due to the behavior ofαth(T)with
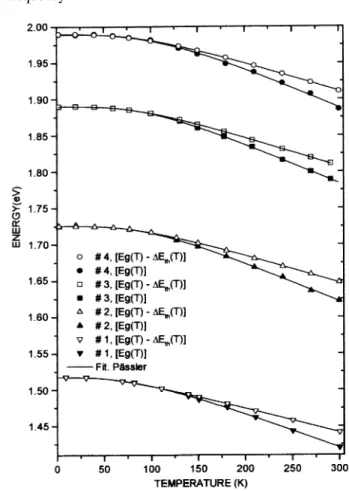
x. Figure 6 summarizes the experimental dependence of ex-citonic transitions with temperature for AlxGa1−xAs alloy
atx= 0.0, 0.17, 0.30 and 0.40. The curves with close sym-bols represent the total change of excitonic transitions with temperature. Results for the pure electron-phonon curve are represented by the curves with open symbols. The contri-bution of the TE mechanism at T = 300 K, usingαth(T)in
the expression (3), corresponds to 24% atx= 0.17, 22% at x= 0.30 and 22.3% atx= 0.40 of the total variation of the excitonic recombination energy. Thus the variation of the aluminum concentration in the ternary alloy appears not to alter significantly the contribution of the thermal dilatation to the total excitonic transition energy variation with tem-perature, at least in the range of the aluminum concentra-tion studied. However, according to the model presented for αth(x, T), the contribution of NTE decreases with
increas-ing aluminum concentration in the AlxGa1−xAs alloy.
Si and Ge electron-phonon spectral functions calcula-tions have shown that the energy shift due to electron-phonon interaction includes contributions from both acous-tical and opacous-tical phonons [35]. ThenΘ,B in expression (4) andΘ,in expression (5) should correspond to the average
frequency
Figure 6. Excitonic transitions in AlxGa1−xAs samples with var-ied aluminum composition are represented as temperature func-tions. Solid symbols represent experimental data points for the total excitonic transitions variations. Open symbols represent ex-citonic transitions minus the energy shifts∆Eth(T)associated to thermal expansion. The solid lines represent least-aquare fits using the P¨assler model [Eq.(2)] or [Eq.(5)].
of the phonon spectra in the temperature scale. However, the
electron-longitudinal acoustical phonon interactions give the dominant contribution to the GaAs band-gap energy shift [9,27,51]. In the AlxGa1−xAs, the energy values associated
toΘB andΘincrease due to the variation of the aluminum
concentration [11,29]. A recent study showed that the in-crease of the parametersΘBandΘdue to an increase in the
aluminum concentration in the AlxGa1−xAs alloy seems to
be related only to the optical branches of the phonon spec-tra [29] (It was shown that the frequency of thelongitudinal acoustical(LA) phonon is not dependent on the aluminum concentration in the AlGaAs alloy [64]). However, in the analysis of the parametersΘB andΘ, the thermal
expan-sion mechanism and the electron-phonon interaction are not explicitly separated. Table II shows the values for the Vi˜na and P¨assler optimized parameters (EB,, a,B,Θ,B;E,
g(T =
0), α,,Θ,) in the GaAs and AlGaAs taking into account
the effects of electron-phonon contribution only (i.e. after subtracting the thermal expansion contribution). After the subtraction of the thermal expansion contribution, both the optimized parameters (Θ,B,a,B andΘ,,α,) and the
increasing of the aluminum concentration. Thus, the longi-tudinal optical(LO) phonons seem actually to be the main responsible for the increase either of the parameters (Θ,B andΘ,) or (Θ
BandΘ). The optimized parameter related to
the strength of the electron-phonon interaction (a,B) also in-creases withxindicating that the electron-LO phonon inter-action, in the AlxGa1−xAs alloy, increases relatively to the
electron-LA phonon interaction. This result is in agreement with the results of Kashet al.[65] who, using time-domain pump-probe Raman technique to measure directly the rel-ative strengths of the Fr¨ohlich interaction for ”AlAs-like” and ”GaAs-like” LO phonons in the two-mode AlxGa1−xAs
system, have shown that the relative strength of the electron-LO phonon interactions increases withxcomposition.
5
Conclusions
In conclusion, the excitonic transition energy dependence on temperature at different aluminum concentrations in the AlGaAs system was analyzed. The results presented in this work showed that the NTE in the AlxGa1−xAs alloy, in the
low temperature interval, induces a small blueshift in the op-tical transition energy. In the temperature range from∼23 to∼95 K there is a competition between NTE effect and the electron-phonon interaction. Additionally, we have shown that is necessary to take into account the thermal expansion coefficient in all the temperature range (0 – 300 K) to the present analysis of the temperature dependence of the band-gap energy for the GaAs semiconductor materials in the 2 – 300 K temperature range, and that the variation of the alu-minum concentration, in the ternary alloy AlxGa1−xAs,
ap-pears not to alter significantly the contribution of the TE to the total variation of the excitonic transitions energy with temperature.
Additionally, we have shown indirectly that the strength of the electron-LO phonon interaction, relatively to the electron-LA phonon interaction, increases with increasing
Alconcentration in the AlGaAs alloy. Acknowledgments
This work was partially supported by the Brazilian agen-cies: CAPES, CNPq, and FBB.
The authors would like to thank Professor Dr. Irineu Mazzaro, Departamento de F´ısica, Universidade Federal do Paran´a, Brazil for X-ray diffraction measurements, and to Professor Dr. E. Arraes Meneses, Instituto de F´ısica Gleb Wataghin – IFGW, UNICAMP, Brazil for having allowed us to use the facilities of the Laboratory of Optical Proper-ties, where the photoluminescence measurements were car-ried out.
References
[1] H. Morkoc¸ and H. Unlu, Semiconductors and Semimetals, (Edited by R. Dingle), (Academic Press, San Diego, 1987), Vol.24, Chapter 2.
[2] S. Adachi, J. Appl. Phys.58, R1 (1985); I. Vurgaftman, J. R. Meyer, and L. R. Ram-Mohan, J. Appl. Phys.89, 5815 (2001), and references therein.
[3] P. B. Allen and V. Heine, J. Phys. C: Solid State9, 2305 (1976).
[4] S. Zollner, S. Gopalan, and M. Cardona, Solid State Com-mun.77, 485 (1991), and references therein.
[5] P. B. Allen and M. Cardona, Phys. Rev. B23, 1495 (1981).
[6] A. Manoogian and J. C. Wolley, Can. J. Phys.62, 285 (1984).
[7] J. P. Walter, R. R. L. Zucca, M. L. Cohen, and Y. R . Shen, Phys. Rev. Lett.24, 102 (1970).
[8] Z. Hang, D. Yan, F. H. Pollak, G. D. Pettit, and J. M. Woodall, Phys. Rev. B44, 10546 (1991).
[9] R. P¨assler, Phys. Status. Solidi. B200, 155 (1997).
[10] M. El Allali, C. B. Sorensen, E. Veje, and P. Tidemand-Petersson, Phys. Rev. B48, 4398 (1993).
[11] S. Logothetidis, M. Cardona, and M. Garriga, Phys. Rev. B
43, 11950 (1991).
[12] E. Grilli, M. Guzzi, R. Zanboni, and L. Pavesi, Phys. Rev. B
45, 1638 (1992).
[13] H. Shen, S. H. Pan, Z. Hang, J. Leng, F. H. Pollak, J. M. Woodall, and R. N. Sacks Appl. Phys. Lett.53, 1080 (1988).
[14] C. H. Xu, C. Z. Wang, C. T. Chan, and K. M. Ho, Phys. Rev. B43, 5024 (1991).
[15] T. Soma, J. Satoh, and H. Matsuo, Solid State Commun.42, 889 (1982).
[16] S. Biernacki and M. Scheffler, Phys. Rev. Letters, 63, 290 (1989).
[17] M. Leszczynski, V. B. Pluzhnikov, A. Czopnik, J. Bak-Misiuk, T. Slupinski, J. Appl. Phys.82, 4678 (1997).
[18] K. G. Lion, G. L. Salinger, C. A. Swenson, G. K. White, J. Appl. Phys.48, 865 (1977).
[19] G. Dolling and R. A. Cowley, Proc. Phys. Soc. London88, 463 (1966).
[20] H. Ibach, Phys. Status Solidi31, 625 (1969).
[21] S. I. Novikova, N. Kh. Abrikhosov; Sov. Phys. Solid State (English Transla.)5, 1558 (1963); Fiz. Tverd. Tela5, 2138 (1963).
[22] P. W. Sparks, C. A. Swenson, Phys. Rev.163, 779 (1967).
[23] D. F. Gibbons, Phys. Rev.112, 136 (1958).
[24] D. Bagot, R. Granger, and S. Rolland, Phys. Stat. Sol. (b)
177, 295 (1993).
[25] Vi˜na, S. Logothetidis, and M. Cardona, Phys. Rev. B30, 1979 (1984).
[26] R. P¨assler, G. Oelgart, J. Appl. Phys.82, 2611 (1997).
[27] P. Lautenschlager, M. Garriga, S. Logothetidis, and M. Car-dona, Phys. Rev. B35, 9174 (1987).
[28] [28] I. C. Bassignana, D. A. Macquistan, R. W. Streater, G. C. Hillier, R. Packwood, and V. Moore, J. Cryst. Growth.172, 25 (1997).
[29] S. A. Lourenc¸o, I. F. L. Dias, J. L. Duarte, E. Laureto, E. A. Menese, J. R. Leite, and I. Mazzaro, J. Appl. Phys.89, 6159 (2001).
[31] R. P¨assler, Solid State Electronics39, 1311 (1996).
[32] R. P¨assler, J. Appl. Phys.83, 3356 (1998).
[33] L. Malikova, W. Krystek, F. H. Pollak, N. Dai, A. Cavus, and M. C. Tamargo, Phys. Rev. B54, 1819 (1996).
[34] S. Biernacki, U. Scherz, and B. K. Meyer, Phys. Rev. B49, 4501 (1994).
[35] P. Lautenschlager, P. B. Allen, and M. Cardona, Phys. Rev. B
31, 2163 (1985).
[36] V. Swaminathan, J. L. Zilko, W. T. Tsang, and W. R. Wagner, J. Appl. Phys.53, 5163 (1982).
[37] Y. Chen, G. P. Kothiyal, J. Singh, and P. K. Bhattacharya, Superlatt. Microstruct3, 657 (1987).
[38] H. Heilman and G. Oelgart, Semicond. Sci. Technol.5, 1040 (1990).
[39] D. E. Aspnes, Surf. Sci.37, 418 (1973).
[40] F. Cerdeira, Braz. J. Phys.23, 3 (1993).
[41] F. G. S´anchez-Almazan, H. Navarro-Contreras, G. Ram’rez-Flores, and M. A. Vidal, J. Appl. Phys.79, 7713 (1996).
[42] R. A. Kuzmenko and ´E. P. Domashevskaya, Semiconductors
36, 278 (2002).
[43] O. J. Glembocki, N. Bottka, and J. E. Furneaux, J. Appl. Phys.57, 432 (1985).
[44] S. K. Brierley and D. S. Lehr, J. Appl. Phys.67, 3878 (1990), and references therein.
[45] A. V. Ganzha, R. V. Kuzmenko, W. Kircher, J. Screiber, and S. Hildebrandt, Semiconductors32, 245 (1998), and refer-ences therein.
[46] R. Wang and D. Jiang, J. Appl. Phys.72, 3826 (1992).
[47] R. Kuzmenko, A. Ganzha, J. Schreiber, and S. Hildebrandt, Phys. Solid State39, 1900 (1997).
[48] E. F. Schubert and W. T. Tsang, Phys. Rev. B34, 2991 (1986).
[49] W. Shan, W. Walukiewicz, E. E. Haller, B. D. Little, J. J. Sang, M. D. McCluskey, N. M. Johnson, Z. C. Feng, M. Schurman, and R. A. Stall, J. Appl. Phys.84, 4452 (1998).
[50] F. Schubert, E. O. G¨obel, Y. Horikoshi, K. Ploog, and H. J. Queisser, Phys. Rev. B30, 813 (1984).
[51] B. Q. Sun, D. S. Jiang, Z. Pan, L. H. Li, and R. H. Wu, Appl. Phys. Leet.77, 4148 (2000).
[52] C. L´arez and C. Rinc´on, J. Phys. Chem. Solids,58, 1111 (1997).
[53] G. Fonthal, L. Tirado-M´ej´ıa, J. I. Marin-Hurtado, H. Ariza-Calder´on, J. G. Mendoza-Alvarez, J. Phys and Chemistry of Solids61, 579 (2000).
[54] S. Gopalan, P. Lautenschlager, and M. Cardona, Phys. Rev. B
35, 5577 (1987).
[55] A. M. Hennel, Phys. Stat. Sol. A,8, K111 (1971).
[56] A. Manoogian Can. J. Phys.60, 1490 (1982).
[57] D. Ouadjaout and Y. Marfaing, Phys. Rev. B46, 7908 (1992).
[58] H. P. D. Schenk, M. Lerox, and P. de Mierry, J. Appl. Phys.
88, 1525 (2000).
[59] S. A. Lourenc¸o, I. F. L. Dias, L. C. Poc¸as, J. L. Duarte, J. B. B. de Oliveira, and J. C. Harmand, J. Appl. Phys.93, 4475 (2003).
[60] G. Clec’h, G. Calvarin, P. Auvray, and M. Baudet, J. Appl. Crystallogr.22, 372 (1989).
[61] I. I. Pashintsev, N. N. Sirota; Dokl. Akad. Nauk SSSR3, 38 (1959).
[62] H. G. Grimmeiss and B. Monemar, Phys. Stat. Sol. (a)5, 109 (1971).
[63] S. Gehrsitz, H. Sigg, N. Herres, K. Bachem, K. K¨ohler, and F. K. Reinhart, Phys. Rev. B60, 11601 (1999).
[64] L. Pavesi, and M. Guzzi, J. Appl. Phys.75, 4779 (1994), and references therein.