Artigo
*e-mail: [email protected]
THERMOGRAVIMETRIC AND SPECTROSCOPIC STUDY (TG–DTA/FT–IR) OF ACTIVATED CARBON FROM THE RENEWABLE BIOMASS SOURCE BABASSU
Giulyane Felix de Oliveiraa, Robson Carlos de Andradeb, Magno Aparecido Gonçalves Trindadea, Heloysa Martins Carvalho
Andradeb and Cláudio Teodoro de Carvalhoa,*
aUniversidade Federal da Grande Dourados, Rodovia Dourados–Itahum, km 12, 79804-970 Dourados – MS, Brasil bUniversidade Federal da Bahia, Rua Professor Aristide Novis, 2, Federação, 40210-630 Salvador – BA, Brasil
Recebido em 23/08/2016; aceito em 01/11/2016; publicado na web em 25/11/2016
Activated carbons (ACs) with well–developed microstructure and high microporosity were obtained from biomass by potassium hydroxide activation. The preparation process consisted in producing carbon materials in the ratios of activating agent to raw material 70:30, 50:50, 30:70 and 25:75 (w/w) characterized by thermal analysis coupled to spectroscopy (TG–DTA / FT–IR), scanning electron microscopy (SEM), N2 adsorption isotherms at –196 °C and activation isotherm at 500 and 600 °C for 3.0 h. Specific surface areas (SBET) within 728 and 1712 m2 g-1 and (S
mic) within 1054 and 1923 m2 g-1 were obtained, while the micropores surface area was calculated using the Dubinin-Astakhov (DA) equation and the pore size distribution calculated from density functional theory (DFT) was found to be in the range 1.09 – 1.77 nm. Adsorption isotherms were fitted using Langmuir and Freundlich non–linear models and the adsorption capacity determined for methylene blue dye was between 27.13 and 459.20 mg g-1.
Keywords: babassu; adsorbent; thermal analysis; spectroscopy.
INTRODUCTION
Adsorbent materials like ACs have attracted growing interest in the late years due to their wide range of applications described in the literature, specially their use in liquids and gases purification, medicine, filtration, support material for catalysts, removal of metal ions and other applications.1-6 Such adsorbents may be derived from
various sources like minerals and lignocellulosic material, even though the AC production from minerals presents some important disadvantages like high cost, low yields in carbonization and high ash content.7-10 Alternatively, lignocellulosic materials from
agro--industrial and agricultural wastes such as peels, seeds or bagasse offer great potential to be used as raw carbon precursors due to their high carbon content and already proven high adsorption capacity.11-16
Babassu is a palm tree which belongs to the family Palmae, species Orbignya phalerata. This palm tree attains up to 20 meters in height and is native from South America, occurring widely in the north and north-east regions of Brazil, found in a transitional biome between the Amazon rainforest and the Caatinga ecosystems called Coconut Forests (Mata dos Cocais) and also along Bolivia, Colombia and Suriname.17-19
The main product obtained from Babassu is the kernel oil which is extracted by pressing the kernel, used like raw material in cosme-tic industries, oleochemicals, biofuels and food. Around 7% of the fruit total weight is kernel, so the Babassu kernel oil yield is low.20,21
The Babassu palm petiole from its leaves is an attractive raw material for activated carbon production since it is a renewable and highly sustainable material not to mention its easy obtention and at a low cost which can not only add economic value to it but help in income generation and environment preservation.
In this regard, the main objective of this work is the production of activated carbon from Babassu petiole as raw material employing chemical activation method with potassium hydroxide (KOH) as activating agent for obtention of a material with high superficial area and development of a highly microporous structure.
EXPERIMENTAL
Preparation of activated carbons from Babassu biomass
The raw material, Babassu palm petiole, was provided by a private property from the north of the state of Mato Grosso do Sul – Brazil and initially ground using a knife grinder (Marconi-MA 340–A) and sieved to control the particles size at 2.00 mm.
The samples of about 10 grams of the milled material were impregnated with the activating agent potassium hydroxide (98% purity Merck) in the percentage ratios 70:30, 50:50, 30:70, 25:75 (m:m) of raw material/activating agent and dried at about 100 °C for at least 24 hours. The impregnated material was activated using a tubular furnace (reactor), inserted into a muffle furnace under a flow of nitrogen gas (100 mL min-1) with activation process occurring at
500 and 600 °C for 3 hours. After activation, the remaining residue of activating agent was removed with distilled water in successive washes until neutral pH. Then, the materials were dried in an oven at the temperature of 110 °C for 24 hours and stored in dessicator. The adsorbents produced have been generically abbreviated to AC, but from now on they will be identified with abbreviations according to their raw material/activating agent ratios, as follows: activated carbons at 500°C 70:30 (AC1), 50:50 (AC2), 30:70 (AC3), 25:75 (AC4) and at 600 °C 70:30 (AC5), 50:50 (AC6), 30:70 (AC7) and 25:75 (AC8).
Immediate and thermal analyses
The moisture, volatiles and biomass ashes contents from Babassu were determined according to the methods provided by the American Society for Testing and Materials (ASTM), namely ASTM E1756-08, ASTM D5832-98 and ASTM E1755-01.
Simultaneous TG–DTA curves were obtained by using the thermal analysis equipment TA Instruments model SDT 2960, with weight sensitivity of 0.1 µg using air or N2 (99% pure) as purge gas
with flow rate of 100 mL min-1. Heating rates of 20 ºC min-1 (ar) and
10 ºC (N2) were adopted using alumina crucibles between 30 and
Evolved gas analysis
The measurements of the gaseous products were carried out using a Thermogravimetric Analyzer Mettler TG–DSC coupled to a Nicolet FT–IR spectrophotometer with gas cell and DTGS KBr detector. The furnace and the heated gas cell (250 ºC) were coupled through a heated (T = 200 ºC) 120 cm stainless steel line transfer of 2 mm in diameter both purged with dry air (50 mL min-1). The FT–IR
spectra were recorded with 32 scans per spectrum at 4 cm-1 resolution.
FT–IR analysis
The main surface groups were identified by infrared spectroscopy using a FT–IR instrument (DigilabExcalibur–FT3000) and recorded within the range of 4000 – 400 cm-1, with a 4 cm-1 resolution and 16
scans. The samples of activated carbon powder were mixed on an agate mortar in a ratio of KBr/activated carbon of about 1:100 and ground on the agate mortar.
Scanning electron microscopy analysis
The chemical composition of the materials was evaluated using a Shimadzu EDX–720 energy-dispersive X–ray spectrometer. The morphology of the materials was studied using a scanning electron microscope (SEM), model Jeol JSM–6610LV, with accelerating voltage of 10.0 kV and focus distance between 9 and 10 mm. The magnification range used during the analysis ranged from 300x to 3000x. Before the analysis, the samples were fixed with tape carbon and coated with gold by a metallization process to obtain good sur-face conductivity.
Textural analysis
The textural properties of carbons were analyzed by nitrogen ad-sorption at –196°C using the Micromeritics ASAP 2020 Physiad-sorption Analyzer, at a relative pressure range of 10-7 to 0.99 P / P
0. Before
analysis, all samples were degassed at 300 °C for 10 h at 0.5 µm Hg vacuum. The specific surface area was measured by BET (Brunauer– Emmett–Teller) method using the adsorption data at the relative pressure range of 0.05 to 0.3. The surface area of the micropores was calculated using the Dubinin–Astakhov (DA) equation. The pore size distributions (PSD) were calculated using Density Functional Theory (DFT), employing the software supplied by Micromeritics and slit pores (slit-shaped) model to calculate the different pore sizes.
Adsorption isotherms
Adsorption tests for the ACs with methylene blue purchased from Sigma-Aldrich were performed by placing the samples in a shaker/ incubator under stirring for 24 hours at 30 ºC. After this process, the solutions were filtered and the aliquots were analyzed using a Varian Cary® 50 UV–Vis spectrometer, at the wavelength of 664 nm. The methylene blue (MB) dye concentration was calculated considering the calibration curve previously obtained with experiments made in triplicate. The average amount of MB adsorbed on the AC samples corresponds to Qeq (mg g−1) and the concentration of free MB in the
solution represented by Ceq (mg L-1). The experimental isotherms were plotted Qeq (y–axis) versus Ceq(x–axis).
Study of the isotherms was carried out employing the non-linear fitting method using the Origin 8.0 software (OriginLab Corporation, USA) in accordance with the Langmuir and Freundlich adsorption
isotherm equations , , respectively,
in which a and b are the Langmuir constants and k and n are the Freundlich ones.
RESULTS AND DISCUSSION
Immediate analysis and TG-DTA of the raw material
From immediate analysis of the biomass it was identified low values of ash and volatile material contents and as a consequence a high fixed carbon content, with moisture of 0.36% ±0.004, volatiles 23.11% ±0.009 ash content 6.0% ±0.005, and fixed carbon 76.53%.
A low ash content and a high carbon content indicate that the biomass is a suitable raw material for activated carbon production, so that it is possible to infer that the Babassu biomass is adequate for activated carbon production.
The raw material Babassu was previously analyzed by thermal analysis (TGA–DTA) in nitrogen inert atmosphere before the ACs production being carried out in order to obtain information on the proper temperature range for the drying process, as well as on the region where there would be formation of carbonaceous material.
The thermal analysis of the raw material, Figure 1, using initial mass of 5 mg, basically occurs with mass loss of 10% between 30 and 90 °C attributed to adsorbed water, since the raw material had been previously dried at about 100 °C for at least 24 hours. The other mass loss steps with 64%, starting at around 200 °C, were attributed to the thermal degradation of hemicellulose and cellulose, forming a carbonaceous residue from 450 ºC which decomposes slowly up to 1000 ºC. The final residue formed was of 25%, which is consistent with a mixture of ash and carbon.
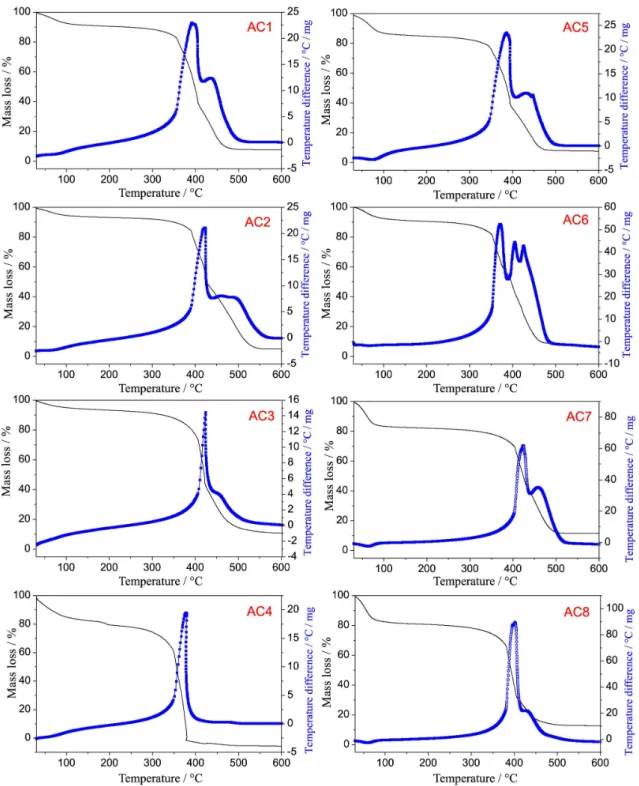
TG–DTA of the activated carbons
For the AC samples, TGA–DTA thermal analysis obtained in oxidizing atmosphere of dry air was used to study the thermal stabil-ity of the materials after the activation process in order to provide information on the adsorbed water and ash contents from the ACs produced with different activating agent ratios.
The ACs were obtained through two different activation tempera-tures, 500 and 600 ºC, in the raw material/activating agent percentage ratios 70:30, 50:50, 30:70 and 25:75%. The thermal analysis of these materials, Figure 2, shows basically three mass loss steps (TG) with corresponding thermal events in the DTA curves. The first steps up to 100 °C show mass losses for the ACs between 5 and 12% due to the physically adsorbed water on the material, probably occurred during storage. Furthermore, the hygroscopicity in ACs samples can
be related to the presence of oxygenated surface groups, responsible for hydrogen bonds between the water and the oxygen molecules, a suitable characteristic for adsorption of polar molecules.22
The decomposition product of the second and third mass loss steps can be assigned to the surface groups formed during the acti-vation process, as well as to the carbon skeleton decomposition. In order to get further insight into the surface groups, a literature review has been done on papers reporting the degradation temperature of these groups employing different techniques. Taking such studies into consideration, it is possible to affirm that for the present study, in the second step groups such as carboxylic acids, carboxylic an-hydrides and lactones, which are less thermally stable, decompose
with evolution of carbon dioxide between 300 and 400 °C, while it is expected that the decomposition of other surface groups like phenol, carbonylic, quinones, hydroquinone, ethers, pyrone structures, takes place at higher temperatures, i.e. above 400 °C (third step), since the oxidizing atmosphere used is different from that one used by these authors.23,24 In addition, it can be observed that the activated carbon
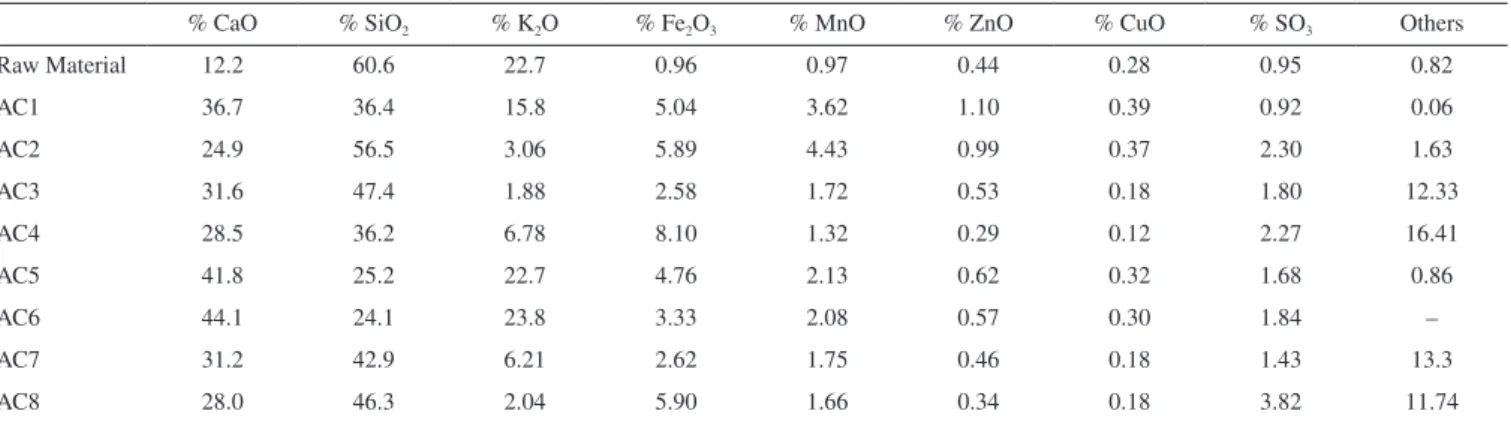
samples have similar decomposition profiles in the TGA curves with intense exothermic peaks (DTA) related to the thermal decomposi-tion of matter organic, so that the last mass loss steps, which occur overlapped, can also be related to the carbon skeleton of the ACs, leading to ash with average percentage of 7.4%. The data related to qualitative analysis by EDX for identification of the main metal
elements in form of its oxides are shown in Table 1. It is observed that the residue is composed primarily of calcium, silicon, aluminum, potassium, iron, manganese, zinc, copper, sulfur and trace of others elements. Thus, from the TG–DTA and EDX is possible to estimate that the ACs are composed of 80.6 – 87.6% by carbon and oxygen.
Analysis of the surface groups by FT–IR and TG–DTA/FT–IR
Results of FT–IR measurements made for the modified activated carbons are shown in Figure 3 (AC1 – AC8) and provide information about the functional groups formed on the material surface, which are very important for the evaluation of the adsorption properties.
Broad bands between 3670 and 2979 cm-1 in the spectrum may
indicate the presence of surface groups such as phenol, carboxylic acids, carboxylic acid derivatives, as well as the presence of physically adsorbed water on the material surface. These bands are generated by O–H stretching, but usually the signal of O–H stretching bands of carboxylic acids is intense in a wide range of the spectrum. On the other hand, fortunately the bands related to the formation of dimers of carboxylic acid are not present because the axial deformation of the O–H group in this arrangement produces a very broad and in-tense band in the region of 3300 – 2500 cm-1, overlapping the C–H
stretching bands. Hence, the characteristic bands of average intensity assigned to axial stretching of C–H bond can be observed alone at 2962 and 2853 cm-1. In addition, a small band at 720 cm-1 inherent to
asymmetric angular deformation in the plan of the C–H2 bond may
be observed in the amplified spectrum of the AC5 sample.
Another consistent result is the absence of coupling bands between 1800 and 1900 cm-1 (C=O and C–O–C) assigned to
sym-metric and asymsym-metric stretchings for carboxylic acid derived from anhydrides, which normally appear shifted by 60 cm-1. For the ketone
groups, the C=O stretching frequencies vary according to the ring
size and the number of conjugations, i.e. the greater the ring and the number of conjugations, the smaller the stretching frequency. Thus, it is assumed that C=O stretching bands for ketone surface groups are overlapped between 1550 and 1680 cm-1 in the same region as
carboxylic acids and lactones.
Lactones or cyclic esters also present some important features which may assist to identify the intensity of the absorption frequency, for instance, lactones with five and six membered rings which have double bond conjugated to a C=O functional group present a decrease in their C=O absorption frequency, but if the unsaturation is located in the alpha position at the –O– group, the absorption frequency will be greater. Thus, it is suggested that the band located at 1746 cm-1 can
be attributed to lactonic groups (five-membered ring) with unsatura-tion at the C=O posiunsatura-tion, while the peak at 1715 cm-1 can be assigned
to lactonic groups (six-membered ring) with unsaturation, also at the C=O position. Besides, these lactonic groups stand out as being thermally stable due to the lower tension of their ring structure, even though some subtle differences in the regions 1760 and 1520 cm-1 can
be observed between the FT–IR spectra of the activated carbons at 500 and 600 °C so that no band at 1746 cm-1 is observed for the carbon
produced at 600 °C, suggesting the presence of only six–membered ring lactones in the activated carbons from AC5 to AC8. Furthermore, from the spectra, Figure 3 (AC1 – AC8), it is possible to suggest that the aldehyde functional group is not present on the material surface due to the absence of the Fermi doublet, which occurs in the spec-tral range of 2738 to 2820 cm-1. Finally, the broad band at around
1000–1300 cm-1 can be associated with the C–O stretching of ethers,
lactones and phenols. The data obtained from FT–IR analysis for the surface groups are concisely displayed in Table 2.
The Gram–Schmidt (GS) curve of AC samples is shown in Figure 4. In this curve, the entire spectral range of each individual spectrum is integrated and the signal generated is represented as Table 1. Energy-dispersive X-ray spectrometry (EDX) data for the majority of oxides found in the activated carbons obtained at 500 °C (AC1-AC4) and 600 ºC (AC5-AC8)
% CaO % SiO2 % K2O % Fe2O3 % MnO % ZnO % CuO % SO3 Others
Raw Material 12.2 60.6 22.7 0.96 0.97 0.44 0.28 0.95 0.82
AC1 36.7 36.4 15.8 5.04 3.62 1.10 0.39 0.92 0.06
AC2 24.9 56.5 3.06 5.89 4.43 0.99 0.37 2.30 1.63
AC3 31.6 47.4 1.88 2.58 1.72 0.53 0.18 1.80 12.33
AC4 28.5 36.2 6.78 8.10 1.32 0.29 0.12 2.27 16.41
AC5 41.8 25.2 22.7 4.76 2.13 0.62 0.32 1.68 0.86
AC6 44.1 24.1 23.8 3.33 2.08 0.57 0.30 1.84 –
AC7 31.2 42.9 6.21 2.62 1.75 0.46 0.18 1.43 13.3
AC8 28.0 46.3 2.04 5.90 1.66 0.34 0.18 3.82 11.74
Table 2. Spectroscopic data for the main surface groups for the activated carbons obtained at 500 °C (AC1-AC4) and 600 ºC (AC5-AC8)
Surface groups Exp. (cm-1) Lit. (cm-1) Assignment (cm-1)
Carboxylic acid 1630 2500–3300, 1665–1760, 1120–1200 O–H
Hydroxyl 3440 3200–3600 O–H
Lactones 1630 1675–1790, 1160–1370 C=O
Phenol 3430 1000–1220, 1160–1200, 2500–3620 O–H
Cyclic structure ~1516 1585–1600 C=C
Carbon–hydrogen 2915, 2846, 720 2700–3000 C–H, C–H2
Quinones ~1550 1550–1680 C=O
Ethers ~1200 1000–1300 C–O
peaks, which are related to the quantitative measurement of the evolved gas composition in a determinate time or temperature range in the GS curve. Figure 4 show the GS curve of AC1 as representative of all activated carbon (AC1 – AC8) due to their similarity.
The gaseous products carbon monoxide (CO) and carbon dioxide (CO2) identified in the FT–IR spectra during the thermal
decomposi-tion (TG–DTA) of the ACs samples in N2 atmosphere for determinate
temperature ranges observed in GS curve are due to surface groups.23
For the range 30 – 100 °C, the FT–IR spectrum (a) shows bands located at around 3700 and 1500 cm-1 corresponding to adsorbed
water, while between the ranges of 170 – 400 and 530 – 580 °C the spectrum (b) shows CO2 as a thermal decomposition product of the
carboxylic and lactonic groups respectively.24
For the ranges of 400 – 530 and 580 – 600 °C, the FT–IR spec-trum (c) shows CO as the main product released. In the first range,
the three bands of high intensity are probably related to the thermal decomposition of the phenolic and lactone surface groups, whereas the second range is due to the quinone groups. Therefore, it is pos-sible to affirm that according to these data, the activated carbons surface is mainly composed of phenolic and carbonyl groups, as well as of lactone and quinone groups and a small amount of carboxylic groups. Furthermore, there was no simultaneous release of CO and CO2, which confirms the absence of carboxylic anhydride groups on
the material surface and corroborates the FT–IR data in solid state.
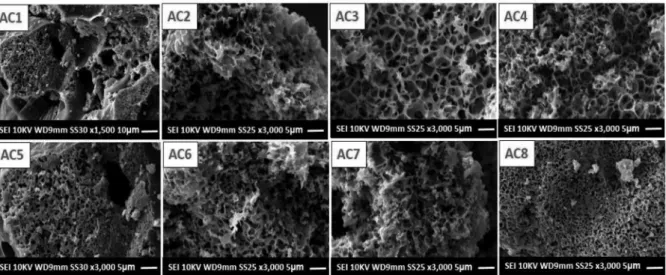
Morphological analysis
Morphological analysis carried out by SEM, Figure 5 (AC1 – AC8), aimed to visualize the morphological characteristics obtained from the activation process with different raw material/activating
Figure 3. FT–IR spectra for the activated carbons prepared with four activating agent ratios at two different temperatures, 500 °C (AC1 – AC4) and 600 ºC (AC5 – AC8)
Figure 4. Identification of surface groups on the activated carbons from the monitoring of the gaseous products, H2O (a) CO2 (b) CO (c), released at specific
agent proportions, at the two temperatures of 500 ºC (AC1 – AC4) and 600 ºC (AC5 – AC8). In Figure 5 (AC1 – AC8), the micrographs show an outer surface quite rough and formed by irregular rings, which cannot be considered pores but connecting channels to the interior of the material, which is presumed to be permeated by dif-ferent pore sizes. Furthermore, it is possible that the irregular rings observed especially in Figure 5 (AC3, AC4) evidence the cell walls of parenchyma and collenchyma tissues, common structures in young parts of plants, such as palm petioles.25
The pores represented by dark spots in the images, Figure 5, were formed through an aggressive heating process (burn–off),1,23 which
along with the activating agent resulted in an apparent carbonaceous matrix with high porosity.
Textural analysis
In Figure 6 are shown the isotherms of adsorption and desorption of nitrogen of the carbons activated at 500 and 600 °C. The carbons activated with potassium hydroxide at different ratios showed type I isotherms, according to the IUPAC classification, which is charac-teristic of microporous material.26
On the other hand, the isotherms of the activated carbons AC1, AC2, AC5 and AC6 can be classified as type IV, with hysteresis
loop opening at nearly P/P0 = 0.4, indicating small contribution of
mesopores.26 However, the increase of the ratio and the temperature
from 500 up to 600 °C led to a large increase in the BET area vary-ing between 728 a 1712 m2 g-1 and to an increment of the area of
micropores (DA) (1054 a 1923 m2 g-1), Table 3.
The activation process using potassium hydroxide causes it to react strongly with the carbonaceous structures promoting the oxida-tion of the carbon to carbon dioxide and generating microporosity.27,28
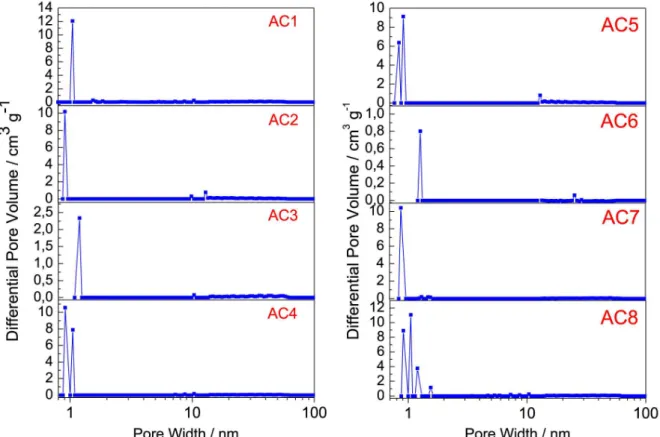
The pores diameter distribution (PDD) for the activated carbons is concentrated in the micropores region, below 2 nm, Figure 7(a–b). Furthermore, the slight variation in size of the micropores as shown in Table 3, can have been caused by the increase in potassium hydroxide / raw material ratio.27
Adsorption isotherms
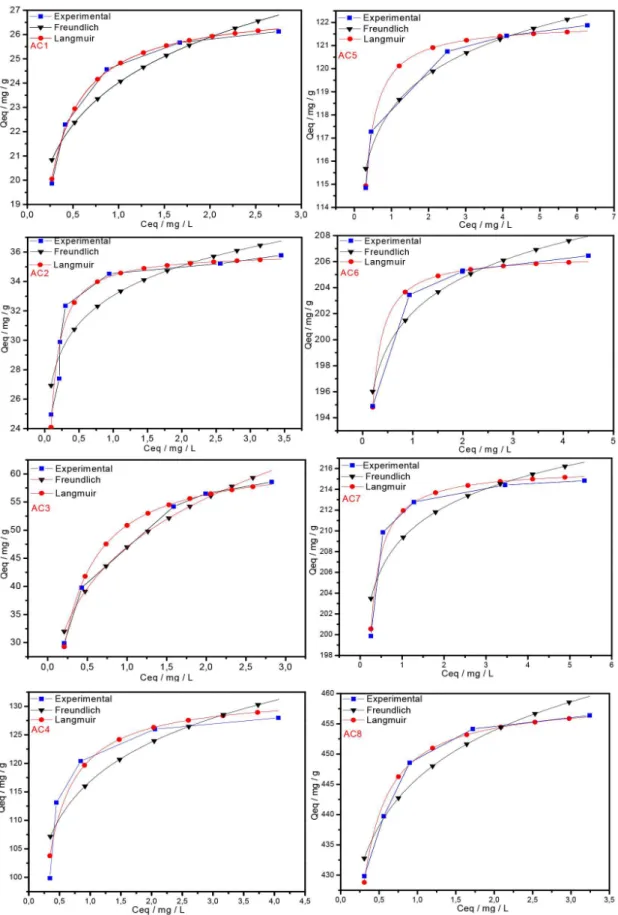
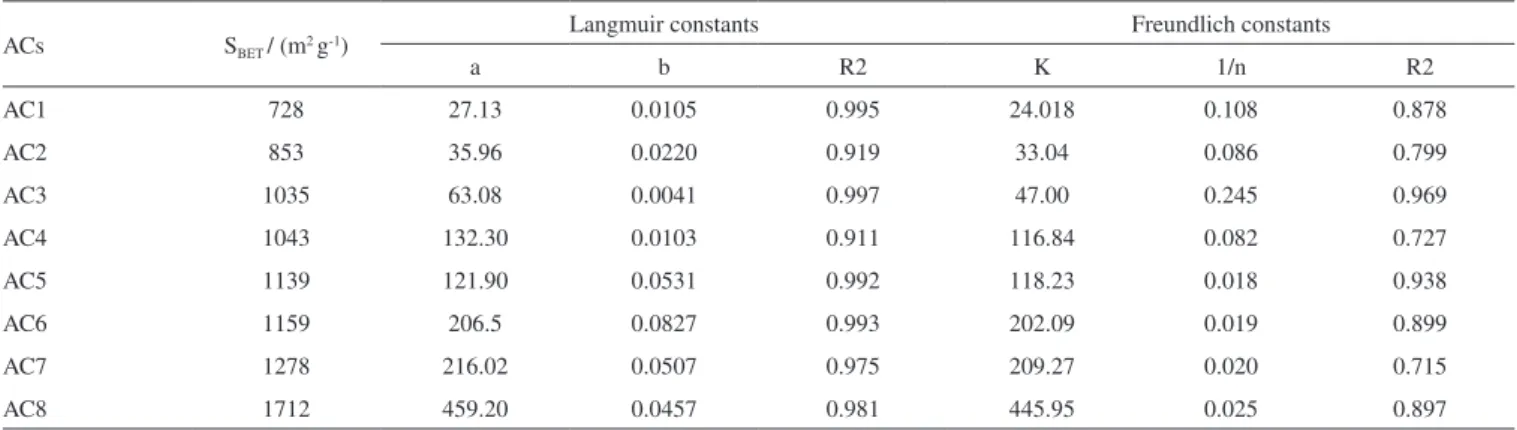
The activated carbons produced from Babassu petiole were very efficient at removing methylene blue cationic dye from aqueous solutions over a large concentration range. Equilibrium data were fitted to the Langmuir and Freundlich non-linear isotherms and the Langmuir model was the best at describing these data according to the R2values obtained, as shown in Figure 8 and Table 4. This result
shows that the ACs samples obtained present adsorption capacity for
Figure 5. Micrographs obtained by SEM for the activated carbons prepared with four activating agent ratios at two different temperatures, 500 °C (AC1 – AC4) and 600 ºC (AC5 – AC8)
Table 3. Textural properties of the activated carbons obtained at 500 °C (AC1 – AC4) and 600 ºC (AC5 – AC8)
Sample SBETa / (m2 g-1) Smicb / (m2 g-1) Vtc / (cm3 g-1) nd
AC1 728 1054 0.3983 1.30
AC2 853 1250 0.4631 1.09
AC3 1035 1301 0.5037 1.38
AC4 1043 1341 0.5139 1.57
AC5 1138 1478 0.5944 1.52
AC6 1158 1469 0.6333 1.50
AC7 1277 1515 0.6052 1.77
AC8 1712 1923 0.8357 1.72
aS
BET, surface area calculated by BET equation at P/P0 = 0.05 – 0.2. bSmic, surface area calculated by DA method. c V
total, total pore volume estimated from the ad-sorption amount at P/P0 = 0.98. d Exponent of the Dubinin–Astakhov equation.
Figure 7. Pore size distribution for the activated carbons prepared with four activating agent rates at two different temperatures, 500 ºC (AC1 – AC4) and 600 ºC (AC5 – AC8), calculated using the Density Functional Theory (DFT)
dye removal at the range 27.13 – 459.20 mg g-1, which corroborates
the evidence found that the increase in the activating agent ratios and in the total surface area as a consequence contributes to significant increase in the adsorption capacity. Furthermore, the treatment with KOH produces basic functional groups on the carbon surface, which enhances the adsorption of cationic dye.
Moreover, considering that the activated carbon samples have microporous carbon skeleton, close to 1 nm, it is interesting to ob-serve that depending on the surface area of the carbons obtained, the adsorption increased considerably despite the relatively large area of the MB molecule. Many discussions in this respect have been gener-ated, and the agreed pore diameter for MB adsorption averages 1.3
nm.29,30 Thus, it would be interesting that small deviations from the
mathematical equations used could also be considered in the pore size determination.
Regarding the isotherms, they present large increase in the ad-sorption capacity at low concentrations of MB dye, followed by a shift to a plateau form as this concentration gets higher. This profile best fits to the Langmuir model since the interaction between the adsorbate and adsorbent molecules occurs more strongly than that one among the adsorbate molecules, which is what the constant b in Table 4 represents. For all ACs samples, the highest values of b were obtained for the ACs at 600 ºC (AC5 – AC8).
CONCLUSION
Thermal analysis and coupled thermal analysis (TG–DTA and TG–DTA / FT–IR) have proven to be very useful in providing relevant information to be used in the optimization process of activated carbons production. Such information includes the proper temperature range for the drying process of the raw material, as well as the temperature range of formation of carbonaceous material. Furthermore, from TG– DTA / FT–IR it was possible to suggest that the main surface groups present on the surface of the activated carbons are in accordance with the FT–IR spectroscopic data in solid state.
The textural and morphological analyses showed that the ACs were obtained with microporous matrix and large surface areas de-termined between 728 and 1712 m2 g-1. Despite being a microporous
material, the adsorbent obtained can be assessed by adsorption tests with methylene blue dye in aqueous solution in order to evaluate its adsorption capacity. The Langmuir model adjusted better to the experimental results, suggesting that adsorption occurs mainly in monolayer by homogeneous sites.
Figure 8. Isotherms at 30 ºC for blue methylene dye fitted to the Langmuir and Freundlich non-linear mathematical models, where Qeq is the dye mass adsorbed per gram of adsorbent and Ceq is the mass of the remaining dye in solution
ACKNOWLEDGEMENTS
The authors thank Ivo Giolito Thermal Analysis Laboratory (LATIG), Professor M. Ionashiro and Foundations Fundação de Apoio
Table 4. Parameters from Langmuir and Freundlich mathematical models for blue methylene adsorption on the activated carbons at 500 ºC (AC1 – AC4) and 600 ºC (AC5 – AC8)
ACs SBET/ (m2 g-1)
Langmuir constants Freundlich constants
a b R2 K 1/n R2
AC1 728 27.13 0.0105 0.995 24.018 0.108 0.878
AC2 853 35.96 0.0220 0.919 33.04 0.086 0.799
AC3 1035 63.08 0.0041 0.997 47.00 0.245 0.969
AC4 1043 132.30 0.0103 0.911 116.84 0.082 0.727
AC5 1139 121.90 0.0531 0.992 118.23 0.018 0.938
AC6 1159 206.5 0.0827 0.993 202.09 0.019 0.899
AC7 1278 216.02 0.0507 0.975 209.27 0.020 0.715
AC8 1712 459.20 0.0457 0.981 445.95 0.025 0.897
ACs = activated carbon samples, SBET = surface area, a= Langmuir adsorption capacity (mg g-1), b= Langmuir equilibrium constant (Lg-1), K= Freundlich adsorption capacity (mg g-1), n = affinity between adsorbent and adsorbate, R2 = correlation value.
REFERENCES
1. Ioannidou, O.; Zabaniotou, A.; Renewable Sustainable Energy Rev. 2007, 11, 1966.
2. Amicarelli, V.; Baldassarre, G.; Liberti, L.; J. Therm. Anal. Calorim. 1980, 18, 155.
3. Hameed, B. H.; Rahman, A. A.; J. Hazard. Mater. 2008, 160, 576. 4. Jain, A. K.; Gupta, V. K.; Bhatnagar, A.; Suhas; J. Hazard. Mater. 2003,
101, 31.
5. Amaya, A.; Píriz, J.; Tancredi, N.; Cordero, T.; J. Therm. Anal. Calorim.
2007, 89, 987.
6. Dinçer, A. R.; Güneş, Y., Karakaya, N. J.; J. Hazard. Mater. 2007, 141,
529.
7. Haimour, N. M.; Emeish, S.; Waste Manage. 2006, 26, 651.
8. Linares-Solano, A.; Martín-Gullon, I.; Salinas-Martínez de Lecea, C.; Serrano-Talavera B.; Fuel 2000, 79, 635.
9. Teng, H.; Yeh, T. S.; Hsu, L. Y.; Carbon 1998, 36, 1387. 10. Teng, H.; Hsu, L. Y.; Ind. Eng. Chem. Res. 1999, 38, 2947.
11. Patnukao, P.; Pavasant, P.; Bioresour. Technol. 2008, 99, 8540. 12. Al Bahri, M.; Calvo, L.; Gilarranz, M. A.; Rodriguez, J. J.; Chem. Eng.
J. 2012, 203, 348.
13. Kalderis, D.; Bethanis, S.; Paraskeva, P.; Diamadopoulos, E.; Bioresour.
Technol. 2008, 99, 6809.
14. Xia, J.; Noda, K.; Kagawa, S.; Wakao, N.; J. Chem. Eng. Jpn. 1998, 31,
987.
15. Prapagdee, S.; Piyatiratitivorakul, S.; Petsom, A.; EnvironmentAsia
2014, 7, 60.
16. Dabrowski, A.; Podkościelny, P.; Hubicki, Z.; Barczak, M.; Chemosphe-re 2005, 58, 1049.
17. Teixeira, M. A.; Biomass Bioenergy 2008, 32,857.
18. Almeida, R. R.; Lacerda, L. G.; Murakami, F. S.; Bannach, G.; Demiate, I. M.; Soccol, C. R.; Carvalho Filho, A. S.; Schnitzler, E.; Thermochim. Acta 2011, 519, 50.
19. Vinhal, J. O.; Lima, C. F.; Barbosa, L. C. A.; J. Anal. Appl. Pyrolysis
2014, 107, 73.
20. Teixeira, M. A.; Energy Convers. Manage. 2005, 46, 2068.
21. Maniglia, B. C.; Tapia-Blacido, D. R.; Food Hydrocolloids 2016, 55, 47.
22. Rodriguez-Reinoso, F.; Molina-Sabio, M.; Munecas, M. A.; J. Phys. Chem. 1992, 96, 2707.
23. Szymański, G. S.; Karpiński, Z.; Biniak, S.; Świa̧tkowski, A.; Carbon
2002, 40, 2627.
24. Figueiredo, J. L.; Pereira, M. F. R.; Freitas, M. M. A.; Órfão, J. J. M.;
Carbon 1999, 37, 1379.
25. Pyykkö, M.; Ann. Bot. Fenn. 1985, 22, 129.
26. Sing, K. S. W.; Everett, D. H.; Haul, R. A. W.; Moscou, L.; Pierotti, R. A.; Rouquérol, J.; Siemieniewska, T.; Pure Appl. Chem. 1985, 57, 603. 27. Wu, F. C.; Tseng, R. L.; Juamg, R. S.; Sep. Purif. Technol. 2005, 47, 10.
28. Tseng, R. L.; Tseng, S. K.; Wu, F. C.; Hu, C. C.; Wang, C. C.; J. Chin.
Inst. Chem. Eng. 2008, 39, 37.
29. Graham, D.; J. Phys. Chem. 1955, 59, 896.
30. Alaya, M. N.; Hourieh, M. A.; Youssef, A. M.; El–Sejariah, F.; Adsorpt.