©2014 Science Publication
doi:10.3844/ajessp.2014.336.346 Published Online 10 (4) 2014 (http://www.thescipub.com/ajes.toc)
PREPARATION OF ACTIVATED CARBON FROM PALM OIL
SHELL BY CHEMICAL ACTIVATION WITH Na
2CO
3AND
ZnCl
2AS IMPRENATED AGENTS FOR H
2S ADSORPTION
Kanokorn Hussaro
Rattanakosin College for Sustainable Energy and Enviroment, Rajamangala University of Technology Rattanakosin,
Puthamonthon Sai 5, Salaya, Puthamonthon, Nakhon Pathom, 73170, Thailand
Received 2014-04-21; Revised 2014-04-22; Accepted 2014-06-17
ABSTRACT
and 743.71 m2/g, respectively. Thus, chemical agent (Na2CO3) can be used effectively as an operating strategy to optimize surface area. The synthetices activated carbon with suggested BET surface area were is good agreement with those obtained with chemical activation by Na2CO3 impregnation. Moreover, activated carbon was used to the H2S removal, it is also for environment benefit in which air pollution by H2S emission and impact on human health could be potentially reduced.
Keywords: Activated Carbon, Palm Oil Shell, Chemical Activation, Impregnated Agents and Hydrogen
Sulfide Adsorption
1. INTRODUCTION
In Thailand, palm oil is one of primary agricultural products and it generates a large volume of residues. Every year about 0.53 million tons of palm oil shell are produced as by product and inadequely disposed. Only a portion of this residues is used for limites practical applications, such as raw material for the production of fuel and feed stock for obtaining chemical compounds. Palm oil residues results in palm oil mill industry. It is an environmental problem that has been frequently discussed by several sectors of the society. One alternative to attach this problem is by using adsorbents to remove pollutants from several effluents. This, has generated an increasing interest in the search for effiecient and low cost materials to be used as adsorbents for the elimination of air pollutants.
Activated Carbons (AC) as microporous materials are of the most important adsorbents, which have been extensively used as adsorbents, catalyst and catalyst supports in a variety of industrial and environmental applications. AC is an extremely versatile material as a effective adsorbent with its high adsorptive capacity and high surface area ( ahin and Saka, 2013). AC has been considered for the capture and eventual recovery of metal ions in aqueous industrial discharges for many years and indeed has enjoyed some commercial application. Metal plating and fabrication industries stand to benefit from a fast and robust method of sizing activated carbon adsorption columns for pollution mitigation and/or metals recovery (Banjonglaiad et al., 2008). Among the factors making the activated carbon application attractive are availability, environmentally friendly material, safe and very low cost of the staring materials coupled with its high surface area (Diya’uddeen et al., 2013).
Production of activated carbon can either be through physical or chemical activation. The former involves primary carbonization of raw material (below 700°C) followed by controlled gasification at higher temperatures (>850°C) (Yorgun et al., 2009). Physical
activation of AC consists of two steps (i) the first step is the elimination of most of the hydrogen and oxygen contents by pyrolysis of carbonaceous material at high temperature and inert atmosphere and (ii) the second step is to activate the chars at high temperature and in presence of steam or carbon dioxide as oxidizing gases. Carbon atoms are extracted by these agents from the structure of the porous carbon according to the following endothermic reactions (Arami-Niya et al., 2011):
C + CO2 → 2CO (1)
C + H2O → CO + H2 (2)
Chemical activation is inpregnated with an activation reagent and heated in an inert atmosphere. The carbonization step and the activation step proceed simultaeously. By dehydration and oxidation reactions of the chemicals, pore are developed. Produced char then washed to rid it from residual impurities (Kılıç et al., 2012). Chemical activation is the process that normally takes place at lower temperature and shorter time than those used in physical activation (Yorgun et al., 2009). Moreover, the advanges of chemical activation are: Its low enery and operating cost, higher carbon yields ad large surface areas when compared with physical activation. Chemical activation also has better development of porous structure. Knowledge of different variables during the activation process is very important in developing porosoty of carbon which is sought for give applications. Chemical activation is held in the presence of dehydrating reagents such as KOH, K2CO3, NaOH, ZnCl2, H3PO4 and H2SO4 which influence pyrolytic decomposition and inhibit tar formation. These reagents can improve the pore distribution and increase the surface area of adsorbents (Kılıç et al., 2012).
supplies for production of AC is necessary. Although coal and wood are mostly used as precursor, agricultural waste products would be a better choice in some applications (Arami-Niya et al., 2011). Due to high carbon and low ash contents, many of agricultural by-products are appopriate for use as precursors for AC production it is accepted that the differences in material composition, such as lignin, cellulose and holocellulose influence the pore structure and pore size distribution of AC (Arami-Niya et al., 2010).
Hydrogen Sulfide (H2S) is an extremely toxic and malodorous gas, which is harmful to human health and has detrimental effects on many industrial catalysts, as well as a major source of acid rain when oxidized to sufur oxide. Many efforts have been focused on H2S removal from gas as the restrictive emission standards are worldwide enacted. One of the major challenges for natural gas purification is the removal of H2S. Amine scrubbing along with the Claus process is a dominant tecnology currently used in industry for H2S removal in natural gas, especially for high concentration of H2S removal. But this method loses its efficiency and economic advantage for low concentration of H2S removal. Alkali-impregnated activated carbons are usually used as low concentration of H2S oxidation catalysts, due to their high activity and fast kinetics of reaction (Chen et al., 2011).
In this research, palm oil shell as by product palm oil mill industries, was used as a raw material for the production of activated carbon by chemical activation. Palm oil shell is a cheap and abudant agricutural solid waste in tropical countries (Thailand). Palm oil shells have been successfully converted into well-developed activated carbons used for removal of various gaseous pollutants (Guo et al., 2007). On the other hand, they have been done on the utilization of palm oil shell as a raw material of AC production and it was reported that due to its high density, high carbon contents and low ash, this material can be used for the production of good quality AC (Arami-Niya et al., 2010).
This research focuses on different impregnation agents and the ratio of impregnated agent as controlling for activated carbon production and also on its pore volume and removal of H2S for biogas purification. The aim of this study to achieving the following: (i) Production of activated carbon by chemical activation with Na2CO3 and ZnCl2 as impregnation agent using palm oil shell as a raw material, (ii) analysis of chemical and physical properties for activated carbon product is
performed by ultimate analysis, proximate analysis and surface area, (iii) Hydrogen Sulfide (H2S) adsorption test.
2. MATERIALS AND METHODS
2.1. Materials
Palm oil shell was used as raw material in this research study. Palm oil shell was colected from Suratthani provice, southen Thailand. This raw material was dried at 110°C for 24 h and then crushed with a cutting mill and sieved to a particle size in the range from 1-2 mm. was used for preparation of activated carbon by chemical activation. The standard activated carbon (Comercial grade; code No.CGC-11A) was supplied from C. Gigantic Carbon Co. Ltd. Zinc Chloride (ZnCl2) and Sodium Carbonate (Na2CO3) were dissolved in distilled water to prepare a saturated solution.
2.2. Experimental Method
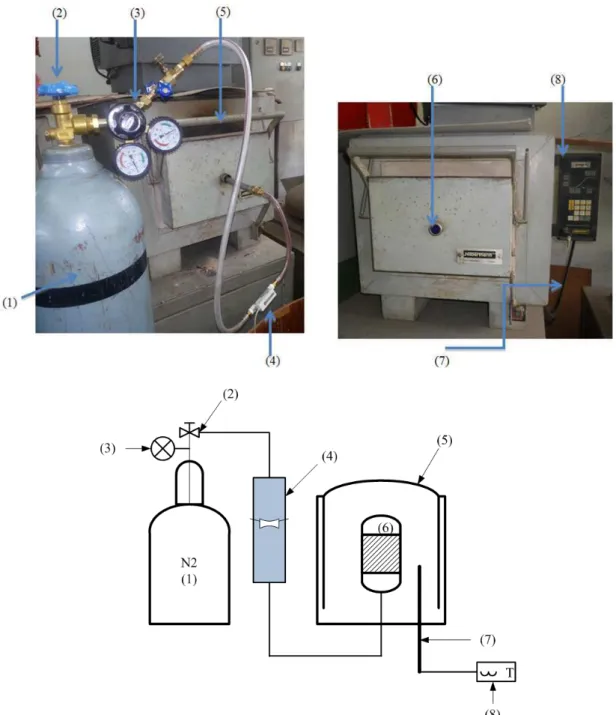
Fig. 1. Experimental set up for activated carbon production; (1) nitrogen gas cylinder, (2) regulating valve, (3) pressure gauge, (4)
rotameter, (5) furnace, (6) reactor, (7) thermocouple and (8) temperature control
2.3. Characterization of Impregnated Samples
and Standard Activated Carbon
An elemental analysis was carried out using a CHNS/O ANALYZER (PE2400 SeriesII). Gaseous products were freed by pyrolysis in high-purity oxygen
Table 1. List of experimental design, the ratio of char: Chemical agent, activation temperature and retention time
Samples Impregnate agent Char: Agent ratio Activation temperature (°C) Retention time
AC_Na11 Na2CO3 1:1 700 2
AC_Na12 Na2CO3 1:2 700 2
AC_Na13 Na2CO3 1:3 700 2
AC_Z11 ZnCl2 1:1 700 2
AC_Z12 ZnCl2 1:2 700 2
AC_Z13 ZnCl2 1:3 700 2
The surface areas of various samples were determined by gas adsorption and desorption (ICG, 2010). The specific surface areas of the samples were calculated using the Brunauer-Emmett-Teller (BET) single-point method. Approximately 0.01-0.03 g of the sample was placed in the sample cell, heated to 623 K and held at that temperature for 6 h under a N2/He flow. The sample was then cooled to room temperature and dipped into liquid nitrogen. After the adsorption of nitrogen reached equilibrium, the sample cell was then dipped into a water bath at room temperature. The amount of nitrogen desorped was measured by a gas chromatograph (Hussar et al., 2011). The specific surface area of the prepared activated carbons was estimated by the BET method using N2 adsorption isotherm data.
Yield is usually defined as final weight of activated carbon produced after impregnation, washing and drying, divided by initial weight of raw material. The following relationship is used for calculating the yield of activated carbons (Kılıç et al., 2012):
Yield (%) = (Wac/Wi)×100 (3)
Where:
Wi = Mass of impregnated sample
WAC = Mass of the dried carbon after washing
2.4 Hydrogen Sulfide (H
2S) Adsorption Test
Activated carbon with different microporous and mesoporous structure were presented and then impregnated with different content of ZnCl2 and Na2CO3 to remove H2S in the biogas product at low temperature of ambient temperature (about 30°C). The H2S adsorption using small column test equipment was conducted on the adsorbents of the activated carbon product. Adsorbent (20 g) of the impregnated activated carbon was placed in a glass column 5 cm diameter, using biogas product (Saitawee et al., 2014) as test gas with the total flow rate 15 cm3 min−1. Biogas detector was used to analyze the concentration of H2S in the inlet and outlet gases, as shown Fig. 2.
Fig. 2. Experimental set up for Hydrogen Sulfide (H2S) adsortion test
3. RESULTS
3.1. Characteristics of Raw Material
The results of component characteristics of raw materials fed to reactor are summarized in Table 2. The ultimate proximate analyses of palm oil shell were as follows (dry wt basis%): Fixed carbon 24.1, moisture 4.2, ash 2.3, volatile 69.4, C 49.90, H 6.37 and N 0.46. A high carbon and low ash content of palm oil shell indicates that the precursor is suitable for activated carbon production. After carbonization process with the temperature of 600°C for 1 h, the volatile content of the chars decreased from 69.4 to 24.34% whilst the fixed carbon content increased from 24.1 to 70.65%. This phenomena was due to the release of volatile matter during physical process (with N2 inlet during activation process), which subsequently caused an increase in carbon content.
3.2. Effect of Impregnated Ratio on Activated
Carbon Product
Table 2. Ultimate and proximate analyses of palm oil shell
and char product
Proxiamte analysis (wt.%) Palm oil shell Char product
Moisture 4.20 1.77
Ash 2.30 5.01
Volatiles 69.40 24.34
Fixed carbon 24.10 70.65
Ultimate analysis (wt.%)
C 49.90
H 6.37
N 0.46
HHV (cal/g) 4735.00
Table 3. Characteristics of the standard activated carbon and
activated carbon product (AC, AC_Z11, AC_Z12, AC_Z13, AC_Na11, AC_Na12 and AC_Na13)
Sample C (%) H (%) N (%)
AC (Standard) 72.58 1.97 0.63
AC_Na13 78.76 0.38 0.77
AC_Na12 76.46 0.48 0.65
AC_Na11 75.19 0.88 0.09
AC_Z13 76.14 0.93 0.72
AC_Z12 75.42 1.32 0.79
AC_Z11 73.98 1.02 0.71
The impregnation process of char produces an increment in the carbon. The carbon content was increased with in increasing impregnate ratio of reagent. The high char product: Chemical agent ratio (1:3) in the AC_Na13 and AC_Z13 samples indicates a degree of aromaticity and suggests that during heating a polymerization takes place. It can be inferred that impregnation process of palm oil shell activated with Na2CO3 had carbon content higher than that of palm oil shell activated with ZnCl2.
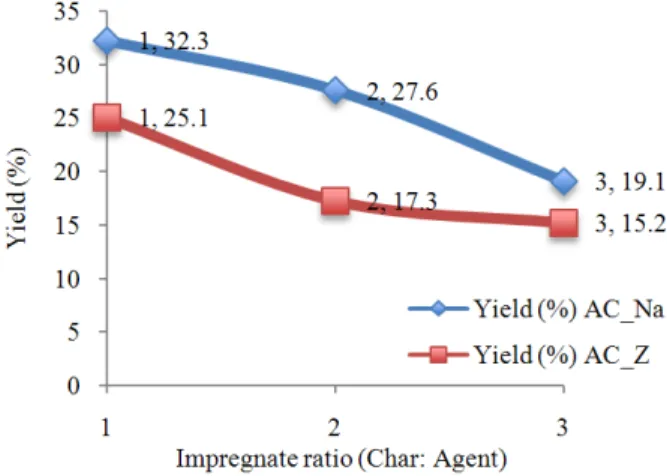
The impregnation ratio plays an important role on the yield of activated carbon, as seen in Fig. 3, which the yield percentage had been calculated from Equation 1-3. The yields of activated carbons were in the range of 32.3-19.1% for Na2CO3 and 25.1-15.2% for ZnCl2 impregnated samples. It is shown that yield of carbon decreased as the impregnation ratio increases, due to promoting the gasification of char and increasing the total weight by excess chemicals (Kılıç et al., 2012). Moreover, it is observed that the activated carbon for Na2CO3 agent is higher than activated carbon for ZnCl2 agent. The activating agent in the interior of particles produces a dehydrating effect on the already transformed components during the heat treatment (700°C). It is very possible that cross-linking reactions are predominant in this step with the subsequent reduction in the exit of volatile matter and tars, leading to high active carbon yield observed (Yorgun et al., 2009).
Fig. 3. The impregnation ratio on the yield of activated carbon
ordinate against P/P0 as the abscissa reveal much about the structure of the adsorbing material (called adsorbent) simply from their shape.
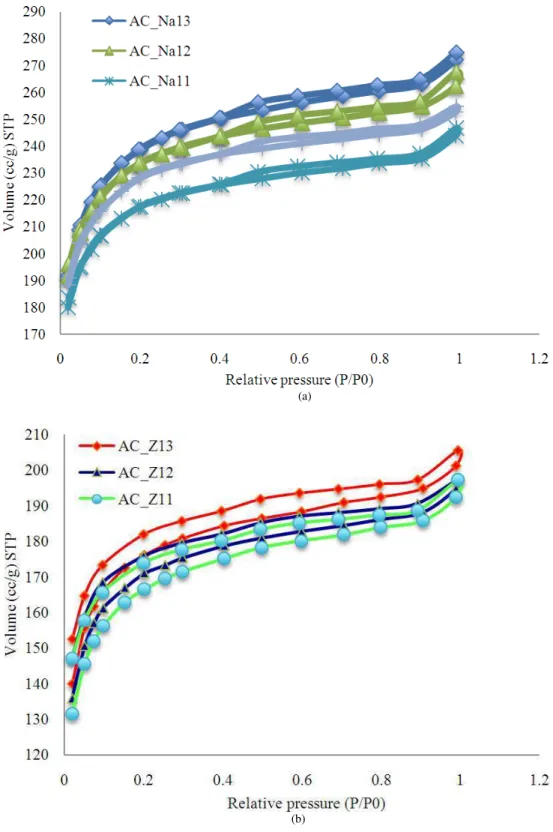
N2-adsorption/desorption isotherms was using the adsorption process, as shown in Table 4 and Fig. 4; the Brunauer, Deming, Deming and Teller (BDDT) theory, the basis of modern IUPAC classification, was used in this research to characterize the N2-adsorption isotherms. As can be seen from Fig. 4 had very silimar shapes. The nitrogen uptake was significate only in the low pressure where P/P0<0.2. At the higher relative pressure (P/P0>0.2) had a nearly horizontal plateau, which no futher adsorption was observed and the adsorption curve reached equilibrium at P/P0 about 0.2. This results indicating type I of isotherm based on the classification of IUPAC, which is characteristic of adsorbents having extremely small pores. On the other hand, in these material, the limiting uptake is controlled by accessible micropore volume rather than by the internal surface area (Diya’uddeen et al., 2013).
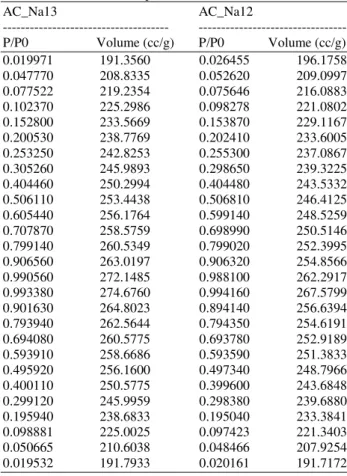
Table 4. Adsorption/desorption isotherms of N2 at 77 K on
activated carbon product
AC_Na13 AC_Na12
--- ---
P/P0 Volume (cc/g) P/P0 Volume (cc/g)
0.019971 191.3560 0.026455 196.1758
0.047770 208.8335 0.052620 209.0997
0.077522 219.2354 0.075646 216.0883
0.102370 225.2986 0.098278 221.0802
0.152800 233.5669 0.153870 229.1167
0.200530 238.7769 0.202410 233.6005
0.253250 242.8253 0.255300 237.0867
0.305260 245.9893 0.298650 239.3225
0.404460 250.2994 0.404480 243.5332
0.506110 253.4438 0.506810 246.4125
0.605440 256.1764 0.599140 248.5259
0.707870 258.5759 0.698990 250.5146
0.799140 260.5349 0.799020 252.3995
0.906560 263.0197 0.906320 254.8566
0.990560 272.1485 0.988100 262.2917
0.993380 274.6760 0.994160 267.5799
0.901630 264.8023 0.894140 256.6394
0.793940 262.5644 0.794350 254.6191
0.694080 260.5775 0.693780 252.9189
0.593910 258.6686 0.593590 251.3833
0.495920 256.1600 0.497340 248.7966
0.400110 250.5775 0.399600 243.6848
0.299120 245.9959 0.298380 239.6880
0.195940 238.6833 0.195040 233.3841
0.098881 225.0025 0.097423 221.3403
0.050665 210.6038 0.048466 207.9254
0.019532 191.7933 0.020161 191.7172
The adsorption curve of Fig. 4 has rises more rapidly in the intermediate zone and shown a wide hysteresis loop instead of nearly retracing the adsorption curve. This behavior is typical of mesoporous and macroporous materials, such as, those that have pores with openings greater than 2 nm (20 Å) and 50 nm (500 Å), respectively. Therefore, pore are likely to have a wide range of sizes and shapes. There were closed in the pressure region near saturation. This shaps reveals that the adsorbing solid contains mesopores with an upper size restriction. For ease of comparison, activated carbon obtained at three different values of char product/chemical agent ratio (1:1, 1:2 and 1:3), when the char to agent ratio was increased by a factor of agent in the range of 1-3, it was found that a volume of N2 gas adsorption increasing with increased char product: Chemical agent ratio. Frome above results, it was found that the highest volume of nitrogen gas adsorption of AC_Na13>AC_Na12>AC_Na11>AC_Z13>AC_Z12>AC _Z11 were 274.676, 267.5799, 246.6837, 205.6472, 197.4784 and 197.2957 cc/g, respectively. Which, the AC_Na13 and AC_Na12 had the highest volume of nitrogen gas adsorption more than standard activated carbon (AC, 254.7467 cc/g).
(a)
(b)
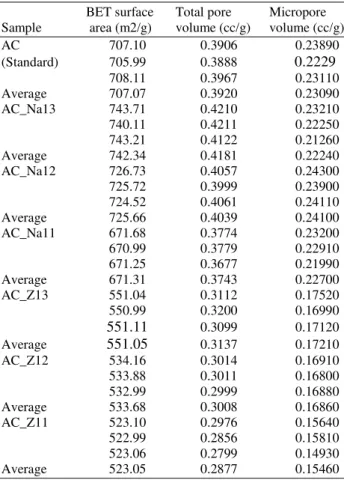
Table 5. Surface area analysis on activated carbon derived
from palm oil shell by chemical activation with Na2CO3 and ZnCl2
BET surface Total pore Micropore
Sample area (m2/g) volume (cc/g) volume (cc/g)
AC 707.10 0.3906 0.23890
(Standard) 705.99 0.3888 0.2229
708.11 0.3967 0.23110
Average 707.07 0.3920 0.23090
AC_Na13 743.71 0.4210 0.23210
740.11 0.4211 0.22250
743.21 0.4122 0.21260
Average 742.34 0.4181 0.22240
AC_Na12 726.73 0.4057 0.24300
725.72 0.3999 0.23900
724.52 0.4061 0.24110
Average 725.66 0.4039 0.24100
AC_Na11 671.68 0.3774 0.23200
670.99 0.3779 0.22910
671.25 0.3677 0.21990
Average 671.31 0.3743 0.22700
AC_Z13 551.04 0.3112 0.17520
550.99 0.3200 0.16990
551.11 0.3099 0.17120
Average 551.05 0.3137 0.17210
AC_Z12 534.16 0.3014 0.16910
533.88 0.3011 0.16800
532.99 0.2999 0.16880
Average 533.68 0.3008 0.16860
AC_Z11 523.10 0.2976 0.15640
522.99 0.2856 0.15810
523.06 0.2799 0.14930
Average 523.05 0.2877 0.15460
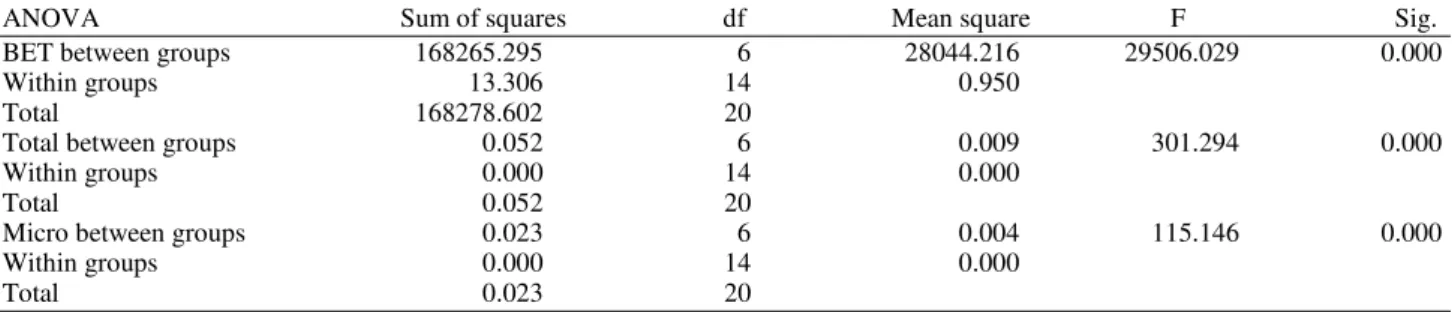
The normality of the respond data is assumed. There were analyzed by using statistical software. The results of appying the analysis of variance are shown in Table 6, which it was found that a significant interaction the char product: Chemical agent ratio on BET surface area, total pore volume and micropore volume (Sig. <0.05).
The results of gas adsorption studies conducted utilizing a gas biogas on samples were shown in Table 6. Hydrogen Sulfide (H2S) adsorption for AC_Na13 and AC_Z13 showed that the amount of H2S adsorbed increased progressively with Na2CO3 impregnation. The total amount of H2S adsorbed followed the order of AC_Na13>AC>AC_Z13. The average capacity of H2S adsorbed by AC_Z13 was 241.67 ppm. While that of AC_Na13 was 247.33 ppm, which was better agreed with AC (245 ppm) as compared with other sample (as can seen in Table 7). These results show that the activated carbon could absorb the H2S, but the adsorption capacity of impregnation ratio these result confirmed by pore
volume analysis, showing the increase pore volume with increased char product: Chemical agent ratio.
4. DISCUSSION
The results of this research showed that palm oil shell can be successfully converted into activated carbon with surface area properties. It was found that the amount of Na2CO3 and ZnCl2 used for chemical activation controls the characteristics of the carbon contents including BET surface area, total por volume, micro pore volume and H2S adsorption. Increasing the amount of chemical agent (Na2CO3 and ZnCl2) used for chemical activation; char product: Na2CO3 and char product: ZnCl2 ratio from 1:1 to 1:3 resulted in 9.69 and 5.07%, respectively, increase in the BET surface area. These findings are in agreement with the few reports in the orther hand that have addressed the possibility of using ZnCl2 activation (Yorgun et al., 2009). In particular, Arami-Niya et al. (2010) reported activation of palm oil shell with ZnCl2, which chemically activated samples without extra heat treatment showed an increase in the surface area and pore volume with the increase in the mass ratio of ZnCl2, methan adsortion did not improve at any ratio (less than 13 cm3/g). There are various methods of determing surface are of an adorbent which include water and gas adsorption, inverse of iodine value and BET machine (Diya’uddeen et al., 2013). The most reliable and recognized internationally results are those obtained from BET machines.
Moreover, Arami-Niya et al. (2011) was presented chemically ACs from palm oil shell as a precusor have been prepared using low concetration of zinc chloride or phosphoric acid as activating agent, which combined physical and chemical activation of palm shell revealed that H3PO4 impregnated samples attained better activation rates than those prepared using ZnCl2or physically samples.
Table 6. ANOVA tables from BET surface area, Total pore volume and Micro pore volume respectively versus char product to
chemical agent ratio
ANOVA Sum of squares df Mean square F Sig.
BET between groups 168265.295 6 28044.216 29506.029 0.000
Within groups 13.306 14 0.950
Total 168278.602 20
Total between groups 0.052 6 0.009 301.294 0.000
Within groups 0.000 14 0.000
Total 0.052 20
Micro between groups 0.023 6 0.004 115.146 0.000
Within groups 0.000 14 0.000
Total 0.023 20
Table 7. The value of H2S adsorption
Amount of H2S from biogas before Amount of H2S from biogas after
Samples adsorption (ppm) adsorption with activated carbon (ppm)
AC 266.00 23.00
267.00 22.00
269.00 22.00
Average 267.33 22.33
AC_Na13 265.00 19.00
268.00 20.00
266.00 18.00
Average 266.33 19.00
AC_Z13 269.00 29.00
268.00 26.00
270.00 27.00
Average 269.00 27.33
As indicated by Table 6 there were different the value of H2S adsorption, due to different chemical impregnated char product. The different impregnated agent on char product for H2S adsoprtion of AC_Na13 and AC_Z13 were the results of the distinguishably different of the surafce area. For the AC and AC_Z13 the activities of H2S dissolve abd dissociation are refrained, which slows down the removal rate, due to the hydrophobic property of the carbon surface water film is difficult to be formed when the relative pressure of water is low. While, AC_Na13 an additional factor that Na2CO3 easily absorbs water should be considered. A basic solution film in formed on the surface of the AC_Na13, which promotes the dissociation. The present results in practice suggest that activated carbon production can be optimized if a impregnated with charproduct: Na2CO3 (1:3) can be used effectively as a means of higher surface area and H2S adsorption.
5. CONCLUSION
The experimental study two contributions. First, it provides the palm oil shell from palm oil mill: As raw material in producing activated carbon by chemical activation. Activated carbon was prepared from char product of palm oil shell using Na2CO3 and ZnCl2
activated carbon (1%). However, the extra installation costs and process complexity in biogas purification system concept should be evaluated with the economic gain achieved due to extra biogas produced. Accordingly, the activated carbon produced from palm oil shell can be used as adsorbents for various environmental application including removing H2S compound from industrial production, which this is the developing research in the future for developed purify system. Therefore, Na2CO3 was found more effective than the other agents as chemical reagent under same conditions in terms of high BET surface area, total pore volume, micropore volume and H2S adsortion. In these case, H2S adsorption was operated on lab-scale, due to there were used in biogas production on lab-scale. In future research, other impregnants and activated carbons will be used in studies similar to those described in this reseach. Morover, H2S adsorption will be operate in large scale for adsortion from source of biogas production on industrial.
6. ACKNOWLEDGMENT
The gratefully acknowledge the provision of Scientific and Technological Research Equipment, Chulalongkorn University researchers gratefully acknowledge the provision of Scientific and Technological Research Equipment, Chulalongkorn University and King’s Mongkut University of Technology Thonburi.
7. REFERENCES
Arami-Niya, A., W.M.A.W. Daud and F.S. Mjalli, 2010. Using granular activated carbon prepared from oil palm shell by ZnCl2 and physical activation for methane adsorption. J. Anal. Applied Pyrol., 89: 197-203. DOI: 10.1016/j.jaap.2010.08.006
Arami-Niya, A., W.M.A.W. Daud and F.S. Mjalli, 2011. Comparative study of the textural characteristics of oil palm shell activated carbon produced by chemical and physical activation for methane adsorption. Chem. Eng. Res. Design, 89: 657-664. DOI: 10.1016/j.cherd.2010.10.003
Banjonglaiad, T., E. Croiset, P.L. Douglas, S. Douglas and W. Teppaitoon et al., 2008. Dynamic measurement of copper (II) ion adsorption in activated carbon fixed bed columns. Am. J. Environ. Sci., 4: 412-419. DOI: 10.3844/ajessp.2008.412.419 Chen, Q., J. Wang, X. Liu, Z. Li and W. Qiao et al.,
2011. Structure-dependent catalytic oxidation of H2S over Na2CO3 impregnated carbon aerogels. Microporous Mesoporous Mater., 142: 641-648. DOI: 10.1016/j.micromeso.2011.01.011
Diya’uddeen, B.H., I.A. Mohammed, B.Y. Jibril and I.M. Bugaje, 2013. Comparison of BET and water adsorption techniques. Am. J. Eng. Applied Sci., 6: 282-285. DOI: 10.3844/ajeassp.2013.282.285 Guo, J., Y. Luo, A.C. Lua, R.A. Chi and Y.L. Chen et al.,
2007. Adsorption of Hydrogen Sulphide (H2S) by activated carbons derived from oil-palm shell. Carbon, 45: 330-336. DOI: 10.1016/j.carbon.2006.09.016 Hussar, K., S. Teekasap and N. Somsuk, 2011. Synthesis
of Zeolite a from by-product of aluminum etching process: Effects of reaction temperature and reaction time on pore volume. Am. J. Environ. Sci., 35-42. DOI: 10.3844/ajessp.2011.35.42
ICG, 2010. Micromeritics ASAP 2010 C. Aggregates, Interfaces and Materials,ICG Montpellier.
Kılıç, M., E. Apaydın-Varol and A.E. Pütün, 2012. Preparation and surface characterization of activated carbons from Euphorbia rigida by chemical activation with ZnCl2, K2CO3, NaOH and H3PO4. Applied Surface Sci., 261: 247-254. DOI: 10.1016/j.apsusc.2012.07.155
Oliveira, L.C.A., E. Pereira, I.R. Guimaraes and A. Vallone, 2009. Preparation of activated carbons from coffee husks utilizing FeCl3 and ZnCl2 as activating agents. J. Hazardous Mater., 165: 87-94. DOI: 10.1016/j.jhazmat.2008.09.064
ahin, Ö. and C. Saka, 2013. Preparation and characterization of activated carbon from acorn shell by physical activation with H2O-CO2 in two-step pretreatment. Bioresource Technol., 136: 163-168. DOI: 10.1016/j.biortech.2013.02.074
Saitawee, L., KanokornHussaro, Teekasap, S. and N. Cheamsawat, 2014. Biogas proction from anaerobic co-digestion of cow dung and organic wastes (napier pak chong i and food waste) in Thailand: Temperature effect on biogas product. Am. J. Environ. Sci., 10: 129-139. DOI: 10.3844/ajessp.2014.129.139
Xiao, Y., S. Wang, D. Wu and Q. Yuan, 2008. Catalytic oxidation of hydrogen sulfide over unmodified and impregnated activated carbon. Separat. Purificat.
Technol., 59: 326-332. DOI:
10.106/J.seppur.2007.07.042