Rev Saúde Pública 2004;38(4) www.fsp.usp.br/rsp
Current Comments
Estimating prevalence of inadequate nutrient
intake
Betzabeth Slater, Dirce Lobo M archioni e Regina M ara Fisberg
Departamento de Nutrição. Faculdade de Saúde Pública. Universidade de São Paulo. São Paulo, SP, Brasil
Correspondence to: Betzabeth Slater Departamento de Nutrição Faculdade de Saúde Pública Av. Dr. Arnaldo, 715 2º andar 01246-904 São Paulo, SP, Brasil E-mail: [email protected]
Received on 22/4/2003. Reviewed on 30/10/2003. Approved on 5/2/2004. Keywords
Nutritional requirements. Diet. Food consumption. Nutrients. Diet surveys. Nutrition assessment.
Abstract
In assessing food intake patterns in groups of individuals, it is usually important to know how many of these individuals present nutrient intakes above or below a determined criterion. This information is relevant for planning healthcare actions, both in monitoring and in assessing such interventions, and also for the purposes of regulating commercial activities. This paper discusses a new methodology for estimating the prevalence of inadequate nutrient intake, with the Dietary Reference Intakes as the reference values. The utilization of diet surveys that allow the most accurate quantitative estimate possible is dealt with. These should use repeated measurements of food intake, on non-consecutive days. The food intake should be adjusted for between-person and within-person variance, so as to obtain a corrected distribution for the nutrient intake values. After constructing this distribution curve based on the corrected estimated parameters (average and standard deviation), the EAR method (Estimated Average Requirement) can be used as a cutoff point for verifying the proportion of individuals that has inadequate nutrient intake. This corresponds to the area of the curve below this reference value. It is concluded that this new approach minimizes the error in the calculation of the prevalence of inadequate nutrient intake, since it takes into consideration the random characteristics of the diet.
INTRODUTION
The objective of this work was to discuss a method-ology for estimating the prevalence of inadequate nutrient intake. This is an important topic in studies of the prevalence of the intake of different nutrients. Such studies provide backing for establishing hypoth-eses regarding the relationships between diet and health. In assessing diets within groups of individu-als, it is often of interest to determine how many of these individuals present intakes that are above or below a given criterion. This information is relevant for planning healthcare actions, both in monitoring and in assessing such interventions, and also for the purposes of regulating commercial activities.
ASSESSMENT OF DIETS W ITHIN GROUPS
al-Rev Saúde Pública 2004;38(4) www.fsp.usp.br/rsp
defined as the average food consumption over a long period of time, over which a dietary pattern is main-tained.10,17 On the other hand, the present diet refers
to the average food consumption over a short period of time around the present day.21
The quantitative assessment of inadequacy of di-etary intake requires an accurate determination of the habitual quantities of foods consumed by the indi-vidual. It must take into consideration all the foods that contribute towards the total nutrient intake.9,11,20,21
Among the methods most utilized for estimating the diet, the Food Frequency Questionnaire (FFQ), the 24-hour Recall (24hR) and Daily Records (DR) can be high-lighted. The FFQ, although it estimates the habitual diet and is greatly utilized in epidemiological studies for verifying diet-disease relationships, rarely has sufficient accuracy to be utilized for assessing the adequacy of nutrient intake, among individuals or in groups. This is due to the particular characteristics of this method.21,13
In the FFQ, foods are presented on a pre-established list that therefore does not consider all the foods available for consumption, and it utilizes standardized measure-ments. In addition to this, different foods are often ag-gregated within the same item.21 More accurate
esti-mates can be obtained by the methods of Daily Records and 24-hour Recall. These methods, besides being based on individuals’ recent memories, allow open responses, thereby enabling a more detailed picture of the popula-tion’s consumption to be obtained.9
Consideration also has to be given to the diffi-culty of accurately and precisely estimating the diet, because of its variable nature.21 The daily variability
of the diet depends on the real variation in foods consumed by individuals, which is due to the diver-sity, heterogeneity and fluctuations in day-to-day consumption. It must also be noted that individuals have intrinsically different characteristics, such as preferences, which lead them to select distinct foods. Furthermore, people may react differently on differ-ent occasions, for example at breakfast time, when one day they eat biscuits and the next day they eat bread.5 According to Beaton et al3 (1979), the
influ-ence of factors such as seasonality, days of the week, sequences of questionnaire application or different interviewers explains a small proportion of the vari-ability in consumption. Thus, the habitual diet could be explained by the following model:21
Y = µ + individual i + ε (equation 1) where:
Y= nutrient intake ready been discussed in previous
Portuguese-lan-guage publications.1,8,12
The RDA, or some percentage of it, has been uti-lized as a cutoff point for assessing the prevalence of inadequate nutrient intake. This approach has led to erroneous quantification of the proportion of indi-viduals with inadequate intake.6 Beaton (1994)4
sug-gested a method that, by comparing the distribution of the habitual intake with the EAR, would lead to an unbiased estimate of the prevalence.
The statistical methods presented in the literature for estimating the prevalence of inadequate nutrition intake consist of probabilistic approaches and ap-proaches using EAR as a cutoff point. The latter method is considered to be a simplification of the former9 and,
as well as being simple, it does not require great parametrical presuppositions for its utilization.13,14
Thus, EAR is an appropriate reference estimate for as-sessing inadequate nutrient intake, defined as the nu-trient intake that corresponds to the estimated average need for a given stage of life and gender.
In this method, the prevalence of inadequacy is the proportion of individuals whose intake is less than the EAR. To utilize the EAR as a cutoff point, it is necessary to determine the distribution of the habitual intake among the population, the variance in food consump-tion and the EAR. The premises of the method are: 1. Nutrient need and intake are independent
variables.
2. The distribution of the needs is symmetrical (and not necessarily normal).
3. The variance in the intake of the distribution of the needs is relatively small in relation to the variance in the distribution of the intake. Or in other words, the individual variation in intake is greater than the variation of the needs among the population.
Small deviations in relation to these premises have a small effect on the performance of the method. How-ever, this method does not function well when consump-tion and need are highly correlated, as is the case with energy, or with iron among women of fertile age, whose needs are known to have asymmetrical distribution.4,6
ESTIMATION OF THE HABITUAL DIET
!
Rev Saúde Pública 2004;38(4) www.fsp.usp.br/rsp
µ = true average intake
Individual i = effect of variance between individuals
ε = error term
In this model, the habitual intake of a nutrient is formed by the true average (µ), influenced by the ef-fect of each individual in the population, for which the variability is measured by the variance between individuals and is denoted by (Sb2). Since this
func-tion cannot be measured directly, the true average intake cannot be measured free of error.7
The variations in the habitual intake given by day-to-day fluctuations in food intake can be measured by the variance within individuals, denoted by (Sw2).
This function represents an individual’s variability around his own average, when and whenever it is evaluated through multiple observations.
In addition to these, a third source of variation must be mentioned: the variation given by the measure-ment error of the instrumeasure-ment utilized. This is defined as the difference found between the observed value and the true intake. The result of these two compo-nents can be referred to as the error term (ε).7
The estimate of the intake distribution includes an estimate of all the percentiles and allows the subse-quent calculation of other statistical parameters such as the arithmetic mean, standard deviation, coeffi-cient of variation and also tests of hypotheses relat-ing to the habitual intake.9 Even if the average and
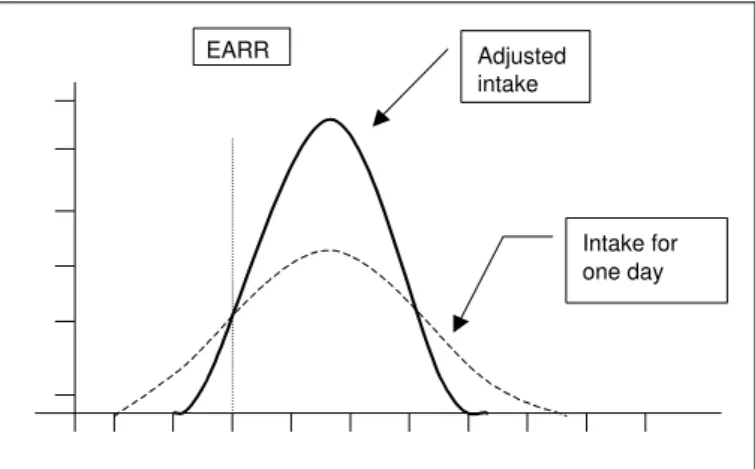
median values of the food intake for groups can be calculated with just one measurement, within-person variance may distort the estimates of percentiles above or below the average by increasing the total variance of the distribution, which makes the distribution wider and inflated. Thus, an estimate of the
prevalence of nutrient intake within a de-fined population that is based on the con-sumption on a single day may overestimate the percentage of individuals with inad-equate intake, regardless of whether the nu-trient intake is excessive or deficient.
The application of statistical methods gives the possibility of removing the day-to-day vari-ability that is due to variation in within-person consumption. In such cases, the distribution will then solely reflect the variation that exists be-tween the individuals in the group. The “ad-justed” distribution of the habitual intake has less variance than the distribution estimated us-ing only one day of dietary intake (Figure 1).
To apply the statistical methods to the adjustment of the diet, it is necessary to have at least two inde-pendent measurements from at least one representa-tive sample of the individuals evaluated, on non-con-secutive days. Only by means of repeated observa-tions is it possible to estimate the variability of the daily nutrient intake.18
Hoffmann et al9 (2002), in a study made with the
objective of estimating the distribution of dietary intake from repeated measurements over the short term, such as via the use of multiple 24hR, concluded that only two repeated measurements were necessary for this estimate, although the sample of the repeated days needed to cover all the seasons of the year and days of the week.
After choosing the method, it must be emphasized that there are no methods capable of measuring di-etary intake exactly, or in other words, free from er-rors. Measurement error is intrinsic to any method for assessing food consumption.2,21
CALCULATION OF THE PREVALENCE OF INADEQUATE CONSUMPTION
After estimating the distribution of the habitual intake, it must be verified whether this is normally distributed. If it is not, a transformation to remove the asymmetry can be suggested.7 Logarithmic
transfor-mation is often utilized, although this is just one of the alternatives. Following this, to estimate the pro-portion of individuals whose habitual intake is above or below a given reference value (EAR), the distribu-tion of the nutrient must be obtained, free from the effect of within-person variability.
It is therefore necessary to calculate the within-per-son variance (Sw2) and between-person variance (S
b 2).
Figure 1 - Effect of w ithin-person variation in the distribution of the
frequency of intake values.
EARR Adjusted intake
" Rev Saúde Pública 2004;38(4) www.fsp.usp.br/rsp
To obtain these components, variance analysis (ANOVA) is utilized. It is stressed that, since the within-person variance is of interest, at least two days of information for each person is required.
The estimates of within-person variance are calcu-lated in accordance with the following relationships:
RMSw = Sw2
RMSb = Sw2 + k S b
2
Sb2 = (RMS b - Sw
2) / k (equation 2)
The total variance Sobs2 of an observed distribution
is given by the sum of the within-person and between-person variances:18,7
Sobs2= S w
2 + (S b
2) / k (equation 3)
Rearranging equation 3, we have the relationship between the ratio of the standard deviation for the whole population and the standard deviation of the within-person variation (Sobs/Sb)18 (equation 5):
Sobs2/S b
2=(S b
2+(S w
2/k))/S b
2=(1+S w
2/k(S b
2) (equation 4)
Taking the square root: Sobs /Sb = ((1 + Sw2/ k(S
b
2))1/2 (equation 5)
To remove the within-person variance, the equa-tion put forward by the US Naequa-tional Academy of Sci-ence Subcommittee on Criteria for Dietary Evalua-tion can be used – equaEvalua-tion 6.18 For data with normal
distribution, this approach allows the reconstruction of the whole distribution from the average and the variance, thereby also enabling the recalculation of all the percentiles.18,9
Adjusted value for the nutrient=average+(xi-average)*Sb/Sobs (equation 6) where:
the average is the average value for the group xiis the value observed for each individual
the ratio Sb/Sobs is the inverse of the ratio in equation 5 The next step is to adjust the distribution of the nutrient, by utilizing the values obtained from equa-tion 6. Since the average is unaffected by the within-person variance (Sw), the adjusted distribution and the raw distribution must maintain the same average value, although the dispersion of the values is ex-pected to be less.
The final step will be to verify the prevalence of inadequacy in the population group. For this, the adjusted distribution is utilized, so as to remove the within-person variability. This prevalence corre-sponds to the proportion of individuals in the group whose habitual intake is less than the EAR estab-lished for the nutrient (Figure 2).
To calculate the area of the curve that corresponds to the proportion of individuals with inadequate con-sumption, a distribution known as the reduced nor-mal distribution is utilized:
Z = (EAR – average) / SD (equation 6) where:
average is the adjusted average for the group SD is the standard deviation for the adjusted distribution
EAR is the estimated average requirement of the nutrient
These calculations require that the nutrient distri-bution should follow a normal distridistri-bution. It is em-phasized that these corrections are appropriate for estimates of groups of individuals, but that they can-not be utilized for identifying individuals who are below the cutoff point.
EXAMPLE: PREVALENCE OF INADEQUATE PHOSPHORUS INTAKE IN A GROUP OF AD O LESCEN TS
The prevalence of inadequate phosphorus intake was estimated for a group of 79 female adolescents,
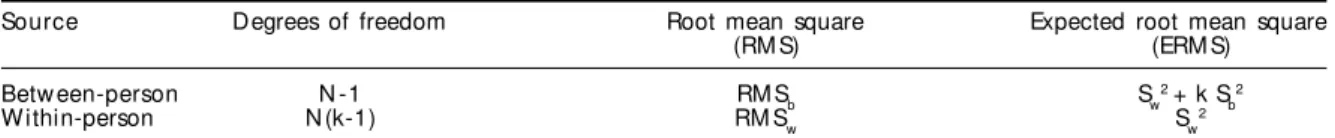
Table 1 – Variance analysis (ANOVA).
Source Degrees of freedom Root mean square Expected root mean square
(RM S) (ERM S)
Betw een-person N -1 RM Sb Sw2 + k S
b 2
W ithin-person N (k-1) RM Sw Sw2
RMSb: Between-person root mean square
RMSw:Within-person root mean square
#
Rev Saúde Pública 2004;38(4) www.fsp.usp.br/rsp
utilizing data from Slater et al. (2003).19 The method
utilized was 24-hour recall, with three repeated meas-urements over an interval of 45 days, none of which on consecutive days. After variance analysis (ANOVA), the following data were obtained:
Following the steps and utilizing the equations, the following were obtained:
Sw2= 126498.429
Sb2=(349103.677–126498.429)/3=74201.749
Calculating the ratio Sobs /Sb:
Sobs/Sb=(1+(126498.429/(3*74201.749))1/2
=1.252303 Sb/Sobs = 0.798529
Correcting the distribution according to equation 6
Adjusted value for phosphorus =801.9+(xi– 801.9)* 0.798529
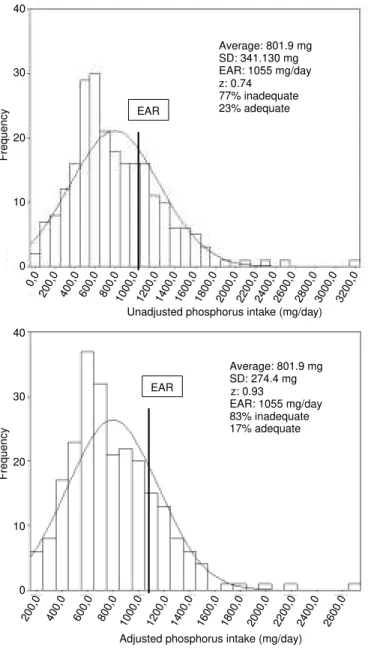
The adjusted and unadjusted curves can be seen in Figure 2.
FINAL CONSIDERATIONS
Many of the errors in assessing dietary in-take derive from comparing average nutrient intake with the RDA. When the average in-take for a population or group extrapolates the RDA, it may be concluded that the evalu-ated group has reached or exceeded the rec-ommendations. However, the RDA was estab-lished as a target for individual consumption, as revised by the NRC (1980 and 1989).16,15
In fact, the variation in consumption gener-ally exceeds the variation in the recommen-dation for the majority of nutrients. The aver-age for the habitual intake needs to be greater than the RDA for there to be a low prevalence of inadequate consumption. Even in the case of the average reaching or extrapolating the RDA, a certain proportion of the individuals will present inadequate consumption. The median or average for the intake of a popula-tion must not be utilized for estimating the preva-lence of inadequate consumption when this nutrient has an EAR. The prevalence of inadequacy must be observed from the starting point of a distribution of the frequencies of the intake values, with verifica-tion of the format and variability of the curve for the population studied. In the case of nutrients without
Figure 2 - Adjusted and unadjusted distribution of the estimated phosphorus
intake among female adolescents.
Average: 801.9 mg SD: 341.130 mg EAR: 1055 mg/day z: 0.74
77% inadequate 23% adequate
Average: 801.9 mg SD: 274.4 mg z: 0.93
EAR: 1055 mg/day 83% inadequate 17% adequate EAR
EAR 40
30
20
10
0
Frequency
40
30
20
10
0
Frequency
Adjusted phosphorus intake (mg/day) 200,0 400,0 600,0 800,0 1000,0 1200,0 1400,0 1600,0 1800,0 2000,0 2200,0 2400,0 2600,0
200,0 400,0 600,0 800,01000,0 1200,0 1400,0 1600,0 1800,0 2000,0 2200,0 2400,0 2600,0 0,0
2800,0 3000,0 3200,0 Unadjusted phosphorus intake (mg/day)
Table 2 - Variance analysis for a sample of three days, for 79 female adolescents.
Source Sum of squares Degrees of freedom Root mean square Expected root mean square
Betw een-person 27230086.8 78 349103.677 sw2 + k S b 2
W ithin-person 19986751.7 158 126498.429 sw2
$ Rev Saúde Pública 2004;38(4) www.fsp.usp.br/rsp
an EAR, prevalence estimates utilizing these refer-ence standards (the DRIs), cannot be made. The DRI Committee9 recommends caution in the
interpreta-tion of the descriptive statistics (average, median and percentiles). When the average intake of the nutrient exceeds the AI, it is expected that there will be low prevalence of inadequacy. However, when the aver-age intake of the nutrient for the population is less than the AI, no conclusion can be reached in relation to the percentage of individuals with inadequate in-take of the nutrient.
With regard to the utilization of this
methodol-REFERÊN CIAS
1. Amancio OMS. Novos conceitos das recomendações de nutrientes. Cad Nutr 1999;18:55-8.
2. Armstrong BK, White E, Saracci R. Principles of exposure measurement in epidemiology. 2nd ed.
Oxford: Oxford University Press; 1995. v. 21.
3. Beaton GH, Milner J, Corey P, McGuire V, Cousins M, Stewart E et al. Sources of variance in 24-hour dietary recall data: implications for nutrition study design and interpretation. Am J Clin Nutr
1979;32:2546-59.
4. Beaton GH. Approaches to analysis of dietary data: relationship between planned analyses and choice of metodology. Am J Clin Nutr 1994;59 Suppl:253S-61S.
5. Bergamaschi DP. Correlação intraclasse de Pearson para pares repetidos: comparação entre dois estimadores [tese de doutorado]. São Paulo: Faculda-de Faculda-de SaúFaculda-de Pública da USP; 1999.
6. Carriquiry A. Assessing the prevalence of nutrient inadequacy. Public Health Nutr 1999;2:23-33.
7. Cole TJ. Sampling, study size, and power. In: Margetts B, Nelson M. Desing concepts in nutricional
epidemiology. 2nd ed. London: Oxford University
Press; 2000.
8. Fisberg RM, Marchioni D, Slater B. Avaliação da dieta em grupos populacionais [on-line]. In: Usos e aplicações das Dietary Reference Intakes – DRIs ILSI/ SBAN; 2001. Disponível em http://www.sban.com.br/ educ/pesq/LIVRO-DRI-ILSI.pdf [2004 fev 12].
9. Hoffmann K, Boeing H, Dufour A, Volatier JL, Telman J, Virtanen M et al. Estimating the distribution of usual dietary intake by short-term measurements. Eur J Clin Nutr 2002;56 Suppl 2:S53-62.
10. Liu K, Stamler J, Dyer A, McKeever J, McKeever P. Statistical methods to assess and minimize the role of intra-individual variability in obscuring the
relationship between dietary lipids and serum cholesterol. J Chron Dis 1978;31:399-418.
11. Majem SLl. Tipos de estudo em epidemiologia nutricional In: Majem SLl, Bartrina JA, Verdú MJ. Nutrición y salud pública: métodos, bases científicas y aplicaciones. España: Masson; 1995. p. 66-72.
12. Marchioni LDM, Fisberg RM, Slater B. As novas recomendações nutricionais: perspectiva histórica, usos e aplicações. Nutr Pauta 2002;10:34-40.
13. N ational Academy of Sciences. D ietary Reference intake, for energy carbohydrate, fiber, fat, fatty acids, cholesterol, protein, and amino acids. Washington (DC): National Academic Press; 2002.
14. N ational Academy of Sciences. D ietary Reference intake: application in Dietary Assessment. Washing-ton (DC): National Academic Press; 2000.
15. N ational Research Council. Recommended D ietary Allowances. 9th ed. Washington (DC): National
Academic Press; 1989.
16. N ational Research Council. Recommended D ietary Allowances. 9th ed. Washington (DC): National
Academic Press; 1980.
17. Nusser SM, Carriquiry AL, Dodd KE, Fuller WA. A semi-parametric transformation approach to estimating usual daily intake distribution. J Am Statist Assoc 1996;91:1440-9.
18. Sempos CT, Looker AC, Johnson CL, Woteki CE. The importance of withing -person variability in estimating prevalence. In: M onitoring Dietary Intakes. New York: Springer-Verlag; 1991. p. 99-109.
19. Slater B, Philippi ST, Fisberg RM, Latorre MRDO. Validation of a semi-quantitative adolescent food frequency questionnaire applied at a public school in São Paulo, Brazil. Eur J Clin Nutr 2003;57:629-35.
20. Tarasuk V, Beaton GH. Statistical estimation of dietary parameters: implications of patterns in within-subject variation – a case study of sampling strategies. Am J Clin Nutr 1992;55:22-7.
21. Willett WC. Nutritional Epidemiology. 2nd ed. Oxford:
Oxford University Press; 1998.