Oliveira AF Valente JG Leite IC
Departamento de Epidemiologia e Métodos Quantitativos em Saúde. Escola Nacional de Saúde Pública. Fundação Instituto Oswaldo Cruz. Rio de Janeiro, RJ, Brasil
Correspondence:
Andreia Ferreira de Oliveira Fundação Oswaldo Cruz Escola Nacional de Saúde Pública Departamento de Epidemiologia e Métodos Quantitativos em Saúde
R. Leopoldo Bulhões, 1480 – sala 815 Manguinhos
21041-210 Rio de Janeiro, RJ, Brasil E-mail: [email protected] ocruz.br Received: 3/29/2007
Reviewed: 6/28/2007 Approved: 7/30/2007
Aspects of tobacco attributable
mortality: systematic review
ABSTRACT
The objective of the article was to assess methodologies published and applied in calculating mortality attributable to smoking. A review of the literature was made for the period 1990 to 2006, in the electronic databases MEDLINE and LILACS. A total of 186 studies were found, which measured mortality based on calculating the smoking-attributable risk. Of these, a total of 41 were selected. The studies that were carried out in the United States and Canada presented a more standard methodology and reported smoking attributable mortality to be 18%-23%, with male mortality being 25%-29% and female mortality 14%-17%. The variations can be attributed to methodological differences and to different estimates of the main tobacco-related illnesses.
DESCRIPTORS: Smoking, mortality. Attributable risk. Epidemiologic studies. Review [Publication type].
INTRODUCTION
Tobacco, the most widespread and widely used drug in the world, was respon-sible for approximately 50% of 5 million offi cial deaths in 2000, in developing countries.19,65 It is estimated that in the period 2002/2030, tobacco-attributable
deaths will decrease by 9% in developed countries, but increase by 100% (to 6.8 million) in developing countries. It is also estimated that by 2015, smoking related deaths will be 50% more than those caused by the HIV/AIDS epidemic and that tobacco will be responsible for approximately 10% of all deaths on the planet.38
A systematic review of 139 studies concerned with the prevalence of tobacco smoking in adults found that more than 1.1 billion people across the world smoke, of which 82% reside in developing countries.31 In 2000, the prevalence
of tobacco smoking in the world was greater among men, although the difference between the sexes has been decreasing in developed countries (prevalence is 37% among men and 21% among women). In the Latin America and Caribbean region, the prevalence was estimated to be 32% in 2000, which corresponds to 40% among men and 24% among women.32
The negative health effects caused by cigarette smoking are well documented and the control of smoking is considered by the WHO to be one of the greatest present challenges to public health.26
There is strong evidence to suggest that tobacco forms part of the causality chain of nearly 50 different illnesses, in particular cardiovascular diseases, cancer and respiratory illness.59,60,64
Ezzati et al20 (2005) estimated that 11% of all cardiovascular deaths in the world
The various impacts that tobacco has on society can be measured in number of ways, such as the mortality bur-den, which represents tobacco-attributable deaths.62
Smoking attributable mortality (SAM) has been widely used in studies and is considered to be one of the most relevant summary statistics, due to its capacity to show the harm that tobacco causes to health.63 However,
some methodological problems in the calculation of its estimates have been found (Tanuseputro et al, 2005).54
SAM has been used in studies in the form SAM%, meaning that of all deaths in general or of those with a specifi c cause, the proportion that are attributable to tobacco.
The objective of the study was to analyze the meth-odologies used and published to calculate smoking attributable mortality.
METHODS
In May 2006, a review of the MEDLINE and LILACS electronic databases was carried out for the period 1990 to 2006. Search terms taken from the Medical Subject Headings (MeSH) were used, including “at-tributable risk”, “mortality”, “smoking” and the key words “tobacco”, “smoking habit”. The systematic review method was used to analyze the studies. A total of 186 articles were found, 30 of which were selected since they were concerned with SAM as a method for calculating the attributable risk in a given population. As a result of this fi rst review, a further 11 articles and abstracts were identifi ed, of which three from the 1970s and 1980s were included since they were among the most cited articles. In this way, a total of 41 articles were included in the analysis.
Articles published in Portuguese, Spanish, English, French and Italian were included; those in other lan-guages were excluded irrespective of whether they contained a summary in English. Another criterion for their inclusion was the measurement of SAM based on the calculation of the population attributable fraction (PAF). The PAF uses parameters relating to the preva-lence of smoking according to the level of exposure (smokers, ex-smokers and non-smokers) and the rela-tive risk (RR) of death from tobacco-related illnesses. Potential causes of error that are normally ignored in the calculation of the PAF include: uncertainties about present and past exposure to smoking, the use of estimates for prevalence, mortality or relative risk by stratum, and the long latency period between expo-sure and occurrence of the disease. If estimates are to be more applicable and accurate, these variables need to be taken into consideration. The PAF is useful for estimating the proportion of cases of a disease that could have been prevented with reduction or elimination of the risk factor.45,47
Data extraction from the chosen articles was carried out by just one reviewer using a pre-determined method. The following information was gathered: authors, loca-tion where the study was carried out, publicaloca-tion year, study period, age or age range of the population under study, way of calculating the SAM, parameters used for this calculation, main fi ndings and limitations or prob-lems identifi ed. The SAM is obtained by multiplying the number of deaths for each tobacco-related disease by the population attributable fraction, PAF.
In the 1980s, the Centre for Disease Control and Pre-vention (CDC) created a software called SAMMEC (Smoking-Attributable Mortality, Morbidity, and Economic Costs Software, version II), with the aim of calculating the SAM and thus estimating the impact of tobacco-related diseases. This software allows for the rapid calculation of deaths, years of life lost, direct costs of health care, indirect costs of death and costs of smoking associated incapacity.49 The SAMMEC
was used as a criterion for evaluating the scientifi c articles. It uses 22 tobacco related diseases in adults, four in children (resulting from mothers who smoke), RR drawn from the Cancer Prevention Study59 (CPS) II
with a calculation method that measures prevalence ac-cording to the level of exposure to smoking in different countries and smoking attributable deaths by burning. Those articles that fulfi ll these criteria and also include deaths resulting from passive smoking scored higher points. The other articles score proportionally lower marks in relation to the criteria.
RESULTS
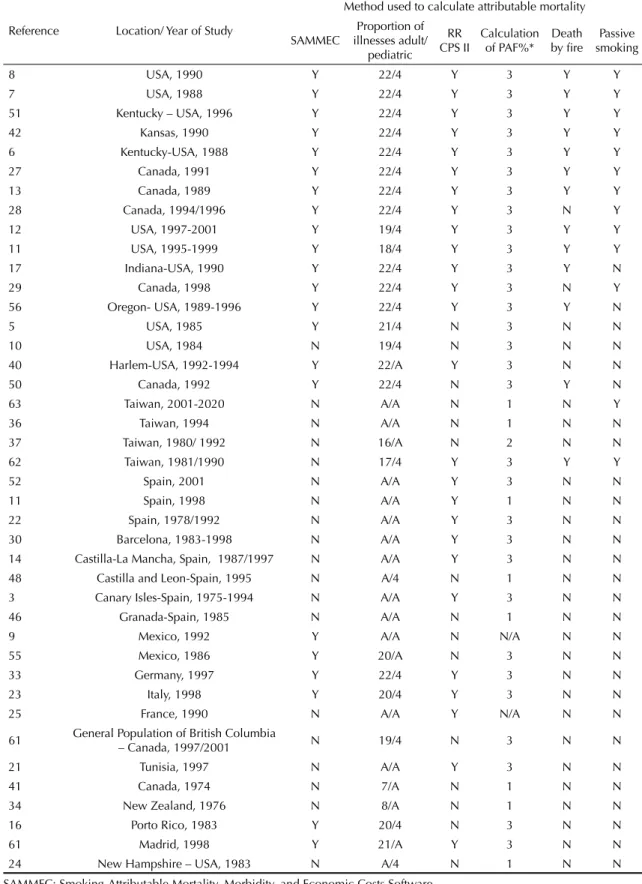
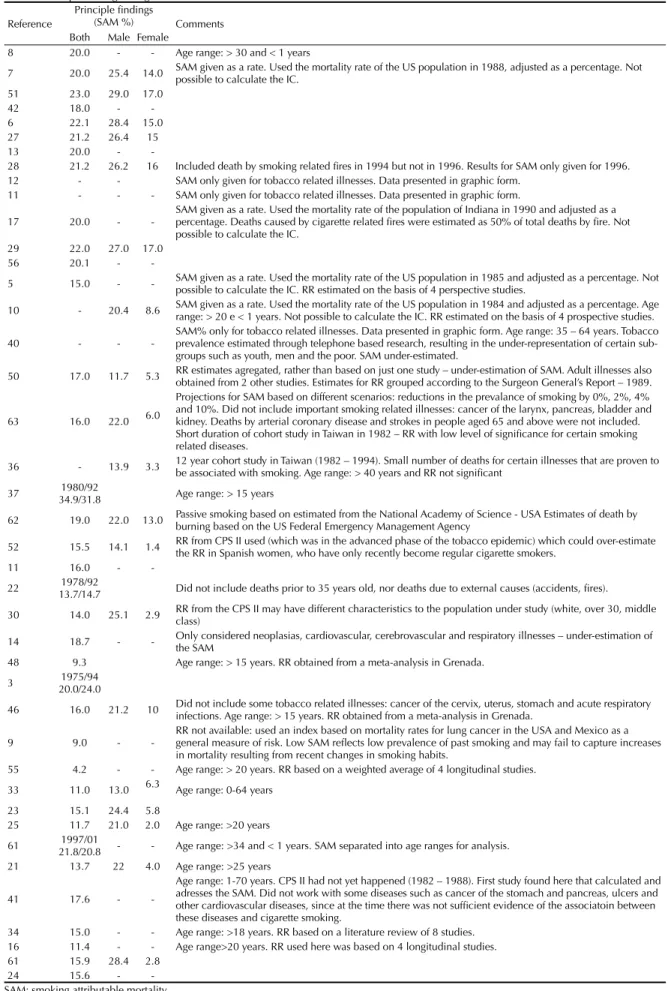
Table 1 shows the results of the articles, by author/year, location of publication, period of the study, age range under analysis and method of calculating the SAM. Table 2 presents the principle fi ndings and general characteristics of the studies.
The studies were organized according to the methods used for calculating the SAM. Firstly those articles that scored highest points in the criteria for evaluating the methodology were taken into consideration, fol-lowed by those that involved one or more uncertainty or discrepancy.
Most studies used an age range of between 1 and 35 for the calculation of the SAM, with some excep-tions1,2,3,14,22,30,61,63 that work with the over 35 age group.
The age range under analysis was not mentioned in some studies.9,24,50,59
Most studies used the relative risk (RR) from CPS II, with some exceptions.9,10, 15,16,24,34,36,37,41,46,48,50,59,61,63
Articles Lung Cancer, Women
0 10 20 30 40 50 60 70 80 90
100% Over 35 Other ages
Other ages Over 35 years of age
Other ages Over 35
Other ages Over 35
11 51 14 2 12 30 1
30A 62B
>25 (21) >20 (10) >20 (25) >20 (16) >15 (48) >15 (46) >65 (23) >70 (7) 30-69 (7)
35-64 (40) 35-64 (23)
Articles Lung Cancer, Men
0 10 20 30 40 50 60 70 80 90 100%
11 51 14 2 12 30 1
14A 30A 62B
>25 (21)
>20 (10) >20 (25) >20 (16)
>15 (48)
>15 (46) >65 (23) >70 (7) 30-69 (7)
35-64 (40) 35-64 (23)
Articles COPD, Women
0 10 20 30 40 50 60 70 80 90 100 %
11 51 14 2 12 30 1
30A
>15 (46) >15 (48) >20 (10) >20 (25) >20 (16) >25 (21) >65 (23) >70 (7) 30-69 (7)
35-64 (23)
Articles COPD, Men
0 10 20 30 40 50 60 70 80 90 100 %
51
11 14 2 12 30 1 14A 30A
>25 (21)
>20 (10) >20 (25) >20 (16)
>15 (48)
>15 (46) >65 (23) >70 (7) 30-69 (7) 35-64 (23)
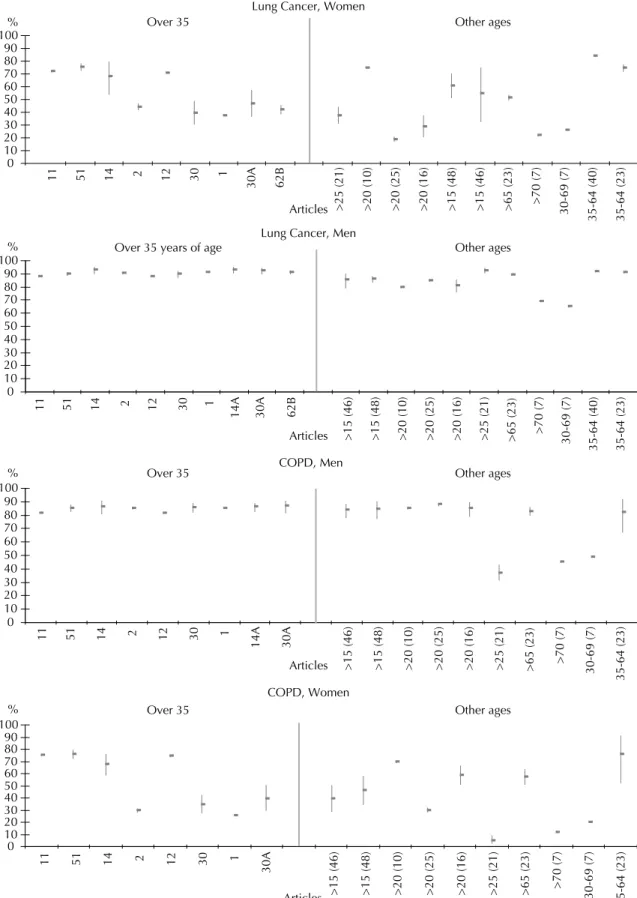
Figure 1. Tobacco attributable mortality (%) and confi dence intervals (CI) for lung cancer and chronic obstructive pulmonary (COPD) disease, by sex and age range in the different studies.
Studies 1 and 44 do not provide absolute numbers for calculating the CI. Certain studies provide a very accurate number for the CI, making it impossible to be included visually in the fi gures below.2,8,12,13,14,26, 29
Articles
Cerebrovascular Disease, Women
Other ages
0 10 20 30 40 50 60 70
% 35-64 Over 65
11 51 14 40 30 30A 1 23 11 51 14 30 30A 1 23
>15 (46) >15 (48) >20 (10) >20 (25) >20 (16) >25 (21) >35 (2) >35 (12) >35 (65B)
Cerebrovascular Disease, Men
Articles 0
10 20 30 40 50 60 70 80
% 35-64 Over 65 Other ages
11 51 14 14A 40 30 30A 1 23 11 51 14 14A 30 30A 1 23
>15 (46) >15 (48) >20 (10) >20 (25) >20 (16) >25 (21) >35 (2) >35 (12) >35 (65B)
IHD, Women
Articles 0
10 20 30 40 50 60
% 35-64 Over 65 Other ages
11 51 14 40 30 1 23 30A 14 25 11 30
30A
1
23 16 51
>15 (46) >15 (48) >20 (10) >25 (21) >35 (12) >35 (62B) <65 (25) <65 (16)
70%
Articles
35-64 Over 65 Other ages
0 10 20 30 40 50 60
11 51 14
14A
40 30
30A
1 23 14 25 11 51
14A 30 30A 1 23 16
>15 (46) >15 (48) >20 (10) >25 (21) >35 (12)
>35 (62B) <65 (62B) <65 (16)
IHD, Men
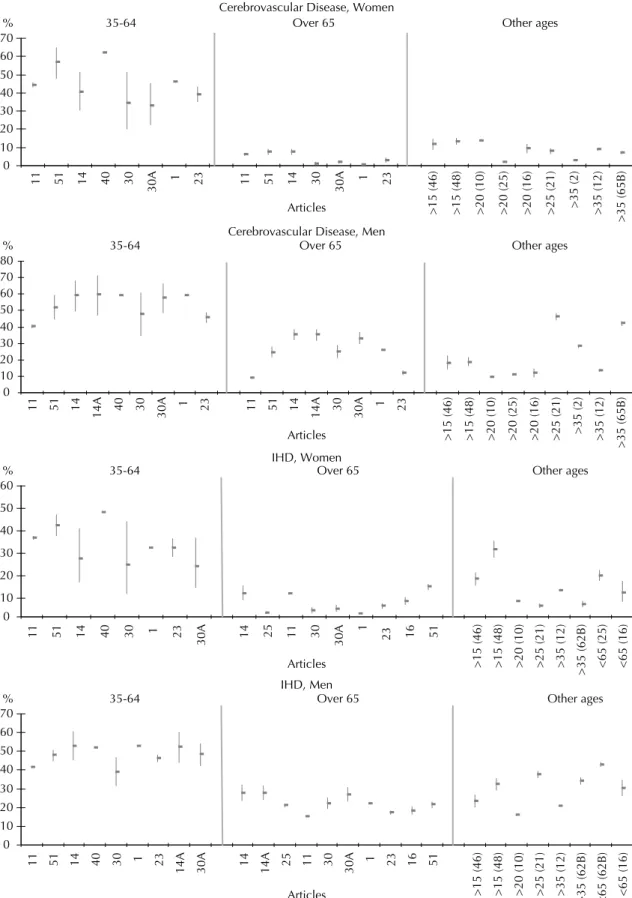
Figure 2. Tobacco attributable mortality (%) and confi dence intervals (CI) for cerebrovascular disease and ischemic hearth disease (IHD), by sex and age range in the different studies.
Studies 1 and 44 do not provide absolute numbers for calculating the CI. Certain studies provide a very accurate number for the CI, making it impossible to be included visually in the fi gures below.2,8,12,13,14,26
Table 1. Methods used in calculating the SAM by location and date of study.
Reference Location/ Year of Study
Method used to calculate attributable mortality
SAMMEC illnesses adult/ Proportion of pediatric
RR
CPS II Calculation of PAF%* by fi reDeath smokingPassive
8 USA, 1990 Y 22/4 Y 3 Y Y
7 USA, 1988 Y 22/4 Y 3 Y Y
51 Kentucky – USA, 1996 Y 22/4 Y 3 Y Y
42 Kansas, 1990 Y 22/4 Y 3 Y Y
6 Kentucky-USA, 1988 Y 22/4 Y 3 Y Y
27 Canada, 1991 Y 22/4 Y 3 Y Y
13 Canada, 1989 Y 22/4 Y 3 Y Y
28 Canada, 1994/1996 Y 22/4 Y 3 N Y
12 USA, 1997-2001 Y 19/4 Y 3 Y Y
11 USA, 1995-1999 Y 18/4 Y 3 Y Y
17 Indiana-USA, 1990 Y 22/4 Y 3 Y N
29 Canada, 1998 Y 22/4 Y 3 N Y
56 Oregon- USA, 1989-1996 Y 22/4 Y 3 Y N
5 USA, 1985 Y 21/4 N 3 N N
10 USA, 1984 N 19/4 N 3 N N
40 Harlem-USA, 1992-1994 Y 22/A Y 3 N N
50 Canada, 1992 Y 22/4 N 3 Y N
63 Taiwan, 2001-2020 N A/A N 1 N Y
36 Taiwan, 1994 N A/A N 1 N N
37 Taiwan, 1980/ 1992 N 16/A N 2 N N
62 Taiwan, 1981/1990 N 17/4 Y 3 Y Y
52 Spain, 2001 N A/A Y 3 N N
11 Spain, 1998 N A/A Y 1 N N
22 Spain, 1978/1992 N A/A Y 3 N N
30 Barcelona, 1983-1998 N A/A Y 3 N N
14 Castilla-La Mancha, Spain, 1987/1997 N A/A Y 3 N N
48 Castilla and Leon-Spain, 1995 N A/4 N 1 N N
3 Canary Isles-Spain, 1975-1994 N A/A Y 3 N N
46 Granada-Spain, 1985 N A/A N 1 N N
9 Mexico, 1992 Y A/A N N/A N N
55 Mexico, 1986 Y 20/A N 3 N N
33 Germany, 1997 Y 22/4 Y 3 N N
23 Italy, 1998 Y 20/4 Y 3 N N
25 France, 1990 N A/A Y N/A N N
61 General Population of British Columbia
– Canada, 1997/2001 N 19/4 N 3 N N
21 Tunisia, 1997 N A/A Y 3 N N
41 Canada, 1974 N 7/A N 1 N N
34 New Zealand, 1976 N 8/A N 1 N N
16 Porto Rico, 1983 Y 20/4 N 3 N N
61 Madrid, 1998 Y 21/A Y 3 N N
24 New Hampshire – USA, 1983 N A/4 N 1 N N
SAMMEC: Smoking-Attributable Mortality, Morbidity, and Economic Costs Software CPS II: Cancer Prevention Study
PAF: Population attributable fraction
N: no; Y: yes; N/A: information not given; A: information absent about number of tobacco-related illnesses among adults and children
Table 2. Principle fi ndings and general comments in selected studies. Reference
Principle fi ndings
(SAM %) Comments Both Male Female
8 20.0 - - Age range: > 30 and < 1 years
7 20.0 25.4 14.0 SAM given as a rate. Used the mortality rate of the US population in 1988, adjusted as a percentage. Not possible to calculate the IC. 51 23.0 29.0 17.0
42 18.0 -
-6 22.1 28.4 15.0
27 21.2 26.4 15
13 20.0 -
-28 21.2 26.2 16 Included death by smoking related fi res in 1994 but not in 1996. Results for SAM only given for 1996. 12 - - SAM only given for tobacco related illnesses. Data presented in graphic form.
11 - - - SAM only given for tobacco related illnesses. Data presented in graphic form.
17 20.0 -
-SAM given as a rate. Used the mortality rate of the population of Indiana in 1990 and adjusted as a percentage. Deaths caused by cigarette related fi res were estimated as 50% of total deaths by fi re. Not possible to calculate the IC.
29 22.0 27.0 17.0
56 20.1 -
-5 15.0 - - SAM given as a rate. Used the mortality rate of the US population in 1985 and adjusted as a percentage. Not possible to calculate the IC. RR estimated on the basis of 4 perspective studies.
10 - 20.4 8.6 SAM given as a rate. Used the mortality rate of the US population in 1984 and adjusted as a percentage. Age range: > 20 e < 1 years. Not possible to calculate the IC. RR estimated on the basis of 4 prospective studies.
40 - - - SAM% only for tobacco related illnesses. Data presented in graphic form. Age range: 35 – 64 years. Tobacco prevalence estimated through telephone based research, resulting in the under-representation of certain sub-groups such as youth, men and the poor. SAM under-estimated.
50 17.0 11.7 5.3 RR estimates agregated, rather than based on just one study – under-estimation of SAM. Adult illnesses also obtained from 2 other studies. Estimates for RR grouped according to the Surgeon General’s Report – 1989.
63 16.0 22.0 6.0
Projections for SAM based on different scenarios: reductions in the prevalance of smoking by 0%, 2%, 4% and 10%. Did not include important smoking related illnesses: cancer of the larynx, pancreas, bladder and kidney. Deaths by arterial coronary disease and strokes in people aged 65 and above were not included. Short duration of cohort study in Taiwan in 1982 – RR with low level of signifi cance for certain smoking related diseases.
36 - 13.9 3.3 12 year cohort study in Taiwan (1982 – 1994). Small number of deaths for certain illnesses that are proven to be associated with smoking. Age range: > 40 years and RR not signifi cant
37 34.9/31.81980/92 Age range: > 15 years
62 19.0 22.0 13.0 Passive smoking based on estimated from the National Academy of Science - USA Estimates of death by burning based on the US Federal Emergency Management Agency 52 15.5 14.1 1.4 RR from CPS II used (which was in the advanced phase of the tobacco epidemic) which could over-estimate the RR in Spanish women, who have only recently become regular cigarette smokers.
11 16.0 -
-22 13.7/14.71978/92 Did not include deaths prior to 35 years old, nor deaths due to external causes (accidents, fi res).
30 14.0 25.1 2.9 RR from the CPS II may have different characteristics to the population under study (white, over 30, middle class) 14 18.7 - - Only considered neoplasias, cardiovascular, cerebrovascular and respiratory illnesses – under-estimation of
the SAM
48 9.3 Age range: > 15 years. RR obtained from a meta-analysis in Grenada. 3 20.0/24.01975/94
46 16.0 21.2 10 Did not include some tobacco related illnesses: cancer of the cervix, uterus, stomach and acute respiratory infections. Age range: > 15 years. RR obtained from a meta-analysis in Grenada.
9 9.0 - - RR not available: used an index based on mortality rates for lung cancer in the USA and Mexico as a general measure of risk. Low SAM refl ects low prevalence of past smoking and may fail to capture increases in mortality resulting from recent changes in smoking habits.
55 4.2 - - Age range: > 20 years. RR based on a weighted average of 4 longitudinal studies. 33 11.0 13.0 6.3 Age range: 0-64 years
23 15.1 24.4 5.8
25 11.7 21.0 2.0 Age range: >20 years 61 1997/01
21.8/20.8 - - Age range: >34 and < 1 years. SAM separated into age ranges for analysis. 21 13.7 22 4.0 Age range: >25 years
41 17.6 -
-Age range: 1-70 years. CPS II had not yet happened (1982 – 1988). First study found here that calculated and adresses the SAM. Did not work with some diseases such as cancer of the stomach and pancreas, ulcers and other cardiovascular diseases, since at the time there was not suffi cient evidence of the associatoin between these diseases and cigarette smoking.
34 15.0 - - Age range: >18 years. RR based on a literature review of 8 studies. 16 11.4 - - Age range>20 years. RR used here was based on 4 longitudinal studies.
61 15.9 28.4 2.8
24 15.6 -
With some exceptions,6-8,11,12,13,17,27,42,50,51,56,59,62 deaths
caused by tobacco related fi res were not included in most studies analyzed here.
Deaths associated with passive smoking were not calculated in most of the studies. However, some used deaths associated with lung cancer and heart disease among non-smokers as estimates.11,12,29,62 In addition to
these illnesses, other studies included cerebrovascular diseases 63 and lung cancer alone.6,7,8,13,27 Some studies
also failed to mention the method used for the calcula-tion.28,42,51,59
Estimates for deaths attributed to passive smoking and fi res were, in the majority of studies, drawn from national studies or used relative risk estimates taken from studies that address this question.
Seven studies received a positive evaluation for their calculation of the SAM %.6,7,8,13,27,42,51 These studies also
received a higher scoring because they included in the general calculation of the SAM deaths resulting from passive smoking (Table 1).
Three methods for calculating the PAF were identifi ed (Table 1):
PAF% – the proportion of smoking attributed deaths in a population:
PAF% = Pi(RRi-1)/[1+P(RRi-1)]
where P is the prevalence of exposure to smoking in the population and RR is the relative risk of death (among smokers and ex-smokers), compared with non smokers. The SAM is calculated by multiplying the PAF% by the number of deaths in each disease category. Number 3 is derived from this formula.
PAF% includes the incidence rate of selected causes of death in the general population, and in smokers, non-smokers and ex-smokers. The proportion of smokers to non-smokers and the relative risk of death among smokers and non-smokers are also taken into consideration. The SAM is calculated by multiplying the PAF% by the number of deaths in each disease category.
PAF = [P0+P1 (RR1)+p2 (RR2)]-1/ [P0+P1 (RR1)+p2 (RR2)]
PAF represents the percentage reduction in deaths that would be expected if exposure to the risk factor were removed from the population. p0 = % of never smok-ers; p1= % of current smoksmok-ers; p2= % of ex-smoksmok-ers; RR1= Risk of death of current smokers compared to never smokers; RR2 = Risk of death of non-smokers compared to never smokers.
Ezzati & Lopez18 (2003) showed that the general rate of
SAM globally was 12%, and 18% among men and 5% 1.
2.
3.
among women. In developed countries, this fi gure rose to 19% and in developing countries was 9%. Peto et al44 (1996) observed that in the 44 developed countries
that were analyzed, tobacco was responsible for 24% of all deaths in men and 7% of all deaths in women. In the studies assessed here, the general SAM was between 18% and 23%. In men, the rate was between 25.4% and 29.0% and in women, between 14% and 17% (Table 2).
In the USA and Canada, values for the SAM varied between 15% and 23% and in European countries, between 13.7% and 24.0%. In some Latin American countries, such as Mexico and Porto Rico, the values ranged from 4.2% and 11.4% respectively (Table 2).
As well as the general SAM, articles that calculate the SAM for the four principle tobacco attributable illnesses were also taken into consideration (lung cancer, chronic obstructive pulmonary disease – COPD – cerebrovascu-lar diseases and ischemic heart disease). Figure 1 shows the values and the confi dence intervals for the SAM% - lung cancer and COPD – by sex and age range in the different studies.
Studies (Figure 1) show that an important proportion of deaths by lung cancer and COPD among men are attributable to tobacco, independent of age, with more precise confi dence intervals. The same is not true for women, for whom there are signifi cant variations in the SAM% and wide confi dence intervals.
Cardiovascular and ischemic heart diseases were the only illnesses that showed differences in the age range for the calculation of the SAM% in the studies (35-64 and 65 and over) in relation to the specifi c values of the RR for these illnesses. This was not the case in some articles14,46,48 that used other age ranges. Figure
2 makes a comparison of these two diseases by sex and age range.
The values of the SAM% for cerebrovascular diseases in the 35 – 64 age range varied between 35% and 45%
11,14,23,30 and 55%-65%40,51 for women; for men the rate
ranged from 40%-48%11,23,30 and 52%-60%.1,14,30,40,51 In
the over 65 age range, the results from the studies were found to be more uniform among women and varied by between 2% and 8%. Among men, the variation was between 10% and 12%11,23 and 25%-35%.1,14,30,51
For ischemic heart disease, the SAM% among women in the 35-64 age range was between 22% and 32%1,14,23,30
and 37% and 47%.11,40,51 For men in the same age range,
the value was between 38% and 52%. For the over 65 year olds, some studies calculated a SAM% among women of around 10%11,14,51 and others of between 2%
and 6%.1,16,23,25,30 Among men, the values were between
DISCUSSION
A comparison between the results that Ezzati & Lopez18
(2003) and Peto et al44 (1996) reported for SAM% with
those from studies that use a more uniform methodology (USA and Canada) shows that the general mortality rate (18% - 23%; including 25% - 29% amongst men and 14% - 17% amongst women) was higher for the world and for developed countries in the former studies.
Those tobacco related illnesses that most contribute towards the SAM were cancer of the trachea/ bron-chial/ lungs,2,8,23,51 ischemic heart disease,11,29,30,42,50,51
COPD22,66 and cerebrovascular diseases.3,22,23
Ezzati & Lopez19 (2004) also found cardiovascular
disease, COPD and lung cancer to be the three princi-pal causes of smoking related deaths in developed and developing countries in the year 2000.
It is widely recognized that a considerable number of deaths occur among people aged 65 or over, resulting from ischemic heart and cerebrovascular diseases. Tobacco and other risk factors have been shown to be important causes for these deaths (González Enríquez et al,22 1997). The SAM is low for these diseases in the 65
and over age group, when compared with the 35-64 age group, in which the number of deaths is fewer but the percentage of tobacco attributable deaths is high (40% - 60%), mainly among men. This involves a young adult population that is economically active and dies early from a modifi able risk factor that could be reduced or even eliminated if measures to promote and prevent tobacco addiction amongst younger age groups were established as public health policies.
The differences that were observed in the SAM for the four principle diseases associated with tobacco may refl ect not only the methodological differences in the studies, but also the different prevalences of smok-ing that are used to calculate the FAF in the different countries.
The studies reviewed here are quite heterogeneous in many aspects: the method for calculating the at-tributable fraction,46,48 the inclusion or not of certain
tobacco-related diseases in adults or children,2,14,22,40
the age range considered,50 the inclusion of death by
burning,8,12 passive smoking8,12,29 and the application of
the current prevalence to calculate the SAM. All these factors infl uence the results of the attributable mortality in the various studies.
In addition, factors such as changes in mortality rates, reductions in smoking prevalence, differences in the methods used to calculate the FAF, omission of the consumption of other tobacco related products (cigars, pipes) in calculating the SAM may also have contrib-uted towards the differences in the studies8,11,12,61 and
represent important limitations in the use of the SAM-MEC software.
The SAM is the result of a previous exposure to to-bacco (around ten years between exposure and the development of the disease), a fact that must be taken into consideration in the studies. In a discussion on the fi ndings of Illing & Kaiserman29 (2004), Tanuseputro
et al53 (2004) found that when adjustments are made to
take into account the latency period (either two or three decades) between exposure to smoking and measure-ment of the associated effect (mortality), there is an increase in the estimation of the SAM by between 8% and 22%, depending on the adjustment method that is applied. Just one study calculated the SAM using a ten year latency period.63
While cigarette smoking is associated with a series of illnesses, its infl uence does not appear to be the same for each disease. This fact justifi es the use of different relative risks of death for different illnesses. The RR must be estimated for each population in the study, taking into account different biological, cultural and socioeconomic variables. Obtaining these RR for each country is likely to be costly, since it would require specifi c studies. For this reason, the majority of studies used the RR of death of the CPS II.59
Some authors discussed the criticisms that are held against using the RR from the CPS II to calculate the SAM, since it is likely to overestimate the burden of death. The most relevant criticism points to the fact that the CPS II is a national mortality survey based on a sample of approximately 1.2 million adult Americans aged 30 and over, who present different characteristics to those of the general population of the USA. The great majority of participants in the study were married, white and with high levels of schooling and income. In short, it is held that the sample is not representative of the overall population and as a result, this compromises the possibility of generalizing the results for the whole American population.15,35
The second critique that was commonly made was that the national estimates were adjusted for age, but not for other potentially confounding factors such as alcohol use, level of education, hypertension, and the prevalence of diabetes mellitus.39,52 In response to
these criticisms, Thun et al57,58 (2000) adjusted the RR
obtained from the CPS II for potential confounders such as age, race, education, marital status, occupation, total daily consumption of citrus fruits and vegetables, and alcohol. The results show that adjustments for de-mographic and behavioral factors did not signifi cantly alter the estimates for the SAM, with a difference of no greater than 1.0%. Malarcher et al39 (2000) and Wen et
al63 (2005) also showed that changes in the results after
adjusting for confounding variables were minimal.
In order to reduce the excess risk attributed to smok-ing in the RR of the CPS II, Ezzati & Lopez18 (2003)
of risk estimates, although these were adjusted only for age and sex. The authors used as the basis of their work a method proposed by Peto et al43 (1992), who
used mortality attributed to lung cancer as an indirect marker for the accumulated risk of smoking. This method incorporates the RR of death for tobacco related diseases from the CPS II – also only adjusted for sex and age – corrected by an excess risk of 50.0%. For Sterling et al52 (1993) and Bronnum-Hansen & Juel4
(2000), the advantage of this method is that it does not include in the calculation the prevalence estimate of the at risk population.
These methodological variations may, in part, account for the differences found in the over- and under-estima-tion of the general SAM in the studies considered here
and the different estimates for the principle tobacco-related diseases.
1. Banegas Banegas JR, Gañán LD, Rodríguez-Artalejo F, Enríquez JG, Pérez-Regadera AG, Álvarez FV. Mortalidad atribuible al tabaquismo en España en 1998. Med Clin(Barc). 2001;117(18):692-4. 2. Banegas Banegas JR, Gañán LD, Enríquez JG, Álvarez
FV, Rodríguez-Artalejo F. La mortalidad atribuible al tabaquismo comienza a descender en España. Med Clin (Barc). 2005;124(20):769-71.
3. Bello Luján LM, Lorenzo Ruano P, Gil Muñoz M, Saavedra Santana P, Serra Majem L. Evolución de la mortalidad atribuible al tabaco en las Islas Canarias (1975-1994). Rev Esp Salud Publica. 2001;75(1):71-80. 4. Brønnum-Hansen H, Juel K. Estimating mortality
due to cigarette smoking: two methods, same result.
Epidemiol. 2000;11(4):422-6.
5. Center of Disease Control (CDC). Current trends state-specifi c estimates of smoking-attributable mortality and years of potential life lost, United States, 1985. MMWR Morb Mortal Wkly Rep. 1988;37(45):689-93.
6. Center of Disease Control (CDC). Smoking-attributable mortality – Kentucky, 1988. MMWR Morb Mortal Wkly Rep. 1990;39(38):679-83.
7. Center of Disease Control (CDC). Smoking-attributable mortality and years of potential life lost - United States, 1988. MMWR Morb Mortal Wkly Rep. 1991;40(4):62-3,69-71.
8. Center of Disease Control (CDC). Cigarette smoking-attributable mortality and years of potential life lost - United States, 1990. MMWR Morb Mortal Wkly Rep. 1993;42(33):645-9.
9. Center of Disease Control (CDC). Smoking-attributable mortality - Mexico, 1992. MMWR Morb Mortal Wkly Rep. 1995;44(19):372-3; 379-81.
10. Center of Disease Control (CDC). Perspectives in disease prevention and health promotion smoking-attributable mortality and years of potential life lost, United States, 1984. MMWR Morb Mortal Wkly Rep. 1997;46(20):444-51.
11. Centers of Disease Control and Prevention (CDC). Annual smoking-attributable mortality, years of potential life lost, and economic costs, United States, 1995-1999. MMWR Morb Mortal Wkly Rep. 2002;51(14):300-3.
12. Centers of Disease Control and Prevention (CDC). Annual smoking attributable mortality, years of potential life lost, and productivity losses – United States, 1997-2001. MMWR Morb Mortal Wkly Rep.
2005;54(25):625-30.
13. Collishaw NE, Leahy K. Mortality attributable to tobacco use in Canada, 1989. Chronic Dis Can. 1991;12(4):46-8.
14. Criado Álvarez JJ, Morant Ginestar C, Lucas Veguillas A. Mortalidad atribuible al consumo de tabaco en los años 1987 y en Castilla-La Mancha, España. Rev Esp Salud Publica. 2002;76(1):27-36.
15. Danaei G, Vander Hoorn S, Lopez AD, Murray CJL, Ezzati M. Causes of cancer in the world: comparative risk assessment of nine behavioural and environmental risk factors. Lancet. 2005;366(9499):1784-93.
16. Dietz VJ, Novotny TE, Rigau-Pérez JG, Shultz JM. Smoking-attributable mortality, years of potential life lost, and direct health care costs for Puerto Rico, 1983.
Bull Pan Am Health Organ. 1991;25(1):77-86. 17. Emont SL, Dorrell KB, McClain R. The burden of smoking-attributable mortality among African Americans - Indiana, 1990. Addict Behav. 1995;20(5):563-9.
18. Ezzati M, Lopez AD. Estimates of global mortality attributable to smoking in 2000. Lancet.
2003;362(9387):847-52.
19. Ezzati M, Lopez AD. Regional, disease specifi c patterns of smoking-attributable mortality in 2000. Tob Control. 2004;13(4):388-95.
20. Ezzati M, Henley J, Thun MJ, Lopez AD. Role of smoking in global and regional cardiovascular mortality. Circulation. 2005;112(4):489-97. 21. Fakhfakh R, Hsairi M, Ben Romdhane H, Achour N.
Mortalite attribuable au tabac en Tunisie 1997. Tunis Med. 2001;79(8-9):408-12.
22. González Enríquez J, Villar Alvarez F, Banegas Banegas JR, Rodríguez Artalejo F, Martín Moreno JM. Tendencia de la mortalidad atribuible al tabaquismo en España, 1978-1992: 600.000 muertes en 15 años. Med Clin (Barc). 1997;109:577-82.
23. Gorini G, Chellini E, Querci A, Seniori Costantini A. Impatto dell’abitudine al fumo in Itália nel 1998: decessi e anni potenziali di vita persi. Epidemiol Prev. 2003;27(5):285-90.
24. Gorsky RD, Schwartz E, Dennis D. The morbidity, mortality, and economic costs of cigarette smoking in New Hampshire. J Community Health. 1990;15(3):175-83.
25. Hill C. Mortalité liée au tabagisme. Rev Prat..1993; 43(10):1209-13.
26. Horta BL, Calheiros P, Pinheiro RT, Tomasi E, Amaral KC. Tabagismo em adolescentes de área urbana na região sul do Brasil. Rev Saude Publica.
2001;35(2):159-64.
27. Illing EMM, Kaiserman MJ. Mortality attributable to tobacco use in Canada and its regions, 1991. Can J Public Health. 1995;86(4):257-65.
28. Illing EMM, Kaiserman MJ. Mortality attributable to tobacco use in Canada and its regions, 1994 and 1996. Chronic Dis Can. 1999;20(3):111-7. 29. Illing EMM, Kaiserman MJ. Mortality attributable to
tobacco use in Canada and its regions, 1998. Can J Public Health. 2004;95(1):38-44.
30. Jané M, Borrell C, Nebot M, Pasarín MI. Impacto del tabaquismo y del consumo excesivo de alcohol en la mortalidad de la población de la ciudad de Barcelona: 1983-1998. Gac Sanit. 2003;17(2):108-15.
31. Jha P, Ranson MK, Nguyen SN, Yach D. Estimates of global and regional smoking prevalence in 1995 by age and sex. Am J Public Health. 2002;92(6):1002-6. 32. Jha P, Chaloupka FJ, Moore J, Gajalakshmi V, Gupta
PC, Peck R, et al. Tobacco addiction. In: Jamison DT, Breman JG, Measham AR, Alleyne G, Claeson M, editors. Disease control priorities in developing
countries. New York: World Bank/Oxford University Press; 2006. p. 869-85.
33. John U, Hanke M. Tobacco and alcohol attributable mortality and years of potential life lost in Germany.
Eur J Public Health. 2003;13:275-7. 34. King DR, Smith AH, Salter DM. Mortality
attributable to smoking in New Zealand. N Z Med J. 1983;96(728):195-9.
35. Levy RA. Estimating the numbers of smoking-related deaths. JAMA. 2000;284(18):2319-20.
36. Liaw KM, Chen CJ. Mortality attributable to cigarette smoking in Taiwan: a 12-year follow-up study. Tob Control. 1998;7(2):141-48.
37. Li CY, Lin RS. Risk assessment of active smoking: smoking attributable mortality and years of potential life lost in Taiwan, 1980 and 1992. Asia Pac J Public Health. 1996/97;9:13-17.
38. Mathers CD, Loncar D. Projections of global mortality and burden of disease from 2002 to 2030. PLoS Medicine. 2006;3(11):e442.
39. Malarcher AM, Schulman J, Epstein LA, Thun MJ, Mowery P, Pierce B, et al. Methodological issues in estimating smoking-attributable mortality in the United States. Am J Epidemiol. 2000;152(6):573-84.
40. Northridge ME, Morabia A, Ganz ML, Bassett MT, Gemson D, Andrews H, et al. Contribution of smoking to excess mortality in Harlem. Am J Epidemiol.
1998;147(3):250-8.
41. Ouellet BL, Romeder JM, Lance JM. Premature mortality attributable to smoking and hazardous drinking in Canada. Am J Epidemiol. 1979;109(4):451-63. 42. Pelletier AR, Baron RC. Smoking-attributable mortality
in Kansas, 1990. Kans Med. 1993;94(11):290-93. 43. Peto R, Lopez AD, Boreham J, Thun M, Heath C
Jr. Mortality from tobacco in developed countries: indirect estimation from national vital statistics. Lancet. 1992;339(8804):1268-78.
44. Peto R, Lopez AL, Boreham J, Thun M, Heath Jr C, Doll R. Mortality from smoking worldwide. Br Med Bull. 1996;52(1):12-21.
45. Rockhill B, Newman B, Weinberg C. Use and misuse of population attributable fractions. Am J Public Health. 1998;88(1):15-9.
46. Rodríguez Tapioles R, Bueno Cavanillas A, Puevos Sánchez A, Espigares García M, Martínez González MA, Gálvez Vargas R. Morbilidad, mortalidad y años potenciales de vida perdidos atribuibles al tabaco.
Med Clin (Barc).1997;108(4):121-7.
47. Rowe AK, Powell KE, Flanders WD. Why population attributable fractions can sum to more than one. Am J Prev Med. 2004;26(3):243-9.
48. Santos Zarza EF, Valero Juan LF, Sáenz González MC. Mortalidad atribuible al consumo de tabaco en Castilla y León. Aten Primaria. 2001;27(3):153-8.
49. Shultz JM, Novotny TE, Rice DP. Quantifying the disease impact of cigarette smoking with SAMMEC II Software. Public Health Rep. 1991;106(3):326-33. 50. Single E, Robson L, Rehm J, Xie X. Morbidity and
mortality attributable to alcohol, tobacco, and illicit drug use in Canada. Am J Public Health. 1999;89(3):385-90.
51. Stapleton MP, Palmer CT. Cigarette smoking in Kentucky: smoking-attributable mortality and years of potential life lost. J Ky Med Assoc. 1998;96(11):451-5. 52. Sterling TD, Rosenbaum WL, Weinkam JJ. Risk
attribution and tobacco-related deaths. Am J Epidemiol. 1993;138(2):128-39.
53. Tanuseputro P, Schultz S, Manuel D. Estimating smoking-attributable mortality. Can J Public Health.
2004;95(2):132.
54. Tanuseputro P, Manuel DG, Schultz SE, Johansen H, Mustard CA. Improving population attributable fraction methods: examining smoking-attributable mortality for 87 geographic regions in Canada. Am J Epidemiol.
2005;161(8):787-98.
55. Terapia Conyer R, Olaiz G, Cravioto P. Mortalidad y años de vida potencial perdidos por consumo de tabaco en México. Gac Med Mex. 1994;130(6):425-31. 56. Thomas AR, Hedberg K, Fleming DW. Comparison
of physician based reporting of tobacco attributable deaths and computer derived estimates of smoking attributable deaths, Oregon, 1989 to 1996. Tob Control. 2001;10(2):161-4.
57. Thun MJ, Apicella LF, Henley SJ. Smoking vs other risk factors as the cause of smoking -attributable mortality: confounding in the courtroom. JAMA. 2000;284(6):706-12.
58. Thun MJ, Apicella LF, Henley SJ. Estimating the numbers of smoking-related deaths. JAMA.
2000;284(18):2319-20.
59. US Department of Health and Human Services. Reducing the health consequences of smoking: 25 years of progress: a report of the surgeon general. Rockville, MD: Public Health Service, Center for Chronic Disease Prevention and Health Promotion, Offi ce on Smoking and Health; 1989. (DHHS Publication, 89-8411).
60. US Department of Health and Human Services. The health consequences of smoking: a report of the surgeon general. Atlanta, GA: National Center for Chronic Disease Prevention and Health Promotion;2004.
61. Wardman AE, Khan NA. Smoking-attributable mortality among British Columbia’s fi rst nations populations. Int J Circumpolar Health. 2004;63(1):81-92.
62. Wen CP, Tsai SP, Yen DD. The health impact of cigarette smoking in Taiwan. Asia Pac J Public Health. 1994;7(4):206-13.
63. Wen CP, Tsai SP, Chen CJ, Cheng TY, Tsai MC, Levy DT. Smoking attributable mortality for Taiwan and its projection to 2020 under different smoking scenarios.
Tob Control. 2005;14(Suppl 1):i76-80.
64. World Health Organization. National Center Control Programs. Policies and managerial guidelines. Genebra; 1993.
65. World Health Organization. The World Health Report 2002: reducing risks, promoting healthy life. Genebra; 2002.