Years of Productive Life Lost to Premature
Mortality from Cardiovascular Diseases1
INES LESSA*
444
Cardiovascular diseases exact a major toll in both developed and developing coun- tries in terms of death, ill health, and premature incapacitation. This presentation concerns itself with the economic cost-expressed in terms of years of economically active life lost to premature mortality-imposed by cardiovascular diseases in rela- tively developed and undeveloped regions of Brazil.
T
he purpose of this article is to esti- mate the economically productive years lost in Brazil, using 1985 data, as a result of premature mortality caused by cardiovascular diseases.Two decades ago these diseases were the leading cause of death in Brazil (1, 2). Since then the morbidity and mortality picture has changed; and while the na- tion’s infrastructure for prevention and control of diseases typical of under- development is still weak, Brazil is start- ing to implement programs to prevent and control chronic and degenerative diseases.
Within this context it should be noted that Brazil’s leading health care provider, the National Institute of Medical Care and Social Security (Instituto National de AssisGncia Medica e Previdencia Social- INAMPS) has always tended to empha- size curative over preventive medicine (3). From 1978 to 1984, for example, the lion’s share of all federal expenditures for
*This article has been published in Portuguese in the Boletin de la Oficina Sanitaria Panamericana, 110(2):118-x25,1991.
2Associate Professor, Department of Preventive Medicine, Federal University of Bahia; Fellow, Bra- zilian National Research Council. Mailing address: Rua Padre Feij6, 29-4” Andar, Salvador-40.000, Brass.
health-84%-went to the medical and hospital care program, while public health programs responsible for provid- ing basic health services and communica- ble disease control received less than 5.5% (4).
As a result, many cardiovascular dis- ease deaths and retirements have oc- curred prematurely, cutting off the pro- ductivity of a sizable contingent of people at an economically active age. Consider- ing only one problem, high blood pres- sure, this has ranked as the fourth lead- ing cause of sick leave in the country and the leading cause of retirement due to ill- ness (5). Furthermore, quite aside from the individual and family hardships in- volved and the lost productivity just mentioned, cardiovascular diseases have levied a high social cost in terms of pre- maturely initiated benefits and expensive hospitalizations.
To help improve the prevailing cardio- vascular disease picture in Brazil, in 1988 a Health Ministry advisory committee completed a plan with well-defined aims and strategies for a National Arterial
Hy-
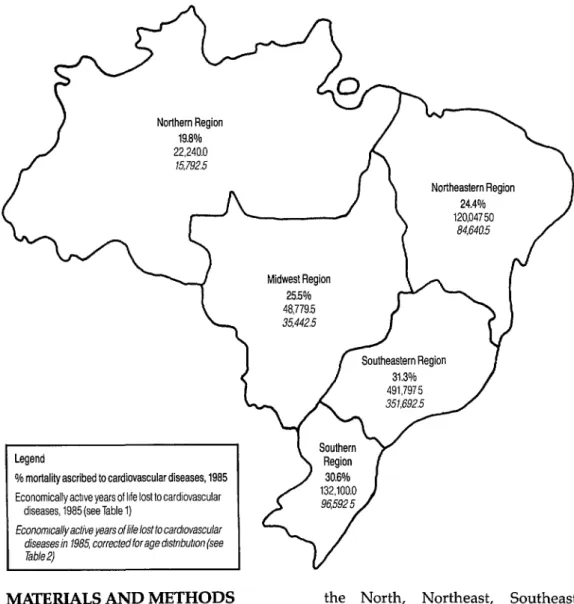
pertension Education and Control Pro- gram (6). This plan was subsequently presented to all of the state health secre- taries for adaptation and implementation by the states.Figure 1. A map of Brazil showing the country’s five regions, the percentage of 1985 mortality ascribed to cardiovascular diseases in each region (bold type), and the economically active years of life lost to cardiovascular diseases in 1985 (both uncorrected and corrected for age distribution) (7).
Northern Region 19.8% 22,240.O
15,792.5
% mortality ascribed to cardiovascular diseases, 1985
MfGERIALS
AND METHODS
Using the official 1985 government sta- tistics on mortality (7) and the economi- 2. tally active population (8), estimates
were made of the following: 3.
1. The number of economically active years lost to premature mortality (deaths among people 15 to 59 years old) caused by cardiovascular diseases in each of the country’s five regions- 4.
the North, Northeast, Southeast, South, and Midwest regions;
The average number of economically active years lost per person dying;
The numbers of economically active years lost to premature mortality from cardiovascular diseases as a percent- age of those lost to mortality from all causes except ill-defined causes; and
particular regions (as compared to other regions) and among women (as compared to men), estimated accord- ing to the formula used by Laurenti et al. (9).
The initial calculations (yielding the number of economically active years lost to cardiovascular disease) were made using the formula employed by Romeder and McWhinnie (20) to estimate potential years of life lost and reducing that for- mula’s upper limit from 70 years to 60. The resulting figures were then modified by multiplying the number of deaths from cardiovascular diseases in each of our specific age, sex, and regional groups by the respective proportions of the population actually engaged in economic activity according to the official data (see Tables 1 and 2 and Annexes 1 and 2).
The original formula’s upper limit of 70 years was reduced to 60 for two reasons. The official statistics stop breaking down the economically active population by age group after age 59, the oldest age cat- egory being “60 years and older”; and this hinders modification of the data to consider economic activity within the
60-70
year age group. Also, age 70 wouldappear to be a high nationwide limit for productivity-especially in view of marked social inequalities and different life expectancies in different regions. In this vein, it is noteworthy that the aver- age age of retirement eligibility for “time of service” is around 65, while 70 is the point of retirement for age.
Regarding economic activity, certain terms used in this presentation are de- fined as follows:
l The “economically active popula-
tion” is defined in the same official publication (8) that provides the data on economic activity used here.
l The “true economically active popu-
lation” of 1985 was that portion of
the population 15 to 59 years old that was actually in the work force that year.
l The population “rightfully active
economically” corresponded to the entire 1985 population 15 to 59 years old.
l The terms “economically active
years of life lost, ” “economically ac- tive years lost, ” “productive years lost, ” and “years lost from the work force” are all regarded as synonymous.
RESULTS
The raw 1985 data in Table 1 and Figure 1 show the economically active years lost to mortality from cardiovascular diseases among people 15 to 59, the totals being 481,052.O years for men and 333,912.5 for women. As may be seen, in all the re- gions women appear to have lost more years of productive life per person dying than men. Both men and women suf- fered slightly higher average losses of economically active life per person dying of cardiovascular diseases in the less de- veloped regions (the North, Northeast, and Midwest) than in the South and Southeast. However, cardiovascular dis- eases caused higher mortality in these two relatively developed regions; and so in these regions, as Table 1 shows, car- diovascular diseases accounted for a rela- tively high percentage of all years of eco- nomically active life lost to premature mortality.
Modification of the data to reflect eco- nomic activity by age group, as shown in Table 2 and Figure 1, raised the average number of years lost per person dying of cardiovascular disease. The increase was especially marked among women, rang- ing from 1.0 to 2.8 years per woman dying of cardiovascular disease in the various regions, as compared to an in- crease of 0.2 to 0.8 years per man.
E
Table 1. Economically active years of life lost to cardiovascular disease mortality among Brazilians 15-59 years old in 1985, by sex, age group, and region. The data shown assume that all people 15-59 were economically active.iif
E Age Region
i%.
3 group North Northeast Southeast South Midwest
% Male Female Male Female Male Female Male Female Male Female 9
(years)
8 20-29 15-19 1,925 680 935 3,952.s 3,825 9,987.5 8,330 3,400 2,635 1,742 2,625 11,585.O 11,900 38,710.O 31,605 10,465 9,030 4,550
4,165.O 977.5 & 30-39
3 3,425 2,425 17,225.O 14,350 81,550.O 55,125 18,550 13,950 7,700 6,050.O - 40-49 4,155 2,250 20,610.O 16,425 104,160.O 62,940 27,225 17,880 9,525 6,405.5 G 50-59 2,395 1,425 11,635.O 8,540 62,925.0 36,465 18,380 10,585 4,595 3,070.o 22 Total 12,580 9,660 65,007.5 55,040 297,332.5 194,465 78,020 54,080 28,112 20,667.5
Brazil (total) Male Female 19,762.0 16,702.5 67,235.0 59,325.0 128,450.O 91,900.o 165,675.O 105,900.0 99,930.o 60,085.O 481,052.O 333,912.5 Meana 13.0 15.4 13.5 14.5 12.3 13.1 11.8 12.9 13.8 14.5 12.5 13.4 %b 10.5 18.0 13.4 24.4 18.5 30.1 19.4 28.1 14.8 25.5 17.0 27.3 a Average number of economically active years lost per person dying.
b Percentage of economically active years lost to premature mortality that is attributed to cardiovascular disease mortality.
Table 2. The data shown in Table 1, corrected to reflect the age distribution of the work force (see Annex 2).
Age Region
group North Northeast Southeast South Midwest Brazil (total) (years) Male Female Male Female Male Female Male Female Male Female Male Female 15-19 382.5 255 2,805 1,317.5 7,310 3,782.5 2,762.5 1,360 1,275 382.5 14,535 7,097.5 20-29 1,750.o 1,190 10,815 5,390.o 36,645 16,450.O 10,080.O 4,725 4,375 1,715.o 63,665 29,470.o 30-39 3,375.0 1,250 16,775 7,125.O 79,275 27,125.O 1 a,1 50.0 7,375 7,550 3,900.o 125,125 46,775.0 40-49 3,975.0 1,095 19,628 7,485.O 96,660 26,505.O 25,755.0 8,190 9,045 2,430.O 155,063 45,705.o 50-59 2,080.O 440 10,225 3,075.o 47,950 9,990.o 14,850.O 3,345 3,990 780.0 79,095 17,630.O
Table 3. Overburden of years of economically active life lost to cardiovascular disease mortality (as a percentage of all mortality) in the South and Southeast regions compared to other regions, as indicated by both the uncorrected (Table 1) and corrected (Table 2) data.
Resions comoared
Overburden (%)a Overburden (%)a indicated indicated by uncorrected data by corrected data Men Women Men Women South/North
South/Northeast South/Midwest
+84.8
+44.8
f31.1
f56.1 f15.2 +10.2
+85.8 +50.0 +3a.i
+42.2 +5.5 -7.9 Southeast/North + 76.2 +67.2 +65.5 f52.4 Southeast/Northeast +38.0 f23.4 +33.6 +13.1 Southeast/Midwest f25.0 +ia.o f23.0 -0.7 South/Southeast + 4.9 -7.1 +12.3 -7.1 a Percentage shown = 100 (first region’s percentage - second region’s percent- age) /smallest percentage.
On the other hand, this correction did not notably increase the role of cardio- vascular diseases relative to other dis- eases, despite a slight apparent decline in their role among women in the South and Southeast. In Brazil as a whole, car- diovascular disease deaths in the 15-59 age group accounted for 17% of the pro- ductive years lost to men and 27% of those lost to women.
The large role played by cardiovascular diseases relative to other diseases in the South and Southeast-as compared to their role relative to other diseases in the North, Northeast, and Midwest re- gions-is shown in Table 3. Overall, it can be clearly seen that the relative role of cardiovascular mortality among both men and women was greatest in the South and Southeast, the interregional differences generally being less among women than among men, and that the differences between their role in the South versus the Southeast (see the South/Southeast data on the bottom line) were relatively slight. These findings emerged from both the uncorrected (Ta- ble 1) and corrected (Table 2) data,
though correction reduced interregional differences and gave cardiovascular dis- ease among women a greater apparent role in the Midwest Region (see negative figures) than in the South or Southeast.
Similar comparison of cardiovascular diseases’ role relative to other diseases in men versus women (Table 4) demon- strated that this role was considerably greater in women than in men. Correc- tion of the data reduced the apparent disparity in all areas except the Midwest Region.
DISCUSSION AND CONCLUSIONS
A closer approximation to reality could be achieved by replacing the upper limit on economically productive life (60 years) with the average retirement age (based on length of service) of men and women in each region-if only these data were readily available. However, such data could not be corrected to reflect the pro- portion of each age group in the work force.
Within the age range studied, the un- corrected (Table 1) data treat the entire
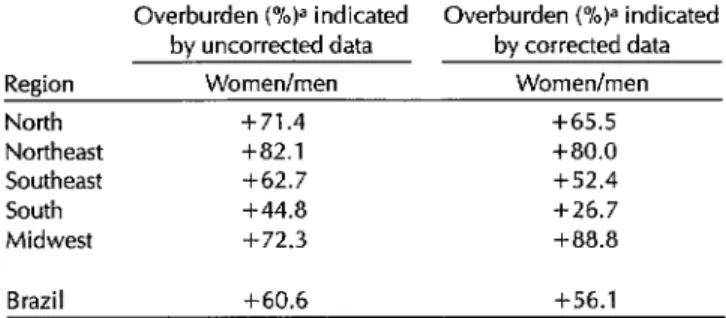
Table 4. Overburden of years of economically active life lost to cardiovascular disease mortality (as a percentage of all mortality) in females compared to males, as indicated by both the unmodified (Table I) and modified (Table 2) data.
Overburden (%)a indicated Overburden (%)a indicated by uncorrected data by corrected data Region Women/men Women/men
North +71.4 +65.5
Northeast +82.1 +ao.o
Southeast +62.7 +52.4
South +44.8 +26.7
Midwest +72.3 +aa.a
Brazil +60.6 +56.1
a Percentage shown = 100 (female percentage - male percentage) / smallest percentage.
population as “economically active,” even though in 1985 the work force in- cluded only 89.6% of the men and 44.5% of the women. The corrected data, though open to criticism, appear to more clearly approximate real losses from the work force. They also make it possible to evaluate part of the measurable social costs of premature mortality from cardio- vascular diseases-costs that accumulate from year to year in the form of pensions begun, on the average, 13.1 years (for men) and 15.5 years (for women) before the sixtieth birthdays of those afflicted. An approximate calculation of these costs shows that if a monthly pension equiva- lent to one minimum wage (US$70)3 were paid the family of each cardiovascular disease victim dying prematurely in 1985, the gross cost would be about US$53 mil- lion per year (according to the uncor- rected data) or US$36 million per year (according to the corrected data).
Mortality in 1985 from cardiovascular diseases (see Annex 1) was lower in the three less developed regions (2); but the average number of economically active
3Figure effective as of 31 July 1989. The dollar value of the minimum wage varies with current wage policy and the exchange rate.
years lost per person to premature mor- tality was higher there for both sexes than in the South and Southeast, because death from these diseases tended to come somewhat earlier in the North, Northeast, and Midwest regions. The fact that the average number of economi- cally active years lost increased when modified to reflect the age distribution of the work force (see Tables 1 and 2) sug- gests that the portion of the population in
the work force tended to experience more premature death from cardiovascular dis- orders than the portion of the population outside the work force.
One reason why death from cardio- vascular diseases tended to come earlier in the less developed regions than in the South and Southeast is the fact that so- cioeconomic conditions-including the quality, quantity, and range of medical care available to the population-tended to be poorer in the less developed re- gions. The previously noted increase in the average number of years lost when
the Table 1 data were corrected to reflect the age distribution of the work force could be partly accounted for by the pres- ence in the workplace of factors that cause and aggravate diseases of the circu- latory system.
eases contributed less to economically ac- tive years of life lost by those 15 to 59 in the North, Northeast, and Midwest re- gions than in the South and Southeast suggests the presence of other important causes of premature death (for example, various external causes) prevailing in the populations of those three regions, espe- cially among males.
McGreevey, in his critical analysis of Brazil’s high health costs, draws atten- tion to the country’s emphasis on cura- tive medicine (3). Excluding hospitaliza- tion costs tied to obstetric causes, chronic and degenerative diseases accounted for fully half the cost of admissions to the hospital network under contract with INAMPS in 1985 (2). Of this major share, 77% was paid to cover the 980,568 hospi- talizations that year for cardiovascular diseases.
The data gathered for this study indi- cate that 69.8% of the 1985 deaths from cardiovascular diseases among males and 66.3% of those among females were at- tributed to hypertensive disease, cere- brovascular disease, and acute myocar- dial infarction. However, the role of hypertension is larger, because arterial hypertension is strongly associated with morbidity and mortality from the other two causes (11-13). All of this clearly in- dicates an urgent need for state govern- ments to support implementation of the current National Arterial Hypertension Education and Control Program in order to reduce the toll of cardiovascular dis- ease-not only to save lives but also to improve productivity and promote eco- nomic growth.
REFERENCES
1. Escola NacionaI de Satide Pdblica, Fun- dacao Oswald0 Cruz. Mortabdade nas
2. 3. 4. 5. 6. 7. 8. 9. 10. 11. 12. 13.
capitais brasileiras, 1930-1980. Radis Dados (Rio de Janeiro). 1984;1(2):1-8. Ministerio da Satide, Centro de Docu- mentacao. Doencas cr&zico-degenerativas: evolu@o e tend&zcias atuais (~011). Brasilia: Cadernos; 1988.
McGreevey Wl? The high costs of health care in Brazil. Bull Pan Am Health Organ. 1988;22(2):145-166.
Medici AC. Financiamento das politicas de satide no Brasil. Bol Of Sanit Panam. 1987;103(6):571-98.
Costa EA. Magnitude da hipertensao ar- terial no Brasil. Cienc Cult. 1983;35 (11):1636-37.
Ministerio da Satide. Programa NacionaI de EducacHo e Controle da Hipertenlo Arterial. Brasilia, D.F.: Secretaria Nacio- nal de Programas Especiais de Satide, DivisZo National de Doencas Cronico- degenerativas; 1988.
Brasil, Minis&i0 da Saude, Centro de Documentacao. Esfatisticas de mortal- idade: Brasil, 1985. Brasilia: 1988.
Bras& Secretaria de Planejamento da PresidCncia da Repdblica, Fundacao In- stituto Brasileiro de Geografia e Es- tatistica. Ant&o estatistico do Brasil, 7985. Rio de Janeiro: 1986.
Laurenti R, Mello Jorge MI-Ip Lebrao ML, Gotlieb SLD. Estatisticas de satide. Sao PauIo: Ed Pedagogica e Univer- sitaria; 1985. Chapter 7.
Romeder JM, McWhinnie JR. Potential years of life lost between ages 1 and 70: an indicator of premature mortality for health planning. Int J Epidemiol. 1977; 6(2):143-151.
Laurenti R. Causas multiples de morte [Doctoral thesis]. Sao PauIo: Faculdade de Satide Publica, Universidade de SHo Paulo; 1973.
Lessa I. Epidemiologia dos acidentes vasculares encefahcos na cidade do Sal- vador: II, Principais fatores de risco. Bol
Of Sanif Panam. 1984;96(6):524-31.
Lessa, I. Epidemiologia do infarto agudo do miocardio na cidade do Salvador: II, Fatores de risco, complicacbes e causas de morte. Arq Bras Cardiol. 1985; 44(4):255-60.
i ANNEX
1. All deaths and deaths from cardiovascular diseases (latter italicized) among Brazilians 15-59 years old in 1985, by sex, age group, and region.
,o Age Region
G
z group North Northeast Southeast South Midwest Brazil (total)
5.
e+ (years) Male Female Male Female Male Female Male Female Male Female Male Female 9 15-19 453 24% 1,698 835 5,266 1,735 1,411 65% 630 286 9,458 3,762
8 16 22 93 90 235 196 80 62 41 23 465 393
E 20-29 1,290 537 5,061 1,880 15,295 4,875 3,907 1,410 2,002 699 27,555 9,401
5 55 75 903 299 258 130 119
.- 331 340 1,106 1,921 1,695
2 30-39 1,231 522 4,989 2,257 16,220 6,867 4,013 1,896 1,893 805 28,346 12,347 E 137 97 689 574 3,262 2,205 742 558 308 242 5,138 3,676 40-49 1,168 516 5,253 3,155 20,015 9,988 5,684 2,971 2,203 1,122 34,323 17,752
277 150 1,374 1,095 6,944 4,196 1,815 1,192 635 427 11,045 7,060 50-59 1,347 696 6,181 4,027 28,281 15,819 8,691 4,630 2,454 1,460 46,954 26,632 479 282 2,327 1,708 12,585 7,293 3,676 2,117 919 614 19,986 12,014 Total 5,489 2,519 23,182 12,154 85,077 39,284 23,706 11,565 9,182 4,372 146,636 69,894
964 626 4,814 3,807 24,132 14,793 6,612 4,187 2,033 1,425 38,555 24,838 Meana 46.5 44.1 46.0 45.0
%b 17.6 24.8 20.8 31.3 Source of raw data: Ministkrio da Sadde (7).
a Average age at death from cardiovascular disease.
b Percentage of overall mortality ascribed to cardiovascular disease.
47.2 46.4 47.7 46.6 45.7 45.0 47.0 46.1 28.4 37.6 27.9 36.2 22.1 32.6 26.3 35.5
ANNEX 2. Percentages of the Brazilian population 15-59 years old in the work force in 1985, by sex, age group, and region.
Region
group North Northeast Southeast South Midwest Brazil (total)