ABSTRACT:Objective: To analyze mortality and years of life lost due to death or disability (disability-adjusted life years – DALYs) for interpersonal violence and self-harm, comparing 1990 and 2015, in Brazil and Federated Units, using estimates produced by the Global Burden of Disease 2015 (GBD 2015). Methods: Secondary data analysis of estimates from the GBD 2015, producing standardized death rates and years of life lost due to death or disability. The main source of death data was the Mortality Information System, submitted to correction of underreporting of deaths and redistribution of garbage codes. Results: From 1990 to 2015, homicide mortality rates were stable, with a percentage variation of -0.9%, from 28.3/100 thousand inhabitants (95% UI 26.9-32.1) in 1990 to 27.8/100,000 (95% UI 24.3-29.8) in 2015. Homicide rates were higher in Alagoas and Pernambuco, and there was a reduction in São Paulo (-40.9%). Suicide rates decreased by 19%, from 8.1/100,000 (95% UI 7.5-8.6) in 1990 to 6.6/100,000 (95% UI 6.1-7,9) in 2015. Higher rates were found in Rio Grande do Sul. In the ranking of external causes for years of life lost due to death or disability (DALYs), irearm aggression predominated, followed by transportation accidents; self-inlicted injuries were in sixth place. Conclusions:
The study shows the importance of external causes among young people and men as a cause of premature death and disabilities, which is a priority problem in the country. The Global Burden of Disease study may support public policies for violence prevention.
Keywords:Homicide. Suicide. External causes. Violence. Mortality. Disability-adjusted life years. Agression. Violence against women.
Mortality and years of life lost by interpersonal
violence and self-harm: in Brazil and Brazilian
states: analysis of the estimates of the Global
Burden of Disease Study, 1990 and 2015
Mortalidade e anos de vida perdidos por violências
interpessoais e autoprovocadas no Brasil e Estados: análise
das estimativas do Estudo Carga Global de Doença, 1990 e 2015
Deborah Carvalho MaltaI, Maria Cecília de Souza MinayoII, Adauto Martins Soares FilhoIII, Marta Maria Alves da SilvaIV, Marli de Mesquita Silva MontenegroIII, Roberto Marini LadeiraV, Otaliba Libanio de Morais NetoIV, Ana Paula MeloVI, Meghan MooneyVII, Mohsen NaghaviVII
IDepartment of Maternal-Child Nursing and Public Health, School of Nursing, Universidade Federal de Minas Gerais – Belo
Horizonte ( MG), Brazil.
IICentro Latino-Americano de Estudos de Violência e Saúde Jorge Careli, Fundação Oswaldo Cruz – Rio de Janeiro (RJ), Brazil. IIIDepartment of Surveillance of Noncommunicable Diseases and Health Promotion, Secretariat of Health Surveillance, Ministry
of Health – Brasília (DF), Brazil.
IVDepartment of Public Health, Institute of Tropical Pathology and Public Health, Universidade Federal de Goiás – Goiânia (GO), Brazil. VFundação Hospitalar do Estado de Minas Gerais – Belo Horizonte (MG), Brazil.
VIUniversidade Federal de Sao João Del Rei – Sao João Del Rei (MG), Brazil. VIIInstitute for Health Metrics and Evaluation – Seattle, United States.
Corresponding author: Deborah Carvalho Malta. Universidade Federal de Minas Gerais. Escola de Enfermagem. Departamento de Enfermagem Materno-Infantil e Saúde Pública. Avenida Prof. Alfredo Balena, 190, CEP: 30130-100, Belo Horizonte, MG, Brasil. E-mail: [email protected]
Conlict of interests: nothing to declare – Financial support: Bill & Melinda Gates Foundation (GBD Global) and Ministry of Health (GBD 2015 Brazil-states), through the National Health Fund (Process No. 25000192049/2014-14).
IntroductIon
Global Burden of Disease (GBD) study estimated 973 million people injured and 4.8 mil-lion deaths from accidents and violence around the world in 2013. The main causes of death were road traic accidents (29.1%), suicides (17.6%), falls (11.6%), and homicide (8.5%). Among the people injured, 5.8% (56.2 million) had to be hospitalized and 38.5% (21.7 mil-lion) sustained fractures1.
GBD data indicate reduction in homicide rates worldwide, with regional diferences. In Asia and Europe, the rates decreased, but in the Americas, East Africa, and other regions they remained high. Noteworthy is the increase of years of life lost due to death or disabil-ity (disabildisabil-ity-adjusted life years – DALYs) in Latin America and sub-Saharan Africa, owing to homicides2. Suicide is the second leading cause of death from violence globally, the third
in Brazil, and a major contributor to DALYs1,3.
In Brazil, external causes correspond to the third leading cause of death. However, in the age groups 1–49 years, they are the main cause and mostly afect young men4.Between
2000 and 2010, more than 1.4 million people died from these causes; 38% (545,500 people) from homicides, and 6.5% (92,300 people) from suicide4. There are signiicant regional
dif-ferences in homicide mortality rates, and the highest rates are observed in the states of the north and northeast regions of the country4.
Violence put great pressure on health, legal, and social services systems and, increas-ingly, is identiied as a factor that erodes the economy of the countries5, being a challenge
RESUMO:Objetivo: Analisar a mortalidade e os anos de vida perdidos por morte ou incapacidade ( Disability-Adjusted Life Years – DALYs) por violências interpessoais e autoprovocadas, comparando 1990 e 2015, no Brasil e nas Unidades Federadas, utilizando estimativas produzidas pelo estudo Carga Global de Doença 2015 (GBD 2015).
Métodos: Análise de dados secundários das estimativas do GBD 2015, com produção de taxas padronizadas de mortes e DALYs. A principal fonte de dados de óbitos foi o Sistema de Informações sobre Mortalidade, submetido à correção do sub-registro de óbitos e redistribuição de códigos garbage. Resultados: De 1990 a 2015, observou-se estabilidade das taxas de mortalidade por homicídios, com variação percentual de -0,9%, passando de 28,3/100 mil habitantes (II 95% 26,9-32,1), em 1990, para 27,8/100 mil (II 95% 24,3-29,8), em 2015. As taxas de homicídio foram mais altas em Alagoas e Pernambuco, e ocorreu redução em São Paulo (-40,9%). As taxas de suicídio variaram em -19%, saindo de 8,1/100 mil (II 95% 7,5-8,6), em 1990, para 6,6/100 mil (II 95% 6,1-7,9), em 2015. Taxas mais elevadas ocorreram no Rio Grande do Sul. No ranking de causas externas por Disability-Adjusted Life Years (DALYs), predominaram as agressões por arma de fogo, seguidas de acidentes de transporte e em sexto lugar lesões autoprovocadas. Conclusões: O estudo aponta a importância das causas externas entre jovens e homens na morte prematura e em incapacidades, constituindo um problema prioritário no país. O estudo Carga Global de Doença poderá apoiar políticas públicas de prevenção de violência.
for the physical and emotional efects it causes in people6. Homicides and suicides involve
young people at full production capacity and result in high individual and collective costs4-6.
The GBD has innovated by calculating in a comparable way, in all countries of the world, the impact of these events on mortality, in the occurrence of disabilities, in the incidence and prevalence of disease and injury7-11. The GBD 2015 has updated estimates and time
series from 1990, owing to the inclusion of new data and review of methods. Data were included for Brazil and, for the irst time, for the 27 federated units (FUs), enabling com-parison between Brazil, FUs, and other countries12.
This study aimed at analyzing the mortality and years of life lost due to death or disabil-ity (DALYs) from interpersonal violence and self-harm, comparing 1990 and 2015, in Brazil and FUs, using estimates produced by the 2015 GBD study.
MEtHodS
This is a study based on secondary data used in the estimates of 2015 GBD, which applied the methodology proposed by the Institute for Health Metrics and Evaluation (IHME) at the University of Washington, United States of America13.
The GBD discloses on its website the data sources used in each country, which, in general, consists of vital registration, verbal autopsy, censuses, surveys, hospital data, police and foren-sic services records13. For violent causes, reports of homicide incidents, road traic accidents,
and suicides recorded by the police are also used. Studies published by national agencies and research institutions, such as the United Nations Surveys on Crime Trends14 and the Global
Status Report on Road Safety15 were also considered. In countries such as Brazil, which have
vital registrations, police data are not used, unless the number of injuries reported in these records exceeds the vital registration. The GBD discloses the sources of information used in each country, state, or other sub-national geographical unit, adopted every year11,16.
The main data source on mortality in Brazil was the death registration database of the Mortality Information System (in Portuguese, Sistema de Informações sobre Mortalidade – SIM) of the Ministry of Health, which was subject to adjustments by other national and international sources.
In the calculation of GBD estimates of external causes, a mapping of data sources on disease and injury was carried out irst. Second, garbage codes were adjusted, redistributing them to deined causes. Details of the grouping by causes, using the ICD-9 and ICD-10, have been described previously16.The GBD 2015 used the International Statistical Classiication of
- MR 2.1, a meta-regression calculation tool for simultaneous estimates of incidence, prev-alence, remission, disability, and mortality is used12,17.
In this study, the following metrics were used: mortality rates and years of life lost due to death or disability, the DALYs. This is a compound indicator that includes the prema-ture death (years of life lost– YLL) and the damage caused by disease, sequelae, or disabil-ity, considering diferent levels of severity of one or more diseases simultaneously years lived with disability – YLD). In this indicator, the weight of lethal and non-lethal diseases is equivalent18.The rates were standardized by age, and suicide indicators were calculated
for individuals aged over 9 years.
The Global Burden of Disease Study (GBD Brazil 2015) was approved by the Ethics Committee of the Universidade Federal de Minas Gerais (CAAE Project –62803316.7.0000.5149).
rESuLtS
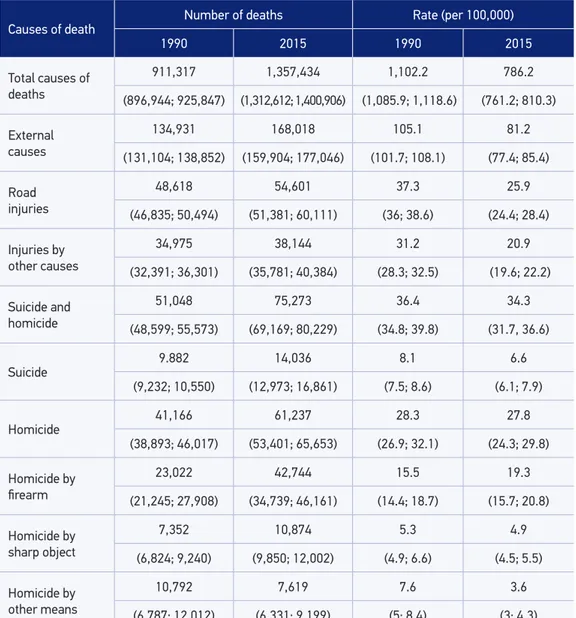
In Brazil, deaths by external causes accounted for 134,931 deaths in 1990 and 168,018 in 2015, and the rates were reduced by 22.8% during the period, from 105.1 (95% UI 105.1-81.2) to 81.2/100,000 (95% UI 77.4-85.4), within the limit of signiicance. The main groups of causes were homicide, followed by road accidents, other accidental causes, and suicides (Table 1).
Between 1990 and 2015, homicide mortality rates were stable, with percentage change of -0.9%, varying from 28.3/100,000 inhabitants (95% UI 26.9-32.1) in 1990 to 27.8/100,000 (95% UI 24.3-29.8) in 2015. However, irearm homicides increased from 15.5 (95% UI 14.4-18.7) to 19.3/100,000 (95% UI 15.7-20.8) (27.5%), without signiicant diference. The rate of homicides by sharp object increased from 5.3 (95% UI 4.9-6.6) to 4.9/100,000 (95% UI 4.5-5.5), and homicides by other means varied from 7.6 (95% UI 5-8.4) to 3.6/100,000 (95% UI 3-4.3).
The DALYs rates from accidents and violence in 1990 and 2015, among men, show that assault by irearms (irst position) and pedestrian road injuries (second position) remained with the same classiication; road injuries involving motorcyclists moved from ninth posi-ton to third position; and road injuries involving motor vehicle occupants moved from third position to fourth position. Falls remained at the ifth position. Self-harm rose from seventh to sixth position, followed by assault by sharp object (seventh position). Drowning moved from sixth to the eighth position and assaults by other means migrated from fourth to ninth
Table 1. Frequency and standardized mortality rate (per 100,000) by accidents and violence with UI (95%), Brazil, in 1990 and 2015.
Causes of death Number of deaths Rate (per 100,000)
1990 2015 1990 2015
Total causes of deaths
911,317 1,357,434 1,102.2 786.2
(896,944; 925,847) (1,312,612; 1,400,906) (1,085.9; 1,118.6) (761.2; 810.3)
External causes
134,931 168,018 105.1 81.2
(131,104; 138,852) (159,904; 177,046) (101.7; 108.1) (77.4; 85.4)
Road injuries
48,618 54,601 37.3 25.9
(46,835; 50,494) (51,381; 60,111) (36; 38.6) (24.4; 28.4)
Injuries by other causes
34,975 38,144 31.2 20.9
(32,391; 36,301) (35,781; 40,384) (28.3; 32.5) (19.6; 22.2)
Suicide and homicide
51,048 75,273 36.4 34.3
(48,599; 55,573) (69,169; 80,229) (34.8; 39.8) (31.7, 36.6)
Suicide
9.882 14,036 8.1 6.6
(9,232; 10,550) (12,973; 16,861) (7.5; 8.6) (6.1; 7.9)
Homicide
41,166 61,237 28.3 27.8
(38,893; 46,017) (53,401; 65,653) (26.9; 32.1) (24.3; 29.8)
Homicide by irearm
23,022 42,744 15.5 19.3
(21,245; 27,908) (34,739; 46,161) (14.4; 18.7) (15.7; 20.8)
Homicide by sharp object
7,352 10,874 5.3 4.9
(6,824; 9,240) (9,850; 12,002) (4.9; 6.6) (4.5; 5.5)
Homicide by other means
10,792 7,619 7.6 3.6
(6,787; 12,012) (6,331; 9,199) (5; 8.4) (3; 4,3)
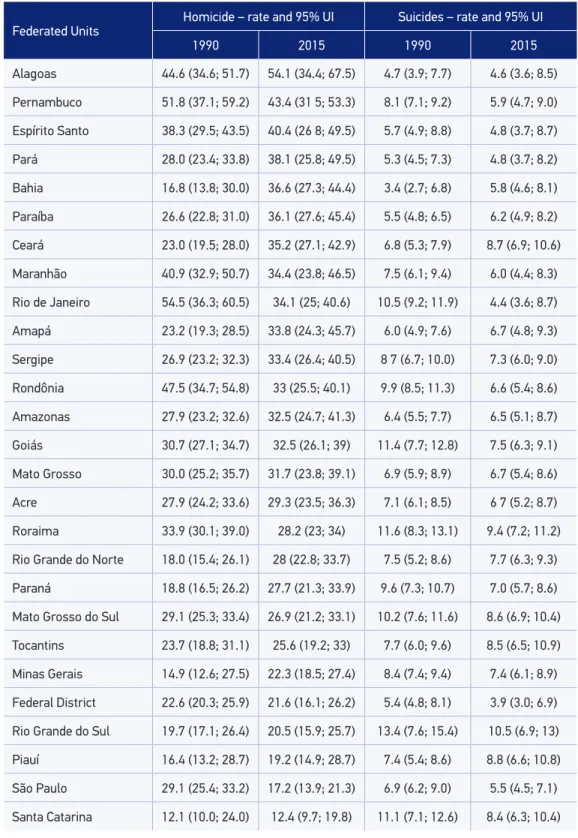
Table 2. Standardized mortality rate (per 100,000), uncertainty interval (UI) 95% by homicide and suicide, according to Federated Units. Brazil, variation (Var %) in 1990 and 2015.
Federated Units
Homicide – rate and 95% UI Suicides – rate and 95% UI
1990 2015 1990 2015
Alagoas 44.6 (34.6; 51.7) 54.1 (34.4; 67.5) 4.7 (3.9; 7.7) 4.6 (3.6; 8.5)
Pernambuco 51.8 (37.1; 59.2) 43.4 (31 5; 53.3) 8.1 (7.1; 9.2) 5.9 (4.7; 9.0)
Espírito Santo 38.3 (29.5; 43.5) 40.4 (26 8; 49.5) 5.7 (4.9; 8.8) 4.8 (3.7; 8.7)
Pará 28.0 (23.4; 33.8) 38.1 (25.8; 49.5) 5.3 (4.5; 7.3) 4.8 (3.7; 8.2)
Bahia 16.8 (13.8; 30.0) 36.6 (27.3; 44.4) 3.4 (2.7; 6.8) 5.8 (4.6; 8.1)
Paraíba 26.6 (22.8; 31.0) 36.1 (27.6; 45.4) 5.5 (4.8; 6.5) 6.2 (4.9; 8.2)
Ceará 23.0 (19.5; 28.0) 35.2 (27.1; 42.9) 6.8 (5.3; 7.9) 8.7 (6.9; 10.6)
Maranhão 40.9 (32.9; 50.7) 34.4 (23.8; 46.5) 7.5 (6.1; 9.4) 6.0 (4.4; 8.3)
Rio de Janeiro 54.5 (36.3; 60.5) 34.1 (25; 40.6) 10.5 (9.2; 11.9) 4.4 (3.6; 8.7)
Amapá 23.2 (19.3; 28.5) 33.8 (24.3; 45.7) 6.0 (4.9; 7.6) 6.7 (4.8; 9.3)
Sergipe 26.9 (23.2; 32.3) 33.4 (26.4; 40.5) 8 7 (6.7; 10.0) 7.3 (6.0; 9.0)
Rondônia 47.5 (34.7; 54.8) 33 (25.5; 40.1) 9.9 (8.5; 11.3) 6.6 (5.4; 8.6)
Amazonas 27.9 (23.2; 32.6) 32.5 (24.7; 41.3) 6.4 (5.5; 7.7) 6.5 (5.1; 8.7)
Goiás 30.7 (27.1; 34.7) 32.5 (26.1; 39) 11.4 (7.7; 12.8) 7.5 (6.3; 9.1)
Mato Grosso 30.0 (25.2; 35.7) 31.7 (23.8; 39.1) 6.9 (5.9; 8.9) 6.7 (5.4; 8.6)
Acre 27.9 (24.2; 33.6) 29.3 (23.5; 36.3) 7.1 (6.1; 8.5) 6 7 (5.2; 8.7)
Roraima 33.9 (30.1; 39.0) 28.2 (23; 34) 11.6 (8.3; 13.1) 9.4 (7.2; 11.2)
Rio Grande do Norte 18.0 (15.4; 26.1) 28 (22.8; 33.7) 7.5 (5.2; 8.6) 7.7 (6.3; 9.3)
Paraná 18.8 (16.5; 26.2) 27.7 (21.3; 33.9) 9.6 (7.3; 10.7) 7.0 (5.7; 8.6)
Mato Grosso do Sul 29.1 (25.3; 33.4) 26.9 (21.2; 33.1) 10.2 (7.6; 11.6) 8.6 (6.9; 10.4)
Tocantins 23.7 (18.8; 31.1) 25.6 (19.2; 33) 7.7 (6.0; 9.6) 8.5 (6.5; 10.9)
Minas Gerais 14.9 (12.6; 27.5) 22.3 (18.5; 27.4) 8.4 (7.4; 9.4) 7.4 (6.1; 8.9)
Federal District 22.6 (20.3; 25.9) 21.6 (16.1; 26.2) 5.4 (4.8; 8.1) 3.9 (3.0; 6.9)
Rio Grande do Sul 19.7 (17.1; 26.4) 20.5 (15.9; 25.7) 13.4 (7.6; 15.4) 10.5 (6.9; 13)
Piauí 16.4 (13.2; 28.7) 19.2 (14.9; 28.7) 7.4 (5.4; 8.6) 8.8 (6.6; 10.8)
São Paulo 29.1 (25.4; 33.2) 17.2 (13.9; 21.3) 6.9 (6.2; 9.0) 5.5 (4.5; 7.1)
Table 3. Ranking of DALYs rate/100,000, external causes, men 1990–2015.
1990 Classiication 2015
Rate; UI* 1990 2015 Causes Rate; UI*
1,506.6 (1,383.4; 1,844.9) 1 1 Assaults with irearm 1,958.3 (1,545.5; 2,123.9)
1,338.1 (1,236.2; 1,521.1) 2 2 Road injuries – pedestrian 686.1 (604.5; 794.5)
938.9 (754.7; 1045.8) 9 3 Road injuries – motorcyclist 588.6 (392.9; 738.6)
689.7 (415.4; 772.7) 3 4 Road injuries – motor vehicle 533.2 (462.4; 702.7)
620.1 (535.9; 714.2) 5 5 Falls 515 (431.9; 613.2)
619 (586; 653.3) 7 6 Self-harm 458.7 (418.8; 571.8)
544.1 (503; 576.6) 8 7 Assaults by sharp objects 431.9 (377.9; 485.3)
462.7 (426; 599.4) 6 8 Drowning 300.4 (278.7; 333.6)
379.4 (320.6; 474.4) 4 9 Assaults by other means 291.7 (232.9; 354.5)
260.4 (228.3; 298.8) 10 10 Other accidents 187.9 (160.6; 220.8)
163.8 (108.6; 185.5) 11 11 Respiratory accident risk 91.9 (60.2; 112.9)
154.6 (117.8; 170.6) 20 12 Other road injuries 87.3 (70.7; 99.9)
142, 8 (124.9; 175.7) 13 13 Other mechanical forces 83.8 (69.2; 102.1)
134.1 (100.8; 171.7) 17 14 Road injuries – cyclist 83.7 (74.8; 99.3)
110.8 (81.6; 144.6) 14 15 Extreme temperature 68.8 (49.9; 92.9)
89 (50.9; 99.5) 15 16 Medical complications 63.7 (50.5; 83.8)
67 (61; 78.5) 12 17 Fire and heat 58.8 (51.8; 70.3)
36.4 (27; 41.4) 16 18 Injuries by irearms 36.9 (25.4; 47.2)
34.6 (22.3; 39.8) 24 19 Other transport injuries 32.1 (16.1; 42.1)
33.1 (29.3; 38.7) 18 20 Unintentional sufocation 14 (11.6; 20.2)
29.4 (25.1; 32) 19 21 Poisoning 13.9 (11.5; 20.1)
23,6 (14, 8; 25.7) 21 22 Venomous animals 12 (10.6; 17.0)
14.4 (3.4; 31.7) 22 23 Foreign body 8.9 (7.9; 10.9)
11 (8.5; 23.4) 25 24 Non-venomous animals 7.3 (6.3; 11.5)
9.9 (8.9; 12) 23 25 Natural disasters 1.1 (0.6; 2.4)
position. Road injuries involving motorcyclists rose from 17th to 14th position, and unin-tentional irearms injuries moved from 16th to 18th position (Table 3).
Among women, data not shown, falls rose from second to irst position of DALYs rates due to external causes, between 1990 and 2015, followed by pedestrians road injuries (sec-ond position) and motor vehicle occupants road injuries (third position). Homicides by irearms rose from sixth (1990) to fourth position (2015). Suicide remained at ifth position.
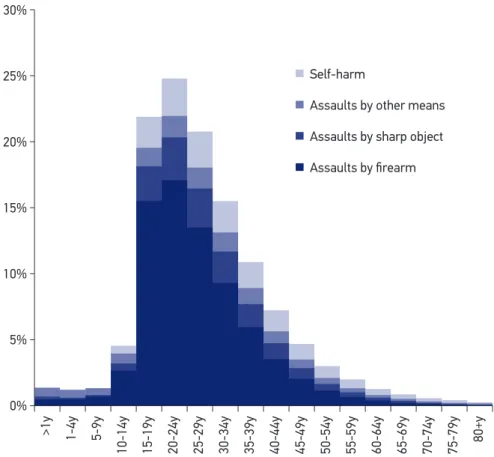
DALYs rates by interpersonal violence and self-harm, in 2015, were higher among men than among women in all FUs, with predominance of assaults by irearms in most states except for Amapá and Roraima, where injuries by sharp objects were predominant. Self-harm was the leading cause of death among women in Roraima, Rio Grande do Sul, Piauí, Mato Grosso do Sul, Santa Catarina, Minas Gerais, São Paulo, and Rio Grande do Norte. The highest rates of DALYs by violence were registered in Alagoas, Pernambuco, and Espírito Santo, and the lowest rates were registered in Santa Catarina, São Paulo, and Piauí. Among women, the highest rates were in Roraima, Espírito Santo, and Pernambuco (Figure 1).
The proportional distribution of DALYs by age, according to interpersonal violence and self-harm, in 2015, indicates higher frequency of cases in the younger age groups, by order of importance, in age groups 20–24 years, 15–19 years, 25–29 years, and 30–34 years. Except
>1y 1-4y 5-9y
10-14y 15-19y 20-24y 25-29y 30-34y 35-39y 40-44y 45-49y 50-54y 55-59y 60-64y 65-69y 70-74y 75-79y 80+y 30%
25%
20%
15%
10%
5%
0%
Self-harm
Assaults by other means
Assaults by sharp object
Assaults by firearm
for age group 0–4 years, in which assaults by other means are prevalent. In other age groups, assaults by the irearm and sharp objects are predominant (Figure 2).
dIScuSSIon
The study shows the magnitude of external causes in the country, which was the third cause of death in 2015. Between 1990 and 2015, these causes were reduced by a quarter. Among the external causes, homicides predominate, followed by road injuries, other acci-dental causes, and suicides. Homicides remained stable during the period; however, with large variations between states. São Paulo was the only state with a statistically signiicant reduction during the period. In several other states, although the rates are within the uncer-tainty interval, they had an increase, such as in Bahia, Rio Grande do Norte, Ceará, and Minas
Figure 2. DALYs rate by violence, sex, Brazil and Federated Units, 2015. Santa Catarina
São Paulo Piauí Distrito Federal Minas Gerais Rio Grande do Sul Tocantins Roraima Mato Grosso do Sul Brasil Paraná Acre Mato Grosso Rondônia Rio Grande do Norte Amapá Goiás Amazonas Rio de Janeiro Sergipe Maranhão Pará Bahia Paraíba Ceará Espírito Santo Pernambuco Alagoas
Self-harm Self-harm
Assaults by firearm Assaults bysharp object
Assaults by other means
8,000 6,000 4,000 2,000 0 0 2,000 4,000 6,000 8,000
Gerais. Suicide rates decreased by approximately a quarter, within the uncertainty range. In the ranking of external causes for years of life lost due to death or disability (DALYs), assaults by irearms are predominant, followed by road injuries. Suicides were in the sixth position. The proportional distribution of DALYs by interpersonal violence and self-harm, in 2015, indicate higher frequency among men and in young age groups, especially between 20 and 24 years of age, followed by young people aged 15–19 years. The highest rates of DALYs by violence in men occurred in Alagoas, Pernambuco, and Espírito Santo.
Brazil is simultaneously part of the groups of countries with higher risk of death by homicide and with lower suicide rates, according the World Health Organization reports19,20.
Despite worldwide phenomenon, homicides have a heterogeneous distribution by geograph-ical areas and social groups. Rates show overall reduction, with large variations depending on the economic status of the countries20.In high-income countries, the decrease in homicide
rate was 39%; in middle-income countries, the decline was 13%; and in low-income coun-tries, the decrease in the rate was equal to 10%. In a report from the United Nations (UN) in 2012, it was estimated that in Latin America and the Caribbean the majority of deaths from external causes occurred by homicides, and three quarters of them were caused by irearms. In South America, Brazil has the third highest homicide mortality, after Venezuela and Colombia14. The risk of homicide is ten times higher than that of high-income countries
such as France and the United States of America (rates below 3/100,000), and Latin American countries with low and middle income, such as Argentina and Mexico (3 to 7 per 100,000)12,21.
The pattern of occurrence of homicide and suicide shows diferent aspects in the country, with signiicant diferences by gender, age, and FUs. Violence, in general, is more common among young men, predominantly homicides by irearms in the northeast and north regions. Although within the signiicance limits, states such as Minas Gerais and Paraná registered rates which difered from that observed in their regions, considering the declining rates in Sao Paulo and stable rates in the other states of the south and southeast regions. A previous study identi-ied increased risk of homicide in cities of Paraná State, which are located close to the border between other countries, possibly owing to greater availability of irearms and illegal drugs22.
Homicide victims are usually young adult men (aged 20–34 years) and adolescents (aged 15–19 years) and residing mainly in the northeast and north regions, murdered with ire-arms. This pattern of mortality are in accordance with other studies on violence, which evidence the main victims as being men, young, black, and poor21,23,24. In Brazil, men are
9.2 times more likely to die from homicide than women, which can be partially explained by cultural issues that encourage male violence. The proile of murdered women is also of young victims and, similar to men, death is caused by irearms. In an urban northeast center, the main proile of women murdered is young, black, and single, with low education and income, and they are victims of physical and/or sexual violence25. According a UN report,
Brazil ranks ifth globally in femicide, or cruel murders resulting from the discriminatory culture of sexual violence and sexism26.The violence sufered by adolescents is also
associ-ated to school delays and criminal records27, traicking and drug use, alcohol abuse,
Also among the elderly people, studies reporting abuse perpetrated by their sons, daugh-ters, and other family members are frequent30.
Studies on violence, particularly homicides, show that violent behaviors are exacerbated in conditions of structural inequality, in degraded urban areas and outskirts of cities, and are more common among people with low education and income, who use alcohol and drugs, who are involved in traicking and illegal possession of weapons, and who experience frag-ile family ties. There is also the victimization by domestic violence, unemployment, precar-ious education and public safety, as well as police violence. Conlicts in areas of agricultural borders and land disputes are also mentioned21,31-35.
The results presented herein are in accordance with other studies that identiied high rates of homicides in the north and northeast regions; and smaller or decreasing rates in southeast region36,owing to the decline in rates in Sao Paulo and Rio de Janeiro37. Factors
that would synergistically inluence rates decrease are the following: reduction in the per-centage of young people; reduction of unemployment; investments in social policies such as poverty reduction programs; civilian disarmament with an increase of seized weapons; and imprisonment38-42.However, security actions become less important as an explanatory
factor, after controlling for unemployment and proportion of young people, emphasizing the strength of socioeconomic and demographic factors43. It is worth noting that
disarma-ment measures may have positively relected in reducing homicides42; however, the impact
would have been greater among white population than among black population in Brazil23.
The presence of armed conlict zones, rivalry, and dispute in traicking accentuate the risk of deaths from assault, promoting the “ecology of danger” (prevalence of male vio-lence, availability of weapons, coercion, and domination over territories). High homicide rates have been explained by the high concentration of weapons and poor young men44.
Impunity is also an important factor for the risk of homicide in Brazil45 and Mexico46.
Suicide is among the top ten causes of death worldwide, with more than 800,000 deaths each year. It is estimated 20 attempts for each adult who commits suicide and approximately a third of them have a history of repeated attempts20,47. Data from the GBD 2015 indicate the largest global
suicide rates in Asia (13.3/100,000) and Europe (17.6/100,000). The Americas have suicide rate of 9.8/100,000, compared with countries such as Russia (36.8/100,000), India (15.8/100,000), and South Africa (14.8/100,000). Brazil is included in the group with lower suicide rates12.
Sex, age, culture, and ethnicity have signiicant implications in the epidemiology of suicide in the world. Consummated suicides among men are more frequent than among women. In this study, the DALYs rates for suicides were higher among men, if compared with women, and among young people aged 15–34 years. The rates of death by suicide are higher among people aged over 70 years20, show highest increase among younger people,
and indicate more signiicant risk among indigenous populations48,49. Depression is the most
relevant factor associated with suicide among elderly people50. Survey on violence in Brazil
highlights more suicide attempts among women51.
residents, retirees, migrants, and singles)52. Other conditions are also related to social aspects
as follows: personal loss, violence, social isolation, interpersonal conlicts, legal, or labor issues52,53, and speciically in childhood and adolescence, physical and sexual abuse, and
dif-iculties with sexual orientation54,55.
States of southern Brazil are included in the group with higher incidence of suicide; and Rio Grande do Sul stands out for higher mortality and DALYs rates, which are supported by other studies56,57. Deaths are more common in rural areas of the state, and among the
predisposing factors are socioeconomic, educational, particularly historical and cultural aspects, as well as those related to working conditions, among others.
Estimates of the GBD 2015 study advanced methodologically in various aspects such as the standardization of data and correction of underreporting and garbage codes, which enabled the comparison between periods, countries, and between the states of Brazil.
There are limitations related to the data sources accessed. Although the SIM has broadened the collection of records and improved their quality in recent years, in the past, and even in some states, there are deaths that were not registered, incomplete records, and high proportion of gar-bage codes. Studies58,59 have highlighted the need for SIM correction and recommended using
adjustment methodologies, such as the active search for deaths. Other limitation is the diference between SIM and GBD data with respect to the data on legal interventions. GBD did not register deaths from legal intervention in Brazil in 2015, and this needs improvement in future editions.
concLuSIon
The study highlights the diferences between the states, the importance of external causes as causes of premature death and disability among young people, and evidences the need to implement policies and measures to reverse this situation. Violence in Brazil is a com-plex phenomenon that has historical roots and is sustained by the great social inequalities. Any attempt to cope with violence needs to be based on a policy for promotion of life, which requires an interdisciplinary approach with inclusive social policies, implemented in partner-ship with health area, which may apply its practices of surveillance and care. In Brazil, the actions to manage the violence in recent years have been implemented through coordinated public policies. However, much more must be done to reduce deaths and injuries from vio-lence. Therefore, this needs to be a priority cause of managers, professionals, and society. The results of the GBD study are a valuable resource for countries seeking to priori-tize the management of the main risk factors of deaths and injuries and increase efective actions for the health of the population.
AcKnoWLEdGMEnt
1. Haagsma JA, Graetz N, Bolliger I, Naghavi M, Higashi H, Mullany EC, et al. The global burden of injury: incidence, mortality, disability-adjusted life years and time trends from the Global Burden of Disease study 2013. Inj Prev 2016; 22: 3-18.
2. United Nations Oice on Drugs and Crime (UNODC). Global study on Homicide 2013. United Nations Publication; 2014.
3. Murray CJL, Vos T, Lozano R, Naghavi M, Flaxman AD, Michaud C, et al. Disability-adjusted life years (DALYs) for 291 diseases and injuries in 21 regions, 1990-2010: a systematic analysis for the Global Burden of Disease Study 2010. The Lancet 2012; 380(9859): 2197-223. DOI: http://dx.doi.org/10.1016/S0140-6736(12)61689-4. 4. Brasil. Peril e tendências da mortalidade por homicídios
e suicídios no Brasil, 2000 a 2014. Brasil. Saúde Brasil 2015: uma análise da situação de saúde. Brasília: Ministério da Saúde; 2016.
5. Ingram MC, Costa MM. Geographies of violence: a spatial analysis of ive types of homicide in Brazil’s municipalities. Kellogg Institute for International Studies 2015; l: 405.
6. Minayo MCS, Constantino P. Visão ecossistêmica do homicídio. Ciênc Saúde Coletiva 2012; 17 (12): 3269-78. Disponível em: http://www.scielo.br/pdf/csc/ v17n12/12.pdf (Acessado em 17 de outubro de 2016). 7. Murray CJL, Lopez AD. The global burden of disease: a comprehensive assessment of mortality and disability from diseases, injuries and risk factors in 1990 and projected to 2020. Cambridge: Harvard University Press; 1996. 8. Peden M, McGee K, Sharma G. The injury chart book:
a graphical overview of the global burden of injuries. Geneva: World Health Organization; 2002. 9. World Health Organization (WHO). Global health risks:
mortality and burden of disease attributable to selected major risks. Geneva: World Health Organization; 2009. 10. Murray CJL, Ezzati M, Flaxman AD, Lim S, Lozano R, Michaud C, et al. GBD 2010: design, deinitions, and metrics. The Lancet 2012; 380(9859): 2063-6. DOI: 10.1016/S0140-6736(12)61899-6.
11. Naghavi M, Wang H, Lozano R, Davis A, Liang X, Zhou M, et al. Global, regional, and national age-sex specific all-cause and all-cause-specific mortality for 240 all-causes of death, 1990-2013: a systematic analysis for the Global Burden of Disease Study 2013. The Lancet 2015; 385(9963): 117-71. 12. GBD 2015 Mortality and causes of death collaborators. Global, regional, and national life expectancy, all-cause-speciic mortality for 249 causes of death, 1980-2015: a systematic analysis for the Global Burden of Disease Study 2015. The Lancet 2016; 388 (10053): 1459-544.
13. Institute for Health Metrics and Evaluation (IHME). Data Visualization. Disponível em: http://www. healthdata.org/results/data-visualizations (Acessado em 18 de outubro de 2016).
14. United Nations Oice On Drugs and Crime (UNODC). United Nations Surveys of Crime Trends and Operations of Criminal Justice Systems (UN-CTS). Disponível em: https://www.unodc.org/unodc/en/ data-and-analysis/statistics.html (Acessado em 20 de outubro de 2016).
15. World Health Organization (WHO). Global status report on road safety 2015. Geneva: World Health Organization; 2015. Disponível em: http://www. who.int/violence_injury_prevention/road_safety_ status/2015/en/ (Acessado em 20 de outubro de 2016). 16. Lozano R, Naghavi M, Foreman K, Lim S, Shibuya K, Aboyans V, et al. Global and regional mortality from 235 causes of death for 20 age groups in 1990 and 2010: a systematic analysis for the Global Burden of Disease Study 2010. The Lancet 2012; 380(9859): 2095-128. 17. Foreman KJ, Lozano R, Lopez AD, Murray CJL.
Modeling causes of death. An integrated approach using CODEm. Popul Health Metr 2012; 10: 1. DOI: 10.1186/1478-7954-10-1.
18. Murray CJL, Ezzati M, Flaxman AD, Lim S, Lozano R, Michaud C, et al. GBD 2010: a multi-investigator collaboration for global comparative descriptive epidemiology. The Lancet 2012: 380(9859): 2055-8. DOI: 10.1016/S0140-6736(12)62134-5.
19. Organização Mundial da Saúde (OMS). Relatório mundial sobre violência e saúde. Brasília; 2002. Disponível em: http://www.opas.org.br/relatorio-mundial-sobre-violencia-e-saude/ (Acessado em 5 de agosto de 2016).
20. World Health Organization (WHO). Preventing suicide: a global imperative. Washington, D.C.: WHO; 2014. Disponível em: http://apps.who.int/ iris/bitstream/10665/131056/1/9789241564779_eng. pdf ?ua=1&ua=1 (Acessado em 12 de agosto de 2016). 21. Reichenheim ME, Souza ER, Moraes CL, Mello-Jorge MHP, Silva CMFP, Minayo MCS. Violence and injuries in Brazil: the efect, progress made, and challenges ahead The Lancet 2011; 377(9781): 1962-75. 22. Andrade SM, Soares DA, Souza RKT, Matsuo T, Souza
HD. Homicídios de homens de quinze a 29 anos e fatores relacionados no estado do Paraná, de 2002 a 2004. Ciênc Saúde Coletiva 2011; 16(1): 1281-8. 23. Soares Filho AM. Vitimização por homicídios segundo
características de raça no Brasil. Rev Saúde Públ 2011; 45(4): 745-55.
24. Souza TO, Souza ER, Pinto LW. Evolução da mortalidade por homicídio no Estado da Bahia, Brasil, no período de 1996 a 2010. Ciênc Saúde Colet 2014; 19(6): 1889-900.
25. Silva MA, Cabral Filho JE, Amorim MMR, Falbo Neto GH. Mulheres vítimas de homicídio em Recife, Pernambuco, Brasil, 2009/2010: um estudo descritivo. Cad Saúde Pública 2013; 29(2): 391-6.
26. Organização das Nações Unidas (ONU). Taxa de feminicídios no Brasil é quinta maior do mundo; diretrizes nacionais buscam solução. 2016. Disponível em: https://nacoesunidas.org/onu-feminicidio-brasil- quinto-maior-mundo-diretrizes-nacionais-buscam-solucao/ (Acessado em 1.º de fevereiro de 2017). 27. Sant’Anna A, Aerts D, Lopes MJ. Homicídios
entre adolescentes no Sul do Brasil: situações de vulnerabilidade segundo seus familiares. Cad Saúde Pública 2005; 21(1): 120-9.
28. Gawryszewski VP, Costa LS. Homicídios e desigualdades sociais no Município de São Paulo. Rev Saúde Pública 2005; 39(2): 191-7.
29. Rates SMM, Melo EM, Mascarenhas MDM, Malta DC. Violência infantil: uma análise das notiicações compulsórias, Brasil 2011. Ciênc Saúde Coletiva 2015; 20(3): 655-65.
30. Mascarenhas MDM, Andrade SSCA, Neves ACM, Pedrosa AAG, Silva MMA, Malta DC. Violência contra a pessoa idosa: análise das notiicações realizadas no setor saúde – Brasil, 2010. Ciênc Saúde Coletiva 2012; 17(9): 2331-41.
31. Duarte EC, Garcia LP, Freitas LRS, Mansano NH, Monteiro RA, Ramalho WM. Associação ecológica entre características dos municípios e o risco de homicídios em homens adultos de 20-39 anos de idade no Brasil, 1999-2010. Ciênc Saúde Coletiva 2012; 17(9): 2259-68.
32. Resende JP, Andrade MV. Crime social, castigo social: desigualdade de renda e taxas de criminalidade nos grandes municípios brasileiros. Est Econ 2011; 41(1): 173-95.
33. Souza GS, Magalhães FB, Gama IS, Lima MVN, Almeida RLF, Vieira LJES, et al. Determinantes sociais e sua interferência nas taxas de homicídio em uma metrópole do Nordeste brasileiro. Rev Bras Epidemiol Suppl D.S.S 2014; 194-203.
34. Peres MFT, Cardia N, Mesquita Neto P, Santos PC, Adorno S. Homicídios, desenvolvimento socioeconômico e violência policial no Município de São Paulo, Brasil. Rev Panam Salud Publica 2008; 23(4): 268-76.
35. Barata RB, Ribeiro MCSA, Sordi MD. Desigualdades sociais e homicídios na cidade de São Paulo, 1998. Rev Bras Epidemiol 2008; 11: 3-13.
36. Mendes LVP, Campos MR, Von-Doellinger VR, Mota JC, Pimentel TG, Schramm JMA. A evolução da carga de causas externas no Brasil: uma comparação entre os anos de 1998 e 2008. Cad Saúde Pública 2015; 31(10): 2169-84. 37. Cardoso FLMG, Cecchetto FR, Corrêa JS, Souza TO. Homicídios no Rio de Janeiro, Brasil: uma análise da violência letal. Ciênc Saúde Coletiva 2016; 21(4): 1277-88.
38. Peres MFT, Almeida JF, Vicentin D, Cerda M, Cardia N, Adorno S. Queda dos homicídios no Município de São Paulo: uma análise exploratória de possíveis condicionantes. Rev Bras Epidemiol 2011; 14(4): 709-21. 39. Nadanovsky P. O aumento no encarceramento e a
redução nos homicídios em São Paulo, Brasil, entre 1996 e 2005. Cad Saúde Pública 2009; 25(8): 1859-64. 40. Neri MC. A nova classe média e a mobilidade social
brasileira (Relatório de Pesquisa). Rio de Janeiro: FGV/IBRE; 2008.
41. Rasella D, Aquino R, Santos CAT, Paes-Sousa R, Barreto ML. Efect of a conditional cash transfer programme on childhood mortality: a nationwide analysis of Brazilian municipalities. The Lancet 2013; 382: 57-64. 42. Souza MFM, Macinko J, Alencar AP, Malta DC, Morais Neto OL. Reductions in irearm-related mortality and hospitalizations in Brazil after gun control. Health Afairs 2007; 26(2): 575-84. DOI: 10.1377/hlthaf.26.2.575 43. Peres MFT, Almeida JF, Vicentin D, Ruotti C, Nery MB,
Cerda M, et al. Evolução dos homicídios e indicadores de segurança pública no Município de São Paulo entre 1996 a 2008: um estudo ecológico de séries temporais. Ciênc Saúde Coletiva 2012; 17(12): 3249-57. 44. Barcellos C, Zaluar A. Homicídios e disputas territoriais
nas favelas do Rio de Janeiro. Rev Saúde Pública 2014; 48(1): 94-102.
45. Nadanovsky P, Celeste RK, Wilson M, Daly M. Homicide and impunity: an ecological analysis at state level in Brazil. Rev Saúde Pública 2009; 43(5): 733-42. 46. González-Pérez GJ, Vega-López MG,
Cabrera-Pivaral CE, Vega-López A, Torre AM. Mortalidad por homicidios en México: tendencias, variaciones socio-geográicas y factores associados. Ciênc Saúde Coletiva 2012; 17(12): 3195-208.
47. Kuczynski E. Suicídio na infância e adolescência. Psicologia USP 2014; 25(3): 246-52.
48. Machado DB, Santos DN. Suicídio no Brasil, de 2000 a 2012. J Bras Psiquiatr 2015; 64(1): 45-54.
49. Mello-Santos C, Bertolote JM, Wang YP. Epidemiology of suicide in Brazil (1980-2000): characterization of age and gender rates of suicide. Rev Bras Psiquiatr 2005; 27(2): 131-4.
51. Brasil. Viva: Vigilância de Violências e Acidentes, 2010 e 2011. Brasília: Ministério da Saúde; 2011. (Série G. Estatísticas e Informação em Saúde). Disponível em: <http://bvsms. saude.gov.br/bvs/ publicacoes/viva_2009_2011_versao_ eletronica.pdf>. Acesso em: 3 nov. 2016.
52. World Health Organization (WHO). The word health report. Shaping the future. Genebra: OMS; 2003. 53. Ponce JC, Andreuccetti G, Jesus MGS, Leyton V, Muñoz
DR. Álcool em vítimas de suicídio em São Paulo. Rev Psiquiatr Clín 2008; 35(1): 13-6.
54. Evans E. The prevalence of suicidal phenomena in adolescents: a systematic review of population-based studies. Suicide and Life – Threatening Behavior 2015; 35(3): 239-50. 55. Baggio L, Palazzo LS. Planejamento suicida entre
adolescentes escolares: prevalência e fatores associados. Cad Saúde Pública 2009; 25(1): 142-50.
56. Ferreira VRT, Trichês VJS. Epidemiological Proile of Suicide Attempts and Deaths in a Southern Brazilian City. Psico 2014; 45(2): 219-27.
57. Viana GN, Zenkner FM, Sakae TM, Escobar BT. Prevalência de suicídio no Sul do Brasil, 2001-2005. J Bras Psiquiatr 2008; 57(1): 38-43.
58. Szwarcwald CL, Morais Neto OL, Frias PG, Souza Júnior PRB, Escalante JJC, Lima RB, et al. Busca ativa de óbitos e nascimentos no Nordeste e na Amazônia Legal: estimação das coberturas do SIM e do Sinasc nos municípios brasileiros. Brasil. Ministério da Saúde (MS). Saúde Brasil 2010: uma análise da situação de saúde. Brasília: MS; 2011. p. 79-97.
59. França E, Teixeira R, Ishitani L, Duncan BB, Cortez-Escalante JJ, Morais Neto OL, et al. Causas mal deinidas de óbito no Brasil: método de redistribuição baseado na investigação do óbito. Rev Saude Pública 2014; 48(4): 671-81.
Received on: 01/19/2017