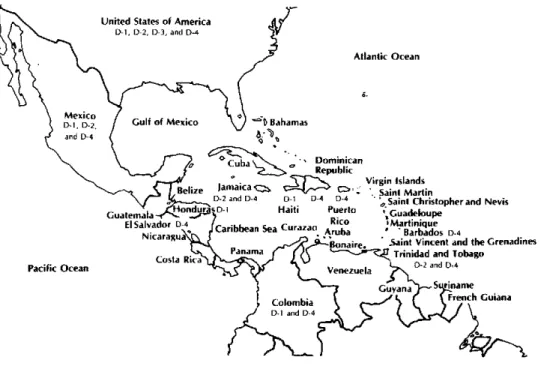
Figure 1. Dengue in the Americas, 1983.
United States of America
D-l, D-2, D-3, and D-4
Costa I
Pacific Ocean
Atlantic Ocean
.D Bahamas
oCuba .- Dominican Republic
Jaac ___:> Virgin Islands
Jamaicaa c * - Saint Martin
D-2 and D-4 D-l D-4 D -4 ' Saint Christopher and Nevis
3á,D-I Haiti Puerto Guadeloupe
Rico Martinique
(Caribhean Sea Curazao Arubai Sea Cu Aruba ''Barbados 0-4Ma ti
.Saint Vincent and the Grenadines
Panama Trinidad and Tobago
0-2 and D-4
ench Guiana
es
Years of Potential Life Lost-Brazil, 1980
Introduction
Because death is inevitable, the main goal of public health is to prolong life as much as possible-that is, to delay death and provide conditions that are appro-priate for an active and healthy life. To achieve this, indicators are needed that serve for establishing pri-orities and making decisions. For that purpose, the "years of potential life lost" indicator (YPLL) is com-ing into increascom-ingly frequent use.
The concept, in which total deaths in each age group are multiplied by the difference between the medium age of death in each group and the number of years of life expectancy, was introduced in 1947, as a means of comparing mortality from tuberculosis with mortal-ity from heart disease. Since then several studies have been conducted to improve the methodology (1). Re-cently, the PAHO Epidemiological Bulletin (2) de-scribed a model for the study of YPLL designed by
the United States Centers for Disease Control and re-ported in the CDC publication, Morbidity and
Mortal-ity Weekly Report.
The purpose of the present article is twofold: to present the data on YPLL in Brazilian state and territo-rial capitals; and to propose "the development in Latin America and the Caribbean of a similar methodology, or perhaps the adaptation of that used by the CDC. '
Area of Research
In 1980 Brazil had 119,098,922 inhabitants living in 23 states, three territories, and the Federal District. Of the total deaths that occurred that year--estimated at one million---data are available on 750,000. Since the coverage and quality of the data vary from region to region in the country, this study refers exclusively
to the information obtained in the capitals of the states
and territories and the Federal District (3). In 1980 the
27 capitals had a combined population of 28,609,905 inhabitants (24% of the national total), and 207,361 deaths of residents were recorded.
Data Sources
In each of the 27 territorial units of the country, the data on deaths from the Civil Registry are compiled by the Secretariat for Health, except in Sáo Paulo and Minas Gerais where this is done by the Secretariats for Planning. The data are coded, transferred to form sheets, and sent to the Ministry of Health, where they are reviewed, corrected, processed, tabulated, and filed.
The states of Sáo Paulo, Minas Gerais, and Rio Grande do Sul send the data on previously reviewed magnetic tapes instead of on form sheets. Rio Grande do Sul also processes and transmits the data for the State of Paraná.
Classification of the Data
The underlying causes of death have been defined
as recommended by the World Health Organization in the Manual of the International Statistical Classifica-tion of Diseases, Injuries, and Causes of Death, Ninth Revision (ICD-9) (4).
For grouping causes of death so as to present them in order of importance, criteria similar to those
de-scribed in the Monthly Vital Statistics Report (5) were
used. The basic list used is the "Brazilian Mortality List" (CID-BR) (6), based on recommendations con-tained in the ICD-9. In Chapter I (Infectious and Parasi-tic Diseases), for example, the emphasis is on the most important causes of death, such as intestinal infections and diseases preventable by vaccination. As is the case in many other countries, the group entitled "reducible infectious diseases" has been given priority in Brazil and there are specific programs for their control.
The ranking of the most important causes of death includes no category labeled as "others," "all others," or "ill-defined." Moreover, when a category corre-sponding to a subtotal is defined, none of its compo-nents is given separately; for instance, if a category is defined as "tuberculosis," no category is provided for "pulmonary tuberculosis."
Although the classification is based on the CID-BR, for the reader's easy reference, tables 1, 2, and 3 provide the ICD-9's three-digit code numbers for the categories listed. Since one of the purposes of this
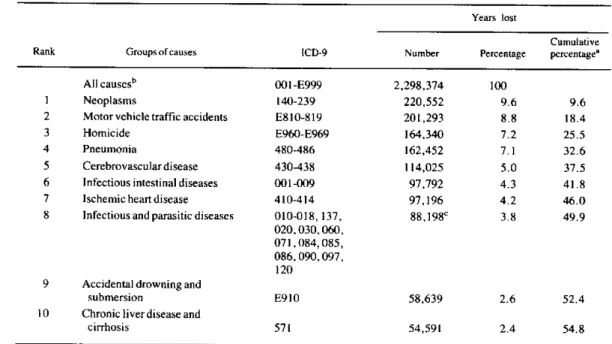
Table 1. Numbers and percentages of years of potential life lost by residents aged 1 to 64 years of Brazilian state and territorial capitals for the 10 main causes of death in 1980.
Years lost
Cumulative
Rank Groups of causes ICD-9 Number Percentage percentage'
All causesb 001 -E999 2,298,374 100
1 Neoplasms 140-239 220,552 9.6 9.6
2 Motor vehicle traffic accidents E810-819 201,293 8.8 18.4
3 Homicide E960-E969 164,340 7.2 25.5
4 Pneumonia 480-486 162,452 7.1 32.6
5 Cerebrovasculardisease 430-438 114,025 5.0 37.5
6 Infectious intestinal diseases 001-009 97,792 4.3 41.8
7 Ischemic heart disease 410-414 97,196 4.2 46.0
8 Infectious and parasitic diseases 010-018, 137, 88,198C 3.8 49.9
020,030,060, 071,084,085, 086, (090, 097, 120
9 Accidental drowning and
submersion E910 58,639 2.6 52.4
10 Chronic liver disease and
cirrhosis 571 54,591 2.4 54.8
aDiscrepancies in totals due to rounding.
b101,637 years lost, or 4.4% of the total for all causes, were due to symptoms, signs and ill-defined conditions, ICD-9 (780-799).
cTuberculosis (010-018, 137) accounted for 59.1% of the total.
e
e
Table 2. Numbers and percentages of years of potential life lost by residents aged 0 to 64 years of the Brazilian state and territorial capitals for the 10 main causes of death in 1980.
Years lost
Cumulative
Rank Groups of causes ICD-9 Number Percentage percentagea
All causesb 001-E999 5,338,324 100
1 Infectious intestinal diseases 001-009 866,374 16.2 16.2
2 Pneumonia 480-486 55,063 10.4 26.6
3 Intrauterine hypoxia and birth asphyxia, re-spiratory distress syndrome, and other
respi-ratory conditions of the fetus and newbom 768-770 516,064 9.7 36.3 4 Slow fetal growth and malnutrition, and
dis-orders relating to short gestation and
unspe-cified low birthweight 764-765 236,512 4,4 40.7
5 Neoplasms 140-239 225,002 4.2 44.9
6 Nutritional deficiencies and anemias 260-269
280-285 209,005 3.9 48.9
7 Motor vehicle traffic accidents E810-E819 203,486 3.8 52.7
8 Congenital anomalies 740-759 173,056 3.2 55.9
9 Homicide E960-E969 165,243 3.1 59.0
10 Cerebrovascular disease 430-438 115,315 2.2 61.2
aDiscrepancies in totals due to rounding.
b288,429 years lost, or 5.4% of the total of all causes, were due to symptoms, signs and ill-defined conditions, ICD-9 (780-799).
Table 3. Numbers and percentages of years of potential life lost and numbers of deaths among residents aged 7 days to 64 years of the Brazilian state and territorial capitals, for the 10 main causes of death in 1980.a
Years lost Deaths
Per- Cumulative Per- Cumulative Rank Groups of causes ICD-9 Number centage percentage Number centage percentageb
AllcausesC 001-E999 4,394,366 100 124,531 100
I Intestinal infectious
dis-eases 001-009 847,669 19.3 19.3 13,453 10.8 10.8
2 Pneumonia 480-486 526,941 12.0 31.3 9,765 7.8 18.6
3 Neoplasms 140-239 224,808 5.1 36.4 13,255 10.6 29.3
4 Nutritional deficiencies 260-269
andanemias 280-285 206,167 4.7 41.1 3,381 2.7 32.0
5 Motor vehicle traffic
accidents E810-E819 203,357 4.6 45.7 6,048 4.9 36.9
6 Homicide E960-E969 164,985 3.8 49.5 4,813 3.9 40.7
7 Cerebrovascular diseases 430-438 115,120 2.6 52.1 7,928 6.4 47.1
8 Congenital anomalies 740-759 112,748 2.6 54.7 1,832 1.5 48.6
9 Vaccine-preventable 032,033,
diseases 037,045,055,771.3 109,783d 2.5 57.2 1,916 1.5 50.1
l0 "Reducible" infectious 010-018, 137,020,
diseases 030,060,071,084,
085,086, 090, 097, 120 9 8,3 8 9b 2.2 59.4 4,037 3.2 53.3
aThe number of deaths of infants aged 0 to 6 days was 14,635, and of persons aged 65 and over 68,195; the total number of deaths for all ages was 207,361. bTuberculosis (010-018, 137) accounted for 59.1% of the total.
c270,240 years lost, or 6.1% of the total for all causes, and 6,147 deaths, or 4.9% of the total for all causes, were due to symptoms, signs, and ill-defined conditions, ICD-9 (780-799).
tabulation list is to define or redefine priorities, in general, mixed groups have not been used.
The Method
Following the example of several researchers and
the CDC models (7-9), the upper age limit for this
study was set at 65 for three reasons: it is the minimum life expectancy desirable; it is frequently taken as the end of the productive years; and the consensus is that including the deaths of persons over 65 would obscure "premature" mortality owing to the bias that could be introduced by the greater weight this would give to chronic degenerative causes.
At the other extreme of the age range, the possibility of excluding infant deaths should be considered. Most studies have eliminated deaths of infants under 1 year of age on the ground that almost all of them are from causes very hard to prevent such as intrauterine hypoxia, birth asphyxia, and other respiratory condi-tions (ICD-9: 768-770), slow fetal growth and fetal malnutrition (764), short gestation and low birthweight (765), and congenital anomalies (740-759)-which, if included, would disproportionately increase the years of potential life lost.
Table 1 shows the years of potential life lost by persons aged 1-64 in the Brazilian state and territorial capitals in 1980. As can be seen, when infant mortality is eliminated, external and chronic degenerative causes predominate.
On the other hand, it can be argued that infant mor-tality should not be excluded when it is very high, as is still the case in Brazil and other Latin American countries. Table 2, which gives the YPLL from 0 to 64 years, shows certain differences from Table 1, for-while some chronic degenerative and external causes have disappeared (cirrhosis, drowning, and ischemic heart disease), others have taken their place (congenital anomalies, perinatal conditions, and nutritional de-ficiencies).
Finally, to achieve equivalence and comparability with CDC data, it would be appropriate to define the lower age limit to be used for this analysis. Although deaths difficult to prevent should be omitted (hypoxia and birth asphyxia, fetal malnutrition, and premature birth, among other causes), infant deaths from diseases preventable by vaccination and from nutritional de-ficiencies should not be excluded.
Analysis of infant mortality in the Brazilian state and territorial capitals suggests that deaths occurring before the seventh day of life should be excluded. The YPLLs from 7 days to 64 years are given in Table 3,
together with the number of deaths occurring from each group of causes. This table reflects more accu-rately the pattern of mortality in the Brazilian capitals, combining as it does chronic degenerative diseases and external causes with infectious diseases and malnutri-tion, which are characteristic of developing countries.
Since the causes of perinatal death which are difficult to prevent almost always occur within the first week of life, the lower age limit of 7 days should be consi-dered for its adoption. This would not substantially alter the results and would have the great advantage of allowing comparisons between groups of the same age: 7 days to 64 years.
(Source: Roberto Augusto Becker, Marcia Galdino Moreira and José Leáo Costa, National Division of Epidemiology, National Secretariat for Basic Health Measures, Ministry of Health, Brazil.)
Editorial Comment
This article discusses the differing results obtained by using alternative age limits for the formulation and interpretation of an indicator based on the number of years of potential life lost.
The listing of ten leading causes can also be substan-tially altered by the grouping of causes used as the basis for selection. How that initial grouping is defined will affect the relative importance of the different causes, whether these are selected by means of the indicator discussed here or of indicators more com-monly used such as the cause-specific mortality rate or proportion.
Any indicator not yet properly tested should be care-fully studied before it is widely adopted, to make sure that the definitions and procedures are suited to the situation under study and to the proposed analytical purposes. Furthermore, it should be noted that in this case the point is to find an indicator that will comple-ment conventional ones rather than replace them.
It is hoped that this study will stimulate others so that a deeper understanding may be gained of the health problems of the countries in the Region.
References
(1) Romeder, J. M. and J. R. McWhinnie. Le développement des années potentielles de vie perdues comme indicateur de mor-talité prématurée. Rev Epidémiol Santé Publique 26:97-115, 1978.
(2) Pan American Health Organization. Surveillance of the lead-ing causes of premature death. Epidemiol Bull 4(5):11-14, 1983.
o
.
(3) Ministry of Health, Secretariat of Basic Health Measures.
Estatísticas de Mortalidade, Brasil 1980. Brasilia, Documentation Center of the Ministry of Health, 1983, 354 pp.
(4) International Classification of Diseases, World Health Or-ganization, Geneva, Vol. 1, 1977 (based on the Recommendations of the Ninth Revision Conference, 1975, and adopted by the Twenty-ninth World Health Assembly).
(5) Technical Notes. Monthly Vital Statistics Report. National Center for Health Statistics. Vol. 33, No. 3, supplement 22 June, 1984.
(6) Lista Brasileira para Mortalidade. Brasília, Ministry of Health, National Division of Epidemiology, 1980. 9 pp.
(7) Premature Deaths, Monthly Mortality, and Monthly Physi-cian Contacts. MMWR 31(9):109-110, 117, 1982.
(8) Table V: Years of potential life lost, deaths, and death rates, by cause of death and estimated number of physician contacts, by principal diagnosis, United States. MMWR 31(18):245, 1982.
(9) Table V: Years of potential life lost, deaths, and death rates, by cause of death and estimated number of physician contacts by principal diagnosis, United States. MMWR 31(22):299, 1982.
Epidemiology in the Experience of the United States Centers
for Disease Control A Personal View'
Disease Control in the United States-An Historical Perspective
This century has been marked by unbelievable prog-ress against infectious diseases everywhere. In 1900, the leading causes of death in the United States were heavily influenced by infectious diseases. Indeed, when the question is raised in terms of years of life lost rather than absolute numbers of deaths, infectious diseases were four of the five leading causes. One by one, these ancient scourges have yielded to medical knowledge and public health practice, resulting in dramatic reductions in, among other diseases, tetanus, diphtheria, poliomyelitis, and typhoid fever. The change has been so astonishing, that diphtheria, the third leading cause of years of life lost in 1900, ac-counted for only three cases of disease in children under the age of 15 in the entire United States in 1982 (provisional data). The cumulative effect of each of these victories has been an increase of over 25 years in life expectancy at birth for United States citizens in the 20th century.
What is remarkable about this increase in life expec-tancy is the relatively small part played by miracle drugs, highly technical surgical advances, and a $200 billion a year health care industry. By and large, the
'Prepared by Dr. William Foege, former Director, U.S. Centers for Disease Control. Presented by Dr. George Hardy at the Seminar on Uses and Perspectives of Epidemiology, Buenos Aires, Argentina, 7-10 November 1983.
improvements can be credited to very simple, yet often poorly organized, activities including improved hous-ing, safe water supplies, waste disposal, food safety regulations, environmental improvement, and immuni-zation programs. The primary effect of these programs has been the reduction of infant and childhood mortal-ity. Indeed, it has been said that if all hospital beds were to disappear overnight, it would have less of an effect on health than would losing one of these simple preventive measures. Epidemiology and epidemiolog-ists have been critically important in developing and implementing these preventive measures.
The Current Situation
A current look at mortality shows a picture uni-magined at the beginning of this century. Only one in-fectious disease (pneumonia and influenza) is still found among the 10 leading causes of death. Not a single infectious disease ranks among the five leading causes of years lost (accidents and adverse effects, malignant neoplasms, diseases of the heart, suicides and homicides, and cerebrovascular diseases). Never-theless, it is striking how many of these causes of years of life lost are potentially preventable. Violence still eludes the best control efforts. Accidents are largely preventable. Diseases of the cardiovascular system have shown significant declines in the last decade and