Karen Glazer PeresI Marco Aurélio PeresI Antonio Fernando BoingI Andréa Dâmaso BertoldiII João Luiz BastosI
Aluisio J D BarrosII
I Programa de Pós-Graduação em Saúde Coletiva. Departamento de Saúde Pública. Universidade Federal de Santa Catarina. Florianópolis, SC, Brasil
II Programa de Pós-Graduação em Epidemiologia. Universidade Federal de Pelotas. Pelotas, RS, Brasil
Correspondence: Karen Glazer Peres
R. Berlin, 209 – Córrego Grande 88037-325 Florianópolis, SC, Brasil E-mail: [email protected] Received: 6/10/2011 Approved: 10/23/2011
Article available from: www.scielo.br/rsp
Reduction of social inequalities
in utilization of dental care in
Brazil from 1998 to 2008
ABSTRACT
OBJECTIVE: To analyze access to and utilization of dental care services in Brazil.
METHODS: We used data from the 2003 and 2008 Brazilian National Household Surveys, which we compared to data from the 1998 survey. We investigated dental care access and utilization variables at ages three, six, nine, 12, 15, and 19 years in the fi rst (Q1) and fi fth (Q5) quintiles of per capita
family income. All analyses took into account the complex sampling strategy.
RESULTS: The proportion of subjects that had never visited a dentist decreased during the period (18.7% in 1998, 15.9% in 2003 and 11.7% in 2008). There was an important reduction in the absolute difference in failure to use dental care services after age nine years between Q1 and Q5 from 1998 to 2008, which decreased to about half its value at 15 (30.3 percentage points - pp to 16.1 pp) and 19 years (20.4 pp to 9.9 pp). Q5/Q1 ratios for recent dental appointments fell across all age groups, especially between zero and six years (Q5/Q1 from 3.2 to 2.6); utilization of the Brazilian Unifi ed Health Care System increased in Q1 and Q5, with a reduction in the Q1/Q5 ratio of approximately 20%. Use of the Brazilian Unifi ed Health Care System increased by approximately 8% in Q1 and 35% in Q5 between 2003 and 2008.
CONCLUSIONS: There have been considerable advances in terms of reducing inequalities in access to, and increasing the utilization of, dental care services in Brazil between 1998 and 2008. However, inequality between social groups remains substantial.
DESCRIPTORS: Dental Health Services, utilization. Health Services Accessibility. Health Inequalities. Social Inequity. PNAD.
INTRODUCTION
Socioeconomic inequalities have a substantial infl uence on health, irrespective of a country’s income level.19 Inequality in income distribution not only affects the health of those who are poor, but also infl uences the living and health conditions of the society as a whole.4 Individuals living in regions with large income inequality are worse off in terms of health than those in equivalent socioeconomic conditions but who live in regions that are more egalitarian.15 Individuals with similar income show different prevalence of tooth loss,16 which is higher in poorer settings and lower in richer ones.17
determinants of health, as a means of targeting public policies and reducing social inequalities in health.
These inequalities extend to the dental health of the Brazilian population. Socioeconomic inequality is observable in the distribution of most dental condi-tions, and in the access to and utilization of dental care services, at both the ecological7 and individual3 levels. The health supplement of the 1998 Pesquisa
Nacional por Amostra de Domicílios (Brazilian
Household Survey – PNAD 1998) showed that only about one-third of subjects had visited a dentist in the year preceding the survey, and that 18.7% of subjects had never had a dental appointment. The proportion of subjects aged 20-49 years who had never had a dental appointment was 16 times higher among the poorest 20% than among the richest 20%.3Data from PNAD 2003 showed a modest reduction (of roughly 3% points) in this proportion when compared to 1998.15
The 2008 PNAD showed evidence of improvement in the utilization of dental care by the population, although 11.7% of subjects had still never visited a dentist.a
In spite of the expressive reduction in dental caries among children and adolescents in Brazil between 198011 and 2010,12,13 the dental conditions of adults and elderly are still poor. Only one-third of the older adults that required total dental prostheses had their needs fulfi lled. Edentulism affects primarily those with monthly income below R$ 400,00 and less than seven years of schooling,b making it a marker of inequality. This inequality in terms of oral health becomes even more emblematic given the expressive dentist-to-population ratio in Brazil (1.11/1000), one of the highest in the world.c
Over 1.2 billion reais were invested in the Brazilian National Dental Health Policy between 2003 and 2006. This value increased to over 2.7 billion between 2007 and 2010. Increasing primary care through the Family Health Program, adding fl uoride to water treatment and supply plants, and providing access to specialized treat-ment through Dental Specialty Centers are part of the strategy to reduce social inequalities in dental health.d In parallel to these investments, there must be an assess-ment of the extent to which they have led to reduc-tion in inequalities in use and access to dental health services among different social groups. Analyzing and monitoring the health of a population and its access to and utilization of health care services is instrumental to the elaboration of public policies and to the evalu-ation of their effectiveness. Systematic collection of
a Instituto Brasileiro de Geografi a e Estatística. Um Panorama da Saúde no Brasil: acesso e utilização dos serviços, condições de saúde e fatores de risco e proteção à saúde 2008. Brasília; 2008 [cited 2010 Jun 24]. Available from: http://www.ibge.gov.br/home/estatistica/ populacao/panorama_saude_brasil_2003_2008/defaulttabzip_2008.shtm.
b Ministério da Saúde (BR). Secretaria de Atenção à Saúde. Departamento de Atenção Básica. Coordenação Geral de Saúde Bucal. Projeto SB Brasil 2003. Condições de saúde bucal da população brasileira 2002-2003. Resultados Principais. Brasília; 2004.
c Conselho Federal de Odontologia. Brasília; 2009[cited 2009 Sep 03]. Available from: http://cfo.org
d Ministério da Saúde (BR). Secretaria de Atenção à Saúde. Departamento de Atenção Básica. Coordenação Geral de Saúde Bucal. Brasil Sorridente. Brasília; 2003[cited 2010 Jun 24]. Available from: http://dtr2004.saude.gov.br/dab/cnsb/brasil_sorridente.php
high-quality information and the creation of national databases for health-related information in Brazil have made such monitoring possible, contributing to the construction and improvement of the Sistema Único de Saúde (Brazilian Unifi ed Health Care System – SUS). Notwithstanding, there are few nationwide studies evaluating time trends in economic inequality in access to and utilization of dental care services.3
The aim of the present study was to investigate the patterns of access to and utilization of dental care services in Brazil.
METHODS
We carried out a study using data from the 2003 and 2008 PNADs, conducted by the Brazilian Institute of Geography and Statistics [Instituto Brasileiro de Geografi a e Estatística] (IBGE).
The health supplement of PNAD 2003 was adminis-tered to 384,834 subjects distributed across 133,255 households in the entire country. In 2008, this sample comprised 150,591 households and 391,868 subjects. Both surveys used a three-stage cluster sampling strategy. The fi rst stage was consisted of municipalities, classifi ed into two categories: self-representative (prob-ability of belonging to the sample = 1) and non self-representative. Municipalities in the second category were stratifi ed and selected with replacement and with probability proportional to their population (obtained from the 2000 Demographic Census). The second stage consisted of selection of census tracts within each municipality, with replacement and proportional prob-ability. The number of households in the tract according to the 2000 Census was used. Individual households were selected in the last stage, with equal probability in each of the sample’s census tracts.6
last attempt to obtain care (yes; no); reason for failing to obtain care (no vacancies; no doctors; no special-ized services; equipment not working; could not pay; waited too long; other), type of facility where care was provided (public; private), health insurance used (yes; no), paid for service (yes; no), use of the SUS (yes; no), and perceived quality of the service (very good; good; regular; bad; very bad).
We estimated the prevalence of variables of interest for the population as a whole. We compared the proportion of subjects that had never visited a dentist at ages three, six, nine, 12, 15, and 19 years in the fi rst (Q1) and fi fth (Q5) quintiles of per capita family income, according to the 1998 PNAD analysis3, to allow for comparisons to be made between the 1998, 2003, and 2008 surveys. Subjects that had never visited a dentist, those that had visited a dentist less than a year prior to the inter-view, those that sought dental care in the two weeks preceding the interview, and those that were unable to obtain dental care in their last attempt were analyzed according to age group (zero to six, seven to 19, 20 to 49, and 50 or more years) and income (fi rst and fi fth quintiles). The proportion of subjects covered by SUS and of subjects who paid for dental treatment or other health services out of pocket were compared between the fi rst and fi fth income quintiles by calculating the ratio between the proportions in the two groups.
Data were analyzed using the STATA 9.0 statistics package. We used the svy family of commands designed for analyzing complex samples. The munici-pality was regarded as the primary sampling unit, and individual sampling weights were obtained from the PNAD databases.
RESULTS
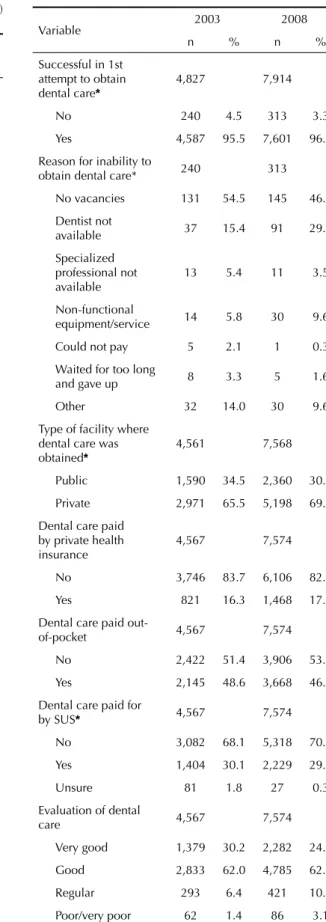
Approximately half of the subjects were female; the most frequent age group was 20 to 49 years, and the least frequent was zero to six years in 2003 and 2008. Recent use of dental care services (appointments in the last year) increased slightly between 2003 and 2008, and the proportion of the population that had never visited a dentist decreased by roughly 30% during the same period. Dental care was the third most frequent reason for seeking health care services in the last two weeks (preceded by appointments due to disease and general health or preventive appointments), increasing from 8.5% to 14.0% (Table 1).
Approximately one-fi fth of those who sought dental care in the preceding two weeks did so in health centers or facilities, and 96.0% of those who sought dental care were successful in their fi rst attempt in both years. Failure to obtain dental care due to lack of vacancies decreased by approximately 20% from 2003 to 2008; lack of physicians and services or malfunctioning
equipment more than doubled in the same period. Over 15% of subjects reported receiving dental care through private health insurance, and SUS accounted for 30% of appointments in both years. Most subjects rated the quality of care as good or very good (Table 1).
Dental care utilization increased across all age groups between 1998 and 2008. Expressive differences within age groups were observed between the poorest (Q1) and the richest (Q5) subjects in all three surveys. The greatest absolute difference between Q1 and Q5 was seen among six-year-olds in 1998 (59.1 percentage points – pp), 2003 (43.4 pp) and 2008 (39.0 pp). Beginning at age nine years, there was an important reduction in the absolute difference between Q1 and Q5 in all three surveys, with decreases of approximately 50% at ages 15 (30.3 pp to 16.1 pp) and 19 (20.4 pp to 9.9 pp) (Figure).
The proportion of subjects that had never visited a dentist was substantially larger among children aged up to six years when compared to other age groups in 2003 (71.5%) and 2008 (66.8%). The proportion of subjects that had never had dental care in the richest quintile (Q5) remained stable between 2003 and 2008 in all age groups. On the other hand, this proportion decreased with time among the poorest quintile (Q1), indicating a decrease in inequality between Q1 and Q5. The greatest reduction (roughly 20%) was detected in age groups seven to 19 (Q1/Q5 ratio of 14.8 in 2003 and of 11.8 in 2008) and 20 to 49 (Q1/Q5 ratio of 21.2 in 2003 and 17.0 in 2008). The greatest fraction of subjects who had recently visited a dentist was in the seven to 19 years age group, regardless of income level, in 2003 and 2008. Ratios between Q5 and Q1 decreased across all age groups from 2003 to 2008, with a greater reduction seen in the zero to six years age group. In this group, the Q5/Q1 ratio decreased from 3.2 in 2003 to 2.6 in 2008 (Table 2).
In all age groups, the proportion of subjects who sought dental care in the previous two weeks was low in both years, but was two times greater in Q5 than in Q1 in 2003. This scenario changed very little in 2008, with the exception of the 50 years or older group, in which the Q5/Q1 ratio increased from 2.3 in 2003 to 3.1 in 2008. Failure to obtain dental care approached 10% among the poorest (Q1) and was of 1% or inexistent among the rich (Q5) in 2003. There was a substantial reduc-tion in the proporreduc-tion of subjects in Q1 who failed to obtain dental care in 2008. The reduction in inequality in terms of access to dental care was of approximately 75% at 50 years or older (Q1/Q5 ratio of 33.3 in 2003 and 8.5 in 2008) (Table 2).
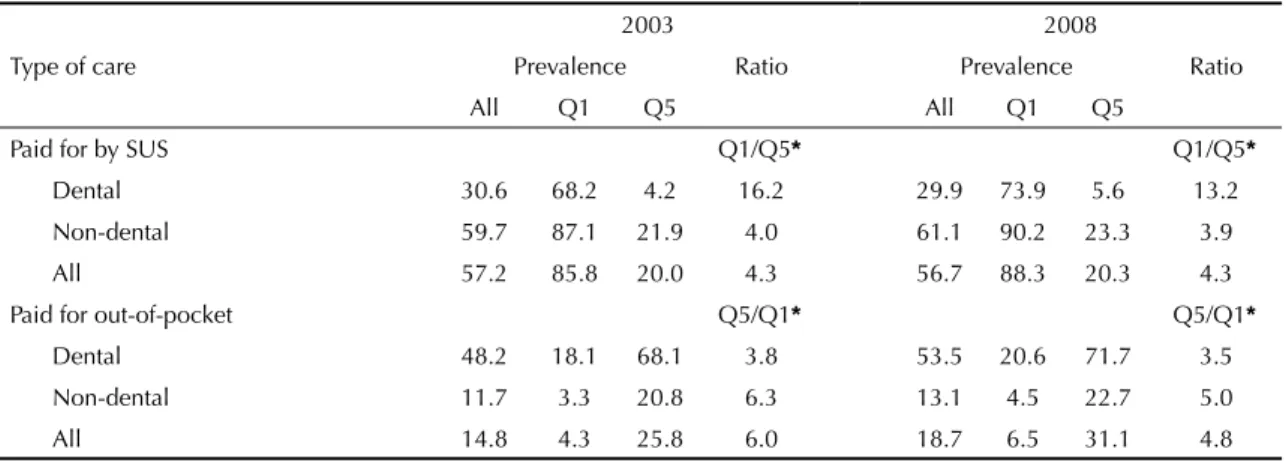
(Q1) and richest (Q5) quintiles, although this increase was higher among the latter. The Q1/Q5 ratio fell by approximately 20% (from 16.2 in 2003 to 13.2 in 2008). The proportion of subjects that used SUS for non-dental care was similar in both surveys for the population as a whole and in the two extreme income quintiles. Reliance on SUS for general health care was four times greater in Q1 than in Q5. Out-of-pocket payment was more frequent for dental care than for non-dental care. Approximately half of the subjects paid for dental care in both years, a proportion that was almost four times higher in Q5 than in Q1. The corresponding ratio for general health care appointments was roughly six in 2003 and 4.8 in 2008 (a 20% reduction).
Dental care was rated mostly as good or very good in all PNADs. In both surveys, the richest (Q5) rated their care better than the poorest (Q1). The same was not true if only care provided through SUS care was considered (Table 4).
DISCUSSION
Dental care utilization increased and failure to obtain care decreased between 2003 and 2008 in Brazil. Even
though dental care is still third among the reasons for seeking medical care, its proportion increased from 8.5% to 14.0% in the period, which, in absolute terms, is equivalent to an additional 10 million people seeking dental care. We observed a decrease in inequalities in access and utilization of dental care services among subjects with high and low income in Brazil during the period. The ratio of the proportion of subjects that had never had dental care among adolescents and young adults fell by approximately 20%, with a smaller reduction observed in the zero to six years age group.
Studies quantifying inequalities in health care by analyzing access to and utilization of dental care services are becoming increasingly common in the Brazilian1,2,5 and international9,18 literature. Hypotheses attempting to explain the positive changes seen in Brazil are complex, and involve socioeconomic and health care-related aspects. Average income in the population and employ-ment rates increased during the studied period,e which may have contributed to increased search for dental care through the out-of-pocket/dental insurance network. On the other hand, increased supply of dental care within the public network, both in primary care (i.e., through the Family Health Strategy),f and secondary care (Dental
0% 20% 40% 60% 80% 100%
1998 2003 2008 1998 2003 2008 1998 2003 2008 1998 2003 2008 1998 2003 2008 1998 2003 2008
3 years
6 years
9 years
12 years
15 years
19 years
Richest quintile (Q5)
Poorest quintile (Q1)
Figure. Proportion of subjects that had never visited a dentist. Amplitude of the variation between the 20% richest (Q5) and
the 20% poorest (Q1), according to age, among the Brazilian population. Brazil, 1998, 2003, and 2008. Source: Brazilian Institute of Geography and Statistics, 2008.
Age
e Instituto Brasileiro de Geografi a e Estatística. SIS 2009: em dez anos, cai de 32,4% para 22,6% o percentual de famílias vivendo com até meio salário mínimo per capita Brasília; 2009 [cited 2009 Sep 03]. Available from: http://www.ibge.gov.br/home/presidencia/noticias/noticia_ visualiza.php?id_noticia=1476&id_pagina=1
Table 1 continuation
Variable 2003 2008
n % n %
Successful in 1st attempt to obtain dental care*
4,827 7,914
No 240 4.5 313 3.3
Yes 4,587 95.5 7,601 96.7
Reason for inability to
obtain dental care* 240 313
No vacancies 131 54.5 145 46.3
Dentist not
available 37 15.4 91 29.1
Specialized professional not available
13 5.4 11 3.5
Non-functional
equipment/service 14 5.8 30 9.6
Could not pay 5 2.1 1 0.3
Waited for too long
and gave up 8 3.3 5 1.6
Other 32 14.0 30 9.6
Type of facility where dental care was obtained*
4,561 7,568
Public 1,590 34.5 2,360 30.6
Private 2,971 65.5 5,198 69.4
Dental care paid by private health insurance
4,567 7,574
No 3,746 83.7 6,106 82.7
Yes 821 16.3 1,468 17.3
Dental care paid
out-of-pocket 4,567 7,574
No 2,422 51.4 3,906 53.9
Yes 2,145 48.6 3,668 46.1
Dental care paid for
by SUS* 4,567 7,574
No 3,082 68.1 5,318 70.4
Yes 1,404 30.1 2,229 29.3
Unsure 81 1.8 27 0.3
Evaluation of dental
care 4,567 7,574
Very good 1,379 30.2 2,282 24.2
Good 2,833 62.0 4,785 62.3
Regular 293 6.4 421 10.4
Poor/very poor 62 1.4 86 3.1
* p < 0.001 (chi-square test) SUS: National Health Care System
Source: Brazilian Institute of Geography and Statistics, 2008
Table 1. Prevalence and distribution of variables related to
utilization of dental care services. Brazil, 2003 (n = 383,156) and 2008 (n = 391,868).
Variable 2003 2008
n % n %
Sex 383,156 391,868
Male 186,780 48.8 190,580 48.7
Female 196,376 51.2 201,288 51.3
Age (years) 383,084 391,868
0 to 6 47,491 12.1 41,141 10.3
7 to 19 96,983 25.0 92,911 23.4
20 to 49 172,802 44.9 179,086 45.4
50 or older 65,808 18.0 78,730 20.9
Last dental
appointment (years)* 383,092 391,868
Less than 1 147,859 38.7 157,027 40.2
1 to 2 73,556 19.1 96,792 24.7
3 or more 99,996 26.3 91,204 23.4
Never visited a
dentist 61,681 15.9 46,845 11.7
Sought health care in
last two weeks* 383,108 391,868
No 327,836 85.4 336,078 85.5
Yes 55,272 14.6 55,790 14.5
Reason for seeking
health care* 55,261 55,790
Tests/preventive
care 15,038 26.8 11,608 20.3
Accident/lesion 2,924 5.3 3,330 6.0
Dental problem 4,827 8.5 7,914 14.0
Treatment/
rehabilitation 1,275 2.3 2,240 3.7
Prenatal care 1,389 2.4 1,226 2.1
Delivery 208 0.4 180 0.3
Vaccination 1,042 1.9 1,026 1.8
Disease 28,218 51.9 27,258 50.0
Medical certifi cate 340 0.5 1,008 1.8
Sought dental care in
last two weeks?* 383,097 391,868
No 378,270 98.8 383,954 98.0
Yes 4,827 1.2 7,914 2.0
Place where 1st dental appointment was attempted*
4,827 7,914
Dentist’s practice 3,354 71.0 5,941 75.9
Health care facility/
center 975 19.5 1,735 21.5
Other health
services 498 9.5 238 2.6
Table 3. Payment out-of-pocket or by the Brazilian National Health Care System (SUS) for general health care and dental care
services; comparison between 1st (Q1) and 5th (Q5) quintiles of per capita family income. Brazil, 2003 and 2008.
Type of care
2003 2008
Prevalence Ratio Prevalence Ratio
All Q1 Q5 All Q1 Q5
Paid for by SUS Q1/Q5* Q1/Q5*
Dental 30.6 68.2 4.2 16.2 29.9 73.9 5.6 13.2
Non-dental 59.7 87.1 21.9 4.0 61.1 90.2 23.3 3.9
All 57.2 85.8 20.0 4.3 56.7 88.3 20.3 4.3
Paid for out-of-pocket Q5/Q1* Q5/Q1*
Dental 48.2 18.1 68.1 3.8 53.5 20.6 71.7 3.5
Non-dental 11.7 3.3 20.8 6.3 13.1 4.5 22.7 5.0
All 14.8 4.3 25.8 6.0 18.7 6.5 31.1 4.8
*p < 0.001 (chi-square test) SUS: National Health Care System
Source: Brazilian Institute of Geography and Statistics, 2008.
Table 2. Proportion of subjects classifi ed according to age group and in the 1st (Q1) and 5th (Q5) quintiles of per capita family
income for different dental care-related outcomes. Brazil, 2003 and 2008.
Variable
2003 2008
Prevalence Ratio Prevalence Ratio
All Q1 Q5 All Q1 Q5
Never visited a dentist (years) Q1/Q5* Q1/Q5*
0 to 6 71.5 83.1 49.1 1.7 66.8 77.6 47.3 1.6
7 to 19 18.4 35.5 2.4 14.8 12.8 24.7 2.1 11.8
20 to 49 4.0 10.6 0.5 21.2 2.6 6.5 0.4 17.0
50 5.0 12.4 1.0 12.4 3.1 7.8 0.7 11.1
All 15.9 34.8 3.9 8.9 11.7 26.1 3.2 8.2
Visited dentist less than one year ago (years) Q5/Q1* Q5/Q1*
0 to 6 23.7 13.7 44.3 3.2 25.7 16.5 43.2 2.6
7 to 19 50.3 34.9 75.1 2.2 51.3 39.4 71.7 1.8
20 to 49 42.6 26.5 62.3 2.4 44.5 31.5 60.2 1.9
50 23.1 10.7 40.7 3.8 25.4 14.0 42.2 3.0
All 38.7 25.6 57.5 2.2 40.2 30.1 55.3 1.8
Sought dental care (last two weeks) (years) Q5/Q1* Q5/Q1*
0 to 6 0.6 0.4 0.9 2.3 0.9 0.6 1.3 2.2
7 to 19 1.6 1.1 2.6 2.4 2.4 1.7 3.9 2.3
20 to 49 1.4 1.0 2.0 2.0 2.3 1.8 3.1 1.7
50 0.8 0.6 1.4 2.3 1.6 0.9 2.8 3.1
All 1.2 0.9 1.9 2.1 2.0 1.5 3.0 2.0
Unable to obtain dental care (years) Q1/Q5* Q5/Q1*
0 to 6 3.5 9.6 - - 4.4 7.0 -
-7 to 19 4.8 10.0 - - 3.2 7.1 1.1 6.5
20 to 49 4.6 12.1 1.7 7.1 3.5 8.3 1.2 6.9
50 3.2 13.3 0.4 33.3 2.5 8.5 1.0 8.5
All 4.5 11.0 1.0 11.0 3.3 7.7 1.0 7.7
*p < 0.001 (chi-square test), except for the variable “unable to obtain care,” category “0 to 6 years,” for which p = 0.069 in 2003 and p = 0.048 in 2008.
Specialty Centers),f may have contributed towards the increase in the number of patients seen. The increased number of appointments also in the out-of-pocket and private health insurance networks support the hypothesis that increased income may have led to an greater search for dental care. Increased income may have had a greater impact than the expansion of the public network in terms of health care utilization.
In spite of this reduction, inequality in dental care in Brazil is still large compared to the standards of devel-oped countries. The same appears to be true in Hong Kong, where family income has a direct effect on dental care utilization.9 The proportion of subjects who had never visited a dentist in each income stratum is more unequal among younger age groups. This is concerning because the major dental diseases, such as caries, begin early in life, affecting the deciduous dentition. Socioeconomic inequality in access to and utilization of dental care have been documented in other Brazilian surveys. One study analyzed data from the System for Surveillance of Risk and Protective Factors for Chronic Diseases by Telephone Survey [Sistema de Vigilância de Fatores de Risco e Proteção para Doenças Crônicas por Inquérito Telefônico (Vigitel)] 2009 survey, and found that individual characteristics (low schooling) and regional differences (low economic development index) were associated with less access to dental care services.14 Social inequality in recent use of dental care were observed in the adult and elderly population covered by ESF in a municipality of Southern Brazil. Low schooling and not owning a home were found to be the most important risk factors for this outcome.2 Inequalities in utilization of free dental care services by children in England are notoriously associated with schooling and ethnicity.10 The same was found to be true for the elderly population of that country, especially with regard to lower regular use of dental services among those living in impoverished neighborhoods.8
In the present study, recent use of dental care services was greater among school children (seven to 19 years), regardless of income class, as was the equality between the extreme income quintiles. Although supply of health care services by SUS has increased, it is still likely to be greater among the younger population, reproducing the historical model of organization of public dental care services in Brazil, which has always prioritized the school-age population.12 Dental care through SUS increased between 2003 and 2008 in the two income segments analyzed (Q1 and Q5), but remained lower than the levels reached by general health care. The slight increase in utilization of dental care through SUS among the richest quintile may refl ect increased supply, improved quality of services, and the access to specialized treatment now available through the public network. This hypothesis is supported by the high rate of approval of the dental care service provided through SUS, which did not vary with income. On the other hand, coverage of dental care by SUS is low compared to its coverage of medical care, and varies greatly between the country’s regions (higher in the poorest areas).14 The most recent national survey of dental health (Pesquisa SBBrasil 2010) indicates that the North region has greater proportion of subjects that never had dental appointments, mean interval since the last appointment, and proportion of appointments in response to pain than the South and Southeast.g Analyzing utilization of dental care services is essen-tial to evaluate the effective reach of universal health care access, the guiding principle of SUS. Inclusion of dental health in surveys such as PNAD legitimates dental health as an unalienable component of general health. Surveys such as PNAD have the advantage of investigating large samples, which produces highly precise estimates at the national level. On the other hand, studies based on secondary data may have limita-tions, such as the restriction of analysis to the available information, which is formulated by researchers other
Table 4. Rating of dental care as “good or very good,” according to mode of payment, for the 1st (Q1) and 5th (Q5) quintiles
of per capita family income. Brazil, 2003 and 2008.
Mode of payment for carea Year Prevalence p
All Q1 Q5
Out-of-pocket 2003 96.0 (n = 2,072) 95.3 (n = 103) 96.9 (n = 920) 0.403
2008 96.4 (n = 3,771) 92.6 (n = 244) 98.1 (n = 1,512) < 0.001
SUS 2003 86.7 (n = 1,243) 85.3 (n = 347) 85.7 (n = 52) 0.366
2008 87.3 (n = 1,986) 86.9 (n = 621) 87.6 (n = 106) 0.543
All 2003 92.6 (n = 4,268) 88.0 (n = 528) 96.1 (n = 1,371) < 0.001
2008 93.6 (n = 7,131) 89.1 (n = 957) 97.2 (n = 2,194) < 0.001
a The categories are not mutually exclusive or complementary.
SUS: National Health Care System
Source: Brazilian Institute of Geography and Statistics, 2008.
1. Araújo CS, Lima RC, Peres MA, Barros AJD. Utilização de serviços odontológicos e fatores associados: um
estudo de base populacional no Sul do Brasil. Cad
Saude Publica. 2009;25(5):1063-72. DOI:10.1590/ S0102-311X2009000500013
2. Baldani MH, Brito WH, Lawder JAC, Mendes YBE, Silva FFM, Antunes JLF. Determinantes individuais da utilização de serviços odontológicos
por adultos e idosos de baixa renda. Rev Bras
Epidemiol. 2010;13(1):150-62. DOI:10.1590/S1415-790X2010000100014
3. Barros AJD, Bertoldi DA. Desigualdades na utilização e no acesso a serviços odontológicos:
uma avaliação em nível nacional. Cienc Saude
Coletiva. 2002;7(4):709-17. DOI:10.1590/S1413-81232002000400008
4. Buss PM, Pellegrini Filho A. Iniqüidades em saúde no Brasil, nossa mais grave doença: comentários sobre o documento de referência e os trabalhos da Comissão
Nacional sobre Determinantes Sociais da Saúde. Cad
Saude Publica. 2006;22(9):2005-8. DOI:10.1590/ S0102-311X2006000900033
5. Camargo MBJ, Dumith SC, Barros AJD. Uso regular de serviços odontológicos entre adultos: padrões de
utilização e tipos de serviços. Cad Saude Publica.
2009;25(9):1894-1906. DOI:10.1590/S0102-311X2009000900004
6. Deaton A. The analysis of household surveys: a microeconometric approach to development policy. Baltimore: The Johns Hopkins University Press; 1997.
7. Fernandes LS, Peres MA. Associação entre atenção básica em saúde bucal e indicadores socioeconômicos
municipais. Rev Saude Publica. 2005;39(6):930-6.
DOI:10.1590/S0034-89102005000600010
8. Lang IA, Gibbs SJ, Steel N, Melzer D. Neighborhood deprivation and dental service use: a cross-sectional analysis of older people in England. J Public Health(Oxf). 2008;30(4):472-8.
9. Lu HX, Wong MCM, Lo ECM, McGrath C. Trends in oral health from childhood to early adulthood: a life
course approach. Community Dent Oral Epidemiol.
2011;39(4):352-60.
10. Maserejian NN, Trachtenberg F, Link C, Tavares M. Underutilization of dental care when it is freely available: a prospective study of the New England
Children’s Amalgam Trial. J Public Health Dent.
68(3):39-45.
11. Narvai PC. Odontologia em saúde bucal coletiva. 2. ed. São Paulo: Santos; 2002.
12. Narvai PC, Frazão P, Roncalli AG, Antunes JLF. Cárie dentária no Brasil: declínio, polarização,
iniqüidade e exclusão social. Rev Panam Salud
Publica. 2006;19(6):385-93. DOI:10.1590/S1020-49892006000600004
13. Peres MA, Antunes JLF, Peres KG. Is water fl uoridation effective in reducing inequalities in dental caries distribution in developing countries? Recent fi ndings
from Brazil. Soz Praventivmed. 2006;51(5):302-10.
14. Peres MA, Iser BPM, Boing AF, Yokota RTC, Malta DC, Peres KG. Desigualdades no acesso e na utilização de serviços odontológicos no Brasil: análise do VIGITEL
2009. Cad Saude Publica. 2012;28. No prelo.
15. Pinheiro RS, Torres TZG. Uso de serviço odontológico
entre os estados do Brasil. Cienc Saude Coletiva.
2006;11(4):999-1010. DOI:10.1590/S1413-81232006000400021
16. Robert SA, Lee KY. Explaining race differences in health among older adults: The contribution of
community socioeconomic context. Res Aging.
2002;24(6):654-83. DOI:10.1177/016402702237186
17. Sanders AE, Turrel G, Slade GD. Affl uent
neighborhoods reduce excess risk of tooth loss among
the poor 2008. J Dent Res. 87(10):969-73.
18. Sondell K, Söderfeldt B, Hugoson A. Dental care utilization in a Swedish county in 1993 and 2003.
Swed Dent J. 2010;34(4):217-28.
19. Wilkinson RG, Pickett KE. Income inequality and population health: a review and explanation of the
evidence. Soc Sci Med. 2006;62(7):1768-84.
20. World Health Organization. Closing the gap in a generation. Health equity through action on the social determinants of health. Final report of the Commission on Social Determinants of health (CSDH). Geneva; 2008.
REFERENCES
Research sponsored by Conselho Nacional de Desenvolvimento Científi co e Tecnológico (CNPq – process no. 409630/2006-3).
The authors declare no confl ict of interests.
than the fi nal users of the information. Our results may contribute to the evaluation of public policies aiming at reducing inequalities in health.
The results of the present study indicate a considerable advance in the reduction of inequalities in access to and utilization of dental care services in Brazil between 1998 and 2008. However, the gap between social groups is