Severity of malocclusion in adolescents:
populational-based study in the north of
Minas Gerais, Brazil
Marise Fagundes SilveiraI, Rafael Silveira FreireII, Marcela Oliveira NepomucenoIII, Andrea Maria Eleutério de Barros Lima MartinsIV, Luiz Francisco MarcopitoV
I Departamento de Ciências Exatas. Universidade Estadual de Montes Claros. Montes Claros, MG, Brasil II Pós-Graduação em Ciências da Saúde. Universidade Estadual de Montes Claros. Montes Claros, MG, Brasil III Programa de Iniciação Científica em Medicina. Faculdades Integradas Pitágoras de Montes Claros. Montes
Claros, MG, Brasil
IV Departamento de Odontologia. Universidade Estadual de Montes Claros. Montes Claros, MG, Brasil V Departamento de Medicina Preventiva. Escola Paulista de Medicina. Universidade Federal de São Paulo. São
Paulo, SP, Brasil
ABSTRACT
OBJECTIVE: To identify the factors associated with severity of malocclusion in a population of adolescents.
METHODS: In this cross-sectional population-based study, the sample size (n = 761) was calculated considering a prevalence of malocclusion of 50.0%, with a 95% conidence level and a 5.0% precision level. he study adopted correction for the efect of delineation (def = 2), and a 20.0% increase to ofset losses and refusals. Multistage probability cluster sampling was adopted. Trained and calibrated professionals performed the intraoral examinations and interviews in households. he dependent variable (severity of malocclusion) was assessed using the Dental Aesthetic Index (DAI). he independent variables were grouped into ive blocks: demographic characteristics, socioeconomic condition, use of dental services, health-related behavior and oral health subjective conditions. he ordinal logistic regression model was used to identify the factors associated with severity of malocclusion.
RESULTS: We interviewed and examined 736 adolescents (91.5% response rate), 69.9% of whom showed no abnormalities or slight malocclusion. Deined malocclusion was observed in 17.8% of the adolescents, being severe or very severe in 12.6%, with pressing or essential need of orthodontic treatment. he probabilities of greater severity of malocclusion were higher among adolescents who self-reported as black, indigenous, pardo or yellow, with lower per capita income, having harmful oral habits, negative perception of their appearance and perception of social relationship afected by oral health.
CONCLUSIONS: Severe or very severe malocclusion was more prevalent among socially
disadvantaged adolescents, with reported harmful habits and perception of compromised esthetics and social relationships. Given that malocclusion can interfere with the self-esteem of adolescents, it is essential to improve public policy for the inclusion of orthodontic treatment among health care provided to this segment of the population, particularly among those of lower socioeconomic status.
DESCRIPTORS: Adolescent. Malocclusion, epidemiology. Risk Factors. Socioeconomic Factors. Self Concept. Cross-Sectional Studies.
Correspondence: Marise Fagundes Silveira Rua 3, 259 Barcelona Parque 39401-825 Montes Claros, MG, Brasil
E-mail: [email protected]
Received: 16 Sep 2014
Approved: 31 May 2015
How to cite: Silveira MF, Freire RS, Nepomuceno MO, Martins AMEBL, Marcopito LF. Severity of malocclusion in adolescents: populational-based study in the north of Minas Gerais, Brazil. Rev Saude Publica. 2016;50:11.
Copyright: This is an open-access article distributed under the terms of the Creative Commons Attribution License, which permits unrestricted use, distribution, and reproduction in any medium, provided that the original author and source are credited.
INTRODUCTION
Although the incidence of dental caries has diminished in many countries, Brazil included, it persists as the main oral health problem among children and adolescents9,19. As dental
health improves among the population, other oral problems may require attention, such as malocclusion2. Malocclusion is considered a problem related to the growth and development
of maxillary or mandibular bones during childhood and adolescence11. his kind of anomaly
may have functional, aesthetic or psychosocial efects, with negative impact on the daily life of afected individuals16. It is caused by an interaction of environmental, congenital,
morphological, and biomechanical factors8.
Malocclusion can be considered a public health problem, given its high prevalence and possibilities of prevention and treatment20. Although the demand for orthodontic treatment in
contemporary society has grown, population-based comprehensive studies investigating the prevalence of malocclusion and its association with sociodemographic factors, use of dental services and self-perceived oral health among Brazilian adolescents are still relatively scarce. Within this context, this study aimed to identify the factors associated with malocclusion in a population of Brazilian adolescents.
METHODS
his cross-sectional population-based study used data collected in the epidemiological survey of oral health conditions among the population of Montes Claros, state of Minas Gerais, Brazil (Project SB-MOC)14. Montes Claros is a middle-sized town located in northern Minas Gerais,
in the Sao Francisco River basin, 442 km from the state capital. It has a human development index (HDI) of 0.770 and per capita income of R$650.02. It is considered the region’s main economic and educational center, with economic activities focused on manufacturing, services, trade, and agriculture and livestock farming. According to the 2010 censusa, the
municipality has a resident population of 361,971 inhabitants, 34,143 of whom (9.4%) are in the 15 to 19 age group.
his epidemiological survey of oral health aimed to estimate the prevalence of various oral health problems, such as dental caries, periodontal disease, malocclusion, luorosis, among others, in adolescents aged from 15 to 19. Sample size was calculated to estimate population parameters with a prevalence of 50.0%, 95% of conidence level and 5.0% of precision. he study adopted correction for the efect of delineation (def = 2) deriving from cluster sampling, and a 20.0% increase to ofset losses and refusals. A sample of at least 761 people was estimated.
A two-stage cluster sampling process was adopted. In the irst stage, 52 of the 276 urban census sectors of the municipal area were chosen (sample fraction [f1] = 0.19) by simple random sampling (SRS). he number of sectors was deined considering the average number of households per sector and the average number of individuals per household (data based on the 2003 census and estimated for 2008). In the second stage, a sample fraction (f2) of the blocks in each one of the 52 chosen sectors was selected by SRS (f2 varied between 0.06 and 0.16), resulting in an average of seven block per sector. All the households in the selected blocks were visited in sequence and residents in the studied age group were invited to take part in the survey. In the rural area, a single-stage cluster sampling process was used. Two of the eleven identiied rural areas (f1 = 0.18) were selected by SRS. he number of areas was
deined considering the average number of households in the rural areas, the average number of individuals per household and the percentage of rural population in the municipality (data provided by the town’s epidemiological surveillance service). All households situated within 500 m of a reference institution (school) were selected and their residents aged from 15 to 19 were invited to take part in the survey. Details on the sampling procedure can be obtained in another publication15.
a Instituto Brasileiro de Geografia
To incorporate the structure of the complex sampling plan in the data statistical analysis, each interviewee was associated to a weight p, corresponding to their inverse probability of inclusion in the sample (f). In the urban area, the selection of individuals was done in two stages. herefore, their inclusion probability was obtained by the product of the inclusion probability in each one of the stages (f = f1 x f2), in which f1 = inclusion probability in the irst stage and f2 = inclusion probability in the second stage. he possibility of refusal to participate was also considered, which would cause diferent inclusion probabilities. hus, the response rate (rresponse) in each sector was incorporated and the inal inclusion probability of each individual was obtained by the expression f = f1 x f2 x rresponse. In the rural area, the selection of individuals was composed of a single stage, and therefore the inclusion probability was calculated by the expression f = f1 x rresponse, considering f1 = inclusion probability in the irst stage. Finally the weight of each interviewee was obtained by inverse inclusion probability (p = 1/f)15.
Field work was carried out by 24 teams composed of a recorder and an examiner who were previously trained and calibrated. During training and calibration, inter- and intra-examiner agreement was estimated by intraclass correlation coeicient (ICC) for the dental aesthetic index (DAI) and the weighted kappa for their components, with an acceptable limit value of 0.60. Examiners whose agreement exceeded this limit were considered it; the remainder were submitted to an additional calibration exercise until the acceptable limit was reached. Details of the training and calibration process can be obtained in another publication13.
Data were collected with a handheld computer using an especially created software program, which enabled the simultaneous and automatic construction of a database. Interviews and intraoral examinations were performed in a spacious environment with natural light with a mirror and a Community Periodontal Index (CPI) probe of the World Health Organization (WHO), previously sterilized. Data stored in the handheld computers were transferred to a main computer and then exported to PASW 17.0 software for checking, revision, and correction. he dependent variable severity of malocclusion was evaluated according to DAI, enabling the classiication of individuals into: absence of abnormality or slight malocclusion (DAI ≤ 25); deined malocclusion (DAI = 26 to 30); severe malocclusion (DAI = 31 to 35); and very severe malocclusion (DAI > 36)13. he dependent variables were: (a) demographic characteristics: sex (male; female),
self-reported skin color (non-white; white), marital status (single; married or stable union) and age (in years); (b) socioeconomic condition: level of education (≤ 8 years of schooling; > 8 years of schooling), monthly per capita income (≤ R$200.00; > R$200.00), household crowding (more than
one person per room; up to one person per room); (c) use of dental services: use of service (never used; used), type of dental service used (public or charity; private, health plan or insurance), time since last dentist appointment (< 1 year; ≥ 1 year), regular dentist visits (yes; no); (d) health-related behavior: tooth-brushing frequency (< 3 times/day; ≥ 3 times/day), use of dental loss (no; yes), use of topical luoride (no; yes), harmful oral habits (yes; no), smoking habits (yes; no), alcohol consumption (yes; no), physical exercise (never or rarely; occasionally; frequently or always); and (e) oral health subjective conditions: self-perceived oral health (negative; positive), self-perceived chewing (negative; positive), self-perceived appearance of teeth or gums (negative; positive), self-perceived speech due to teeth or gums (negative; positive), self-perceived social relationship afected by oral health (afects; does not afect).
he skin color variable was classiied as non-white (those who self-reported as black, pardo, yellow or indigenous) and white (those who self-reported as white). As to per capita income, the distribution median was R$200.00, a value used as the cutof point. Self-perceived oral health, chewing, appearance and speech were considered negative when individuals rated them as very bad, bad or average; and positive when rated as good or very good.
he variables were described through their absolute and relative frequency distributions. A 95% conidence interval for the prevalence of malocclusion was also estimated. An ordinal logistic regression model (proportional odds model) was used in the analysis of factors associated with the outcome1. Bivariate analyses were performed and variables presenting a descriptive
was adopted to construct the multiple regression model, i.e., the model was started with the most statistically signiicant variable, selected in the bivariate analysis, and the remaining variables were then added, one by one, in descending order of the descriptive level. Variables presenting signiicant association with the outcome (p > 0.05) were kept in the inal model. Raw and adjusted odds ratios were estimated, with their respective 95% conidence intervals. he adjustment quality of the inal model was evaluated by the deviance test and the assumption of proportional odds was assessed by parallel lines tests1. All analyses were performed on the
PASW 17.0 statistical program, using the complex sample model to analyze data from complex samples, with the aim of adjusting the variability estimates in the cluster sampling. his survey was approved by the ethics committee of the Universidade Estadual de Montes Claros (Opinion 318/08). All individuals participating in the survey signed an informed consent form.
RESULTS
A total of 763 adolescents took part in the survey, 99.6% of whom lived in the urban area. he response rate was 91.5%, and the main reason for losses was failure to locate adolescents after three household visits.
he average age of adolescents was 17.1 years old, and most of them were female (52.7%), single (94.7%), self-reported non-white skin color (73.1%), attending an educational institution (73.9%), had more than eight years of schooling (77.2%) and a monthly per capita income equal to or below R$200.00 (58.7%). he other characteristics are described in Table 1. Regarding severity of malocclusion, an expressive percentage (69.6%) of adolescents had no abnormalities or slight malocclusion, while deined malocclusion was observed in 17.8%. Fifty-six (6.2%) and 49 (6.4%) adolescents showed severe or very severe malocclusion, respectively. Prevalence of malocclusion conditions is presented in Table 2.
Bivariate analysis results are shown in Table 3, which presents only variables in which p < 0.20, selected for the multiple analysis: skin color, level of education, per capita income,
Table 1. Distribution of adolescents aged from 15 to 19 according to demographic and socioeconomic characteristics, use of dental services, health-related behavior and oral health subjective conditions. Montes Claros, MG, Southeastern Brazil, 2009.
Variable na %b
Demographic characteristic Sex
Male 367 47.3
Female 396 52.7
Self-reported skin color
Non-white 554 73.1
White 209 26.9
Marital status
Single 729 94.7
Married or stable union 34 5.3
Socioeconomic condition
Level of education (years of schooling)
> 8 595 77.2
≤ 8 168 22.8
Attending school
No 185 26.1
Yes 578 73.9
Monthly per capita incomec
≤ R$200.00 374 58.7
> R$200.00 309 41.3
Table 1. Distribution of adolescents aged from 15 to 19 according to demographic and socioeconomic characteristics, use of dental services, health-related behavior and oral health subjective conditions. Montes Claros, MG, Southeastern Brazil, 2009. Continuation
Household crowding
More than one person per room 122 18.5
Up to one person per room 641 81.5
Use of dental services Use of dental services
Never 46 6.1
Has used 717 93.9
Type of dental service
Never used 46 6.1
Public or charity 366 48.0
Private, health plan or insurance 351 45.9
Time since last dentist appointment
Never seen a dentist 46 6.1
One year or more 333 43.7
Less than one year 384 50.2
Sees dentist regularly
No 575 75.4
Yes 188 24.6
Health-related behavior Tooth-brushing frequency
< 3 times/day 217 28.9
≥ 3 times/day 545 71.1
Use of dental floss
No 426 58.8
Yes 336 41.2
Use of topical fluoride
No 509 60.7
Yes 253 39.3
Harmful oral habits
Yes 302 41.2
No 457 58.8
Smoking
Yes 40 5.1
No 723 94.9
Alcohol consumption
Yes 146 18.8
No 617 81.2
Physical activity
Rarely or never 260 31.8
Occasionally 160 20.0
Always or frequently 343 48.2
Oral health subjective condition Self-perceived oral health
Negative 257 34.4
Positive 505 65.6
Self-perceived chewing
Negative 162 22.0
Positive 600 78.0
Self-perceived appearance of teeth or gums
Negative 250 35.4
Positive 513 64.6
Self-perceived speech due to teeth or gums
Negative 92 14.0
Positive 671 86.0
Self-perceived relationship affected by oral health
Affects 128 17.5
Does not affect 621 82.5
a Totals vary due to information losses.
b Values corrected by design effect (deff).
household crowding, time since last dentist appointment, harmful oral habits, self-perceived oral health, appearance and relationship afected by oral health.
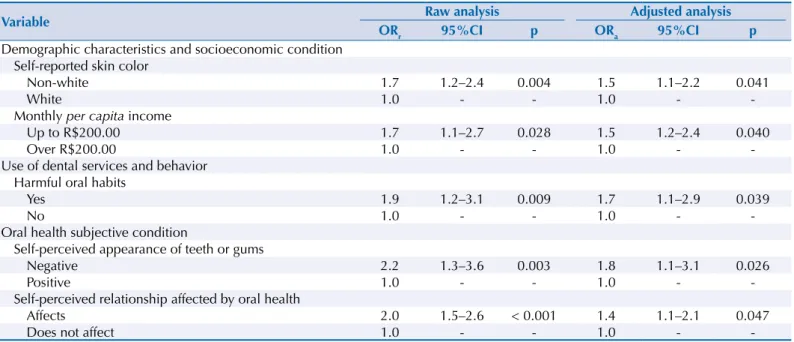
Table 4 shows the multiple analysis results. Among the demographic and socioeconomic characteristics, we associated the following factors with greater severity of malocclusion: non-white adolescents (OR = 1.5; 95%CI 1.1–2.2) with a monthly per capita income below R$200.00 (OR = 1.5; 95%CI 1.1–2.4). Individuals who reported having harmful habits in the present or past showed higher chances (OR = 17; 95%CI 1.1–2.9) of belonging to a category of greater severity of malocclusion. Among oral health subjective conditions, the following were conditions associated to greater severity of malocclusion: adolescents with negative self-perceived appearance (OR = 1.8; 95%CI 1.1–3.1) and self-perceived social relationship afected by oral health conditions (OR = 1.4; 95%CI 1.1–2.1).
Table 2. Distribution of adolescents aged from 15 to 19 according to severity of malocclusion and occlusal conditions evaluated by the dental aesthetic index (DAI). Montes Claros, MG, Southeastern Brazil, 2009.
Variable na % IC95%b
Severity of malocclusion
Absence of malocclusion or slight malocclusion 510 69.5 63.3–75.9
Defined malocclusion 134 17.8 13.4–23.0
Severe malocclusion 56 6.2 4.2–8.5
Very severe malocclusion 49 6.4 4.6–8.6
Occlusal condition %b
Number of missing teeth in superior dental arch
None 748 98.5
One or more 13 1.5
Number of missing teeth in inferior dental arch
None 755 99.3
One or more 6 0.7
Alignment in anterior segment
None 460 58.2
One segment 195 26.6
Two segments 106 15.2
Spacing in anterior segment
None 618 80.8
One segment 119 16.7
Two segments 24 2.5
Midline diastema
No 613 80.5
Yes 146 19.5
Anterior superior irregularity
< 2 mm 567 77.4
≥ 2 mm 194 22.6
Anterior inferior irregularity
< 2 mm 569 75.2
≥ 2 mm 192 24.8
Maxillary overjet
< 4 mm 603 80.4
≥ 4 mm 158 19.6
Mandibular overjet
< 4 mm 759 99.6
≥ 4 mm 3 0.4
Anterior openbite
< 2 mm 728 95.8
≥ 2 mm 33 4.2
Molar relationship
Normal 407 56.3
Half cusp 247 32.1
One cusp 97 11.6
a Totals vary due to information losses.
Table 3. Distribution of severity of malocclusion among adolescents aged from 15 to 19 according to demographic and socioeconomic characteristics, use of dental services, health-related behavior and oral health subjective conditions. Montes Claros, MG, Southeastern Brazil, 2009.
Variable
Severity of malocclusion Absent or slight Defined Severe Very severe Total
ORr 95%CI p*
n % n % n % n % n
Demographic characteristics and socioeconomic condition Self-reported skin color
Non-white 355 67.2 102 18.4 47 7.2 40 7.2 544 1.7 1.2–2.4 0.004
White 155 77.3 32 15.7 9 2.9 9 4.1 205 1.0 -
-Level of education
> 8 years of schooling 409 71.7 97 16.8 42 5.5 34 5.9 582 0.7 0.5–1.0 0.069
≤ 8 years of schooling 101 64.1 37 20.5 14 7.7 15 7.8 167 1.0 -
-Per capita income
≤ R$200.00 224 62.7 74 20.7 38 7.9 30 8.7 366 1.7 1.1–2.7 0.028
> R$200.00 218 74.0 48 15.3 18 5.5 19 5.2 303 1.0 -
-Household crowding
> 1 person/room 70 60.3 26 20.0 11 8.8 11 10.9 118 1.8 1.1–2.9 0.027
≤ 1 person/room 440 72.1 108 17.2 45 5.4 38 5.3 631 1.0 -
-Use of dental services and health-related behavior Time since last dentist appointment
Never seen a dentist 31 67.1 7 12.1 1 1.5 6 19.2 45 1.6 0.72–3.4 0.250
One year or more 214 67.6 57 17.0 32 8.1 24 7.4 327 1.3 1.0–1.8 0.066
Less than one year 265 72.3 70 19.0 23 4.8 19 3.9 377 1.0 -
-Harmful oral habits
Present 180 62.2 64 20.2 31 8.9 22 8.7 297 1.9 1.2–3.1 0.009
Absent 329 75.5 68 15.8 25 4.0 27 4.7 449 1.0 -
-Oral health subjective condition Self-perceived oral health
Negative 157 63.9 43 17.0 25 7.9 25 11.1 250 1.7 1.1–2.5 0.015
Positive 352 73.0 91 18.0 31 5.1 24 3.9 498 1.0 -
-Self-perceived appearance of teeth or gums
Negative 133 59.2 54 22.0 27 8.8 26 10.0 240 2.2 1.3–3.6 0.003
Positive 377 75.7 79 15.4 29 4.5 22 4.4 507 1.0 -
-Self-perceived relationship affected by oral health
Affects 75 58.2 26 22.2 10 6.9 17 12.7 128 2.0 1.5–2.6 0.000
Does not affect 435 72.5 108 16.7 46 5.8 32 5.0 621 1.0 -
-ORr: raw odds ratio
* This table shows only variables with p ≤ 0.20 in the raw analysis.
Table 4. Results for adjusted analysis of severity of malocclusion among adolescents aged from 15 to 19*. Montes Claros, MG, Southeastern Brazil, 2008-2009.
Variable Raw analysis Adjusted analysis
ORr 95%CI p ORa 95%CI p
Demographic characteristics and socioeconomic condition Self-reported skin color
Non-white 1.7 1.2–2.4 0.004 1.5 1.1–2.2 0.041
White 1.0 - - 1.0 -
-Monthly per capita income
Up to R$200.00 1.7 1.1–2.7 0.028 1.5 1.2–2.4 0.040
Over R$200.00 1.0 - - 1.0 -
-Use of dental services and behavior Harmful oral habits
Yes 1.9 1.2–3.1 0.009 1.7 1.1–2.9 0.039
No 1.0 - - 1.0 -
-Oral health subjective condition
Self-perceived appearance of teeth or gums
Negative 2.2 1.3–3.6 0.003 1.8 1.1–3.1 0.026
Positive 1.0 - - 1.0 -
-Self-perceived relationship affected by oral health
Affects 2.0 1.5–2.6 < 0.001 1.4 1.1–2.1 0.047
Does not affect 1.0 - - 1.0 -
-ORr: raw odds ratio; ORa: adjusted odds ratio
DISCUSSION
Malocclusion prevalence in the investigated population was 30.4%, and chances of greater severity of malocclusion were higher among socially disadvantaged adolescents who reported having harmful habits and self-perceived compromised aesthetics and social relationship. Regarding the application of health public policy, the epidemiological information presented in this study is useful to adequately prioritize and allocate the necessary resources to provide adolescents with orthodontic treatment.
Despite the methodological rigor of project SB-MOC14, the cross-sectional design of this
study did not allow an evaluation of causal relations between severity of malocclusion and the factors investigated. A further limitation concerns the sampling process in the rural area, which excluded households outside a 500-meter range from an institution of reference, which may have produced a selection bias, given that 500 m is not a considerable distance in rural areas. his may be the reason for the low percentage (0.4) of adolescents from the rural area in the sample. herefore, it is prudent to assume that this sample is only representative of the population of adolescents in the urban area of Montes Claros.
We observed a predominance of adolescents with no abnormality or slight malocclusion, followed by those with deined, very severe and severe malocclusion, who require elective, essential and highly necessary orthodontic treatment, respectively. hese results are similar to those found in India16 and in the 2010 Brazilian epidemiological surveyb.
Crowding (41.8%) and molar relationship (43.7%) were the most prevalent DAI components. Diferent results were found in Hungary10, where the most prevalent alterations were
maxillary irregularity (56.7%), mandibular irregularity (41.8%), and maxillary overjet (60.8%). Approximately 20.0% of adolescents presented maxillary overjet, similar to indings in Lima, Peru4, and Recife, in the state of Pernambuco12. Most (99.6%) of the adolescents examined did
not present mandibular overjet, similar to the indings in Hungary10. Expressive prevalence
was also observed in spacing in the anterior segment (19.2%) and midline diastema (19.5%), corroborating a previous study. Maxillary and mandibular irregularity afected 22.6% and 24.8% of adolescents, respectively, which are inferior to percentages reported in studies with adolescents in Lima, Peru4, and Hungary10.
The prevalence of different types of malocclusion observed in this study and in the literature shows wide variability in indings, indicating the need to analyze locally the diferent treatment requirements of populations. Such variability is possibly related to the multifactorial etiology of malocclusions8 or derived from the diferent measurement
instruments adopted to characterize the malocclusions18.
he higher probability of severity of malocclusion among adolescents self-reporting as non-white had previously been in reported in Brazil18. his association might be caused by the
inferior socioeconomic conditions of these ethnic groups compared to the white population of Brazilian society3. Youngsters with lower per capita income also presented more chances
of higher severity of malocclusion when compared to those with higher per capita income, an association previously observed in another Brazilian survey18. However, Brazilian research
evaluating the inluence of socioeconomic factors in malocclusion is still scarce.
A complex interrelation among the social factors of oral health seems to exist. Socioeconomic conditions indirectly inluence severity of malocclusion by inluencing other factors, such as level of education, behavior patterns and access to food, oral hygiene products, and health services, especially orthodontic treatment.
Individuals reporting harmful oral habits showed higher chances of being in a category of greater severity of malocclusion, regardless of demographic characteristics and socioeconomic conditions. Among harmful oral habits, paciier and thumb sucking may cause malocclusions, since they can alter the normal development of the stomatognathic system, due to an imbalance between external and internal muscle strenght6. In this survey, 41.2% b Ministério da Saúde. Secretaria
of adolescents reported having one or more kinds of harmful oral habits at some moment of their lives, the most reported being nail biting and paciier or thumb sucking (23.8% and 14.8%, respectively).
In line with the indings of a previous study5, adolescents perceiving their appearance as
very bad/bad and average showed higher chances of greater severity of malocclusion, as did those perceiving their relationships as afected by oral health conditions. We did not observe any association between severity of malocclusion and self-perceived chewing or speech, suggesting that the malocclusions did not have a perceived functional impact for adolescents. hese indings suggest a tendency in individuals to relate malocclusion more closely to aesthetics than functional problems17,20. It is likely that individuals with
malocclusion problems perceived their relationships afected by oral health conditions for being considered less socially attractive, given that, for adolescents, oral aesthetics plays an important role in self-image and social relationships.
Malocclusion was signiicantly prevalent in the investigated population, and approximately one third of the adolescents showed a need for orthodontic treatment. he malocclusions were associated to variables related to social disadvantage, harmful habits, self-perceived negative appearance, and self-perceived compromised social relationships. Public services in northern Minas Gerais do not ofer orthodontic treatment to the population, which evidences problems of access to malocclusion treatment by adolescents whose families are unable to aford the high costs of such treatment in private dental clinics. Consequently, these youngsters may face diiculties of social integration, since malocclusions may represent a social disadvantage for those with no access to treatment. It is essential to improve public policy for the inclusion of orthodontic treatment among health care provided to this segment of the population, particularly among individuals of lower socioeconomic status.
REFERENCES
1. Abreu MNS, Siqueira AL, Caiaffa WT. Regressão logística ordinal em estudos epidemiológicos. Rev Saude Publica. 2009;43(1):183-94. DOI:10.1590/S0034-8910200900010025
2. Alves JAO, Forte FDS, Sampaio FC. Condição socioeconômica e prevalência de más oclusões
em crianças de 5 e 12 anos na USF Castelo Branco III- João Pessoa/Paraíba.Rev Dental Press
Ortodon Ortop Facial. 2009;14(3):52-9. DOI:10.1590/S1415-54192009000300008
3. Bastos JL, Peres MA, Peres KG, Dumith SC, Gigante DP. Diferenças socioeconômicas entre autoclassificação e heteroclassificação de cor/raça. Rev Saude Publica. 2008;42(2):324-34. DOI:10.1590/S0034-89102008005000005
4. Bernabé E, Flores-Mir C. Orthodontic treatment need in Peruvian young adults evaluated though Dental Aesthetic Index. Angle Orthod. 2006;76(3):417-21.
5. Borges CM, Peres MA, Peres KG. Associação entre presença de oclusopatias e insatisfação com a aparência dos dentes e gengivas: estudo com adolescentes brasileiros. Rev Bras Epidemiol. 2010;13(4):713-23. DOI:10.1590/S1415-790X2010000400015
6. Cavalcanti AL, Bezerra PKM, Moura C. Aleitamento natural, aleitamento artificial, hábitos de sucção e maloclusões em pré-escolares brasileiros. Rev Saude Publica. 2007;9(2):194-204.
7. Costa JFR, Chagas LD, Silvestre RM, organizadores. A política nacional de saúde bucal do Brasil: registro de uma conquista histórica. Brasília (DF): Organização Pan-Americana da Saúde; 2006. (Série técnica Desenvolvimento de sistemas e services de saúde. vol. 11).
8. Emerich A, Fonseca L, Elias AM, Medeiros UV. Relação entre hábitos bucais, alterações
oronasofaringianas e mal-oclusões em pré-escolares de Vitória, Espírito Santo, Brasil. Cad Saude Publica. 2004;20(3):689-97. DOI:10.1590/S0102-311X2004000300005
9. Frias AC, Antunes JLF, Junqueira SR, Narvai PC. Determinantes individuais e contextuais da prevalência de cárie dentária não tratada no Brasil. Rev Panam Salud Publica. 2007;22(4):279-85. DOI:10.1590/S1020-49892007000900008
11. Luiz RR, Costa AJL, Nadanovsky P. Epidemiologia e bioestatística na pesquisa odontológica. São Paulo: Atheneu; 2005.
12. Marques CR, Couto GB, Orestes CS. Assessment of orthodontic treatment needs in Brazilian schoolchildren according to the Dental Aesthetic Index (DAI). Community Dental Health. 2007;24(3):145-8.
13. Martins AMEBL, Silveira MF, Freitas CV, Eleutério, NB, Oliveira PHA, Ferreira RC. Desafios de um exercício de calibração para estudo epidemiológico envolvendo variáveis quantitativas e categóricas ordinais: um exemplo. Arq Odontol. 2011;47(4):196-207.
14. Martins AMEBL, Guimarães ALS, Paula AMB, Pires CPAB, Haikal DS, Silva JM et al. Levantamento epidemiológico das condições de saúde bucal da população de Montes Claros – MG - Projeto SBMOC. Rev Unimontes Cient. 2012;14(1):3-14.
15. Martins AMEBL, Santos-Neto PE, Batista, LHS, Nascimento JE, Gusmão AT, Eleutério NB et al. Plano amostral e ponderação pelo efeito de desenho de um levantamento epidemiológico de saúde bucal. Rev Unimontes Cient. 2012;14(1):15-29.
16. Michel-Crosato E, Biazevic MGH; Crosato E. Relação entre maloclusão e impactos nas atividades diárias: um estudo de base populacional. Rev Odontol. 2005;34(1):3-42.
17. Peres KG, Barros AJD, Anselmi L, Peres MA, Barros FC. Does malocclusion influence the adolescent’s satisfaction with appearance? A cross-sectional study nested in a Brazilian birth cohort. Community Dent Oral Epidemiol. 2008;36(2):137-43. DOI:10.1111/j.1600-0528.2007.00382.x
18. Peres KG, Frazão P, Roncalli AG. Padrão epidemiológico das oclusopatias muito graves em adolescentes brasileiros. Rev Saude Publica. 2013;47(supl 3):109-17. DOI:10.1590/S0034-8910.2013047004366
19. Peres SHCS, Carvalho FS, Carvalho CP, Bastos JRM, Lauris JRP. Polarização da cárie dentária em adolescentes, na região sudoeste do estado de São Paulo, Brasil. Cien Saude Coletiva. 2008;13(Supl 2):2155-62. DOI:10.1590/S1413-81232008000900020
20. Peres KG, Traebert ESA, Marcenes W. Diferenças entre autopercepção e critérios normativos na identificação das oclusopatias. Rev Saude Publica. 2002;36(2):230-6. DOI:10.1590/S0034-89102002000200016
Funding: Fundação de Amparo à Pesquisa do Estado de Minas Gerais (FAPEMIG – Process BIP-0792-501/2007). Author’s Contribution: Study design and planning: MFS, AMEBLM, and LFM. Data analysis and interpretation: MFS, RFS, and MON. Manuscript drafting: MFS, RFS, and MON. Critical review of the manuscript: MFS, AMEBLM, and LFM.