STATISTICAL ANALYSIS ON THE
PERFORMANCE OF ENGINE WITH
JATROPHA OIL AS AN ALTERNATE
FUEL
V.R. Sivakumar, V.Gunaraj, P.Rajendran
Department of Mechanical Engineering, RVS College of Engineering and Technology,
Coimbatore- 641032, India.
V.Vel Murugan
Sri Sakthi Engineering College Karamadai, Coimbatore - 641105, India.
ABSTRACT
The rapid depletion in world petroleum reserves and uncertainty in petroleum supply due to political and economical reasons, as well as, the sharp escalation in petroleum prices, have stimulated the search for alternatives to petroleum based fuels specifically diesel and gasoline. Moreover, bulks of petroleum fuels are being consumed by agriculture and transport sector for which diesel engine happens to be the prime mover. Vegetable oils - due to their properties being close to diesel fuel may he a promising alternative for its use in diesel engine, But, their high viscosity prevents them from using it directly in an engine. Present investigation focuses on the use of Jatropha curcas seed based oil as fuel in diesel engine by blending it with diesel for dilution of viscosity and preheating it for reduction of viscosity.
Performance tests were conducted on a single cylinder diesel engine and 'important characteristics of the engine such as Brake Thermal Efficiency (BTE) and Specific fuel consumption (SFC) have been evaluated. In this study, the statistical experimental method of four-factors, five-level factorial central composite rotatable design has been used to develop mathematical models to correlate fuel parameters with specific fuel consumption and Brake Thermal Efficiency of an engine. Direct and interaction effects of fuel parameters on engine performance were analyzed and presented in the graphical form. Further, these mathematical models help to optimize the engine performance. From the test results it has been established that 20% of jatropha oil blend with preheating to a maximum temperature of 47 0C can be a better substitute for diesel without any engine modification.
Keywords: Mathematical Models. Central Composite rotatable Design, Jatropha curcas oil Brake thermal Efficiency. Specific fuel consumption
INTRODUCTION
The high viscosity is due to the large molecular mass and chemical structure of vegetable oils, which in turn leads to problems in pumping, combustion and atomization in the injector systems of a diesel engine. Due to the high viscosity, in long term operation, vegetable oils normally introduce the development of gumming, the formation of injector deposits, ring sticking, as well as incompatibility with conventional lubricating oils. Therefore, a reduction in viscosity is of prime importance to make vegetable oils a suitable alternative fuel for diesel engines. The problem of high viscosity of vegetable oils has been approached in several ways [6] such as
Preheating the oils,
Blending or dilution with other fuels, Trans- esterification
Thermal cracking / pyrolysis
In this investigation Jatropha curcas oil, blended up to 20% with diesel by volume basis and preheated and is used as diesel alternative. Performance tests on single cylinder diesel engine was carried out to study the effects of engine and oil parameters on Brake Thermal Efficiency and specific fuel consumption. In this experimental work, statistical method is used to develop mathematical models to establish a relationship between important engine and fuel parameters namely. Blend (B). Load (L). Speed (S) preheated temperature (T) Brake Thermal Efficiency (BTE) and Specific fuel consumption (SFC).
With a view to achieve the above mentioned aim and to obtain the required information about the main and interactive effects of engine and oil parameters on specific fuel consumption and Brake Thermal Efficiency, experiments based on central composite rotatable design were conducted [7,8]. These developed models are very useful to determine quantitatively the Brake Thermal Efficiency and Specific fuel consumption.
1. Single Cylinder Test Engine 2. Electrical Dynamometer 3. Jatropha Diesel Blend Tank 4. Burette
5. Test Bed 6. Air Tank
7. Dynamometer Panel 8. Exhaust Pipe
9. Emission Analyzer Probe 10. NOx/CO Analyzer 11. Stop Watch 12. Water Flow meter 13. RPM Indicator
14. Coolant Temperature indicator 15. Lube oil temperature indicator 16. Exhaust temperature indicator 17. Air flow meter
EXPERI MENTAL WORK
The experiments were conducted on an AVI Kirlosker naturally aspirated direct Injection single cylinder water cooled diesel engine coupled with electrical dynamometer. The tests were carried out on the above engine with jatropha diesel blends as fuel and the total fuel consumption [TFC], Speed [S] and load [L] were measured. The experimental set-up employed in the investigation is shown in Fig. 1.
PLAN OF INVESTIGATION
Identify the important engine and fuel parameters.
Find the upper and lower limits of the engine and fuel parameters. Develop the design matrix.
Conduct the experiments as per the design matrix.
Record the responses, viz. Brake Thermal Efficiency (BTH) and Specific fuel consumption (SFC). Develop the mathematical model.
Test the significance of the coefficients, recalculating the value of the significant coefficients and arriving at the final mathematical model.
Test the adequacy of the mathematical model. Validate the mathematical model.
Results and discussion
Identification of the Parameters
The following independently controllable engine and fuel parameters were identified to carry out the experiments: Blend (B). Speed (S), load (L) and preheated temperature (T) are considered
Table. 1 Engine and fuel parameters and their limits
Engine and fuel
parameters Units Notations
Limits
-2 -1 0 +1 +2
Blend % B 0 5 10 15 20
Load KW L 0 0.92 1.84 2.76 3.68
Speed RPM S 1400 1500 1600 1700 1800
Preheated Temperature 0C T 35 38 41 44 47
Finding the Limits of the Fuel and Engine Parameters
The limits of the oil parameters Blend (B) and preheated temperature (T) have been fixed from the previous literature [10] available. The properties of the Jatropha diesel blend up to 20% (Table.1) and preheated temperature of 35° C to 47°C are enough to run the engine [6]. The limits of the engine parameters, load and speed have been fixed from the engine specifications. The upper limit of the engine parameters was coded as +2 and the lower limit as -2. The coded values for intermediate values were calculated from the following relationship:
max min
max min
2
(
)
2
i
X
X
X
X
X
X
Where X, is the required coded value of a variable Xi and X is any value of the variable from X minto X max
Developing the Design Matrix
A five-level, four-factors, central composite rotatable factorial design |X], consisting of 31 sets of coded conditions is shown in Table 3. The design matrix comprises a full replication factorial design 23 [=8] plus six star points and six center points. All fuel and engine parameters at the intermediate level (0) constitute center points and combinations at either it’s lowest (-2) or highest (+2) level with the other ' two parameters at the intermediate level constituting the star points. Thus the 31experimental runs allowed the estimation of the linear, quadratic and Two-way interactive effects of the process parameters on Brake Thermal Efficiency and specific fuel consumption.
Table. 2 Comparison of properties of jatropha oil with diesel fuel.
S.No. Characteristic 5%
Blend 10% Blend 15% Blend 20% Blend
High Speed Diesel IS 1460-2000 1. Acid value (Including FFA) 0.07 0.09 0.12 0.17 0.20 2. Specific gravity at 27°C 0.8459 0.8491 0.8504 0.8531 0.82-0.86 3. Calorific Value Cal /gm 10690 10629 10568 10445 10750
4. Flash point °C 39.4 40.4 41.3 43.3 35
5. Kinematic Viscosity 4 4.6 5.29 6.4 2.0-5.0
Conducting the Experiment as per the Design Matrix
The experiments were conducted as per the design matrix at random, to avoid the possibility of systematic errors infiltrating the system. The Blends (B) of jatropha oil with diesel were prepared on the proportion of 0%. 5%. 15% and 20% on volume basis, Load (I.) is measured on ammeter and voltmeter. Speed (S) is measured by non contact type digital RPM meter. Preheated Temperature (T) is measured by digital thermometer and Total fuel consumption [TFC] is measured by measuring time taken for 10cc fuel consumption. In this table, for experimental runs 25 to 31, even though the experimental setup and all testing conditions remain the same, the responses vary slightly. This is due to the effect of unknown and unpredictable variables called noise-factors, which crept into the experiments. To account for the impact of these unknown factors on the response, replicated runs (25 -31) were included in the design matrix
Recording the Responses
The responses Brake Thermal Efficiency and specific fuel consumption were calculated from the measured values,
Brake Thermal Efficiency is the ratio of energy in brake power to the input fuel energy in appropriate units. Specific fuel consumption is the fuel-flow per brake power produced.
Brake Thermal Efficiency (BTE) = BP/ FP Specific Fuel Consumption (SFC) = TFC/BP Where BP - Brake power = [V * I * ηGenerator] /1000
FP - Fuel power = (TFC) * [Calorific Value of the fuel]
The calculated values of Brake Thermal Efficiency and specific consumption are tabulated in table 3.
Table.3. Design matrix and observed values of Brake Thermal Efficiency and Specific fuel consumption
S.No Fuel and engine parameters Brake Thermal Efficiency
%
Specific Fuel Consumption Kg/KW-hr
B L S T
1 - 1 -1 -1 -1 13.13 0.66
2 +1 -1 -1 -1 13.02 0.67
3 - 1 +1 -1 -1 26.00 0.33
4 +1 +1 -1 -1 26.55 0.33
5 -1 -1 +1 -1 11.41 0.76
6 +1 -1 +1 -1 11.12 0.79
7 -1 +1 +1 -1 20.55 0.42
8 +1 +1 +1 -1 20.33 0.43
9 -1 -1 -1 +1 12.79 0.68
10 +1 -1 -1 +1 12.27 0.71
11 -1 +1 -1 +1 25.81 0.34
12 +1 +1 -1 +1 24.56 0.36
13 -1 -1 +1 +1 11.12 0.78
14 +1 -1 +1 +1 10.87 0.80
15 -1 +1 +1 +1 21.89 0.40
16 +1 +1 +1 +1 20.52 0.43
17 -2 0 0 0 21.12 0.40
18 +2 0 0 0 19.75 0.45
19 0 -2 0 0 0.00
20 0 +2 0 0 28.60 0.31
21 0 0 -2 0 26.70 0.33
22 0 0 +2 0 17.65 0.49
23 0 0 0 -2 20.79 0.42
24 0 0 0 +2 20.39 0.43
25 0 0 0 0 17.97 0.49
26 0 0 0 0 20.46 0.43
27 0 0 0 0 18.96 0.46
28 0 0 0 0 19.95 0.44
29 0 0 0 0 20.07 0.43
30 0 0 0 0 21.00 0.44
Developing the Mathematical Model
The response function representing Brake Thermal Efficiency and specific fuel consumption can be expressed as BTE/SFC = f (B, L, S, T). The relationship selected being a second-order response surface. The function is as follows.
BTE/SFC = bo + b1 B + b2 L + b3 S + b4T+ b12BL + b 13 B Sb!4 B T+ b23 L S + b24LT + b34 S T + b11 B2 +
B22 L2 + b33S2 + b44T2 (1)
Quality America -DOE PC IV. Software package [7] was used to calculate these coefficients. The mathematical model thus developed follows:
BTE = l9.793 - 0.258B + 6.l53L - l.851S - 0.128T - 0.13IB2 - 1.665L2 + 0.303S2 - 0.094T2 0.07BL
-0.049BS - 0.208BT - 0.809LS + 0.061LT + 0.266ST (2)
SFC = 0.464 + 0.01 B - 0.I71L + 0.043S + 0.006T + 0.004B2 + 0.055L2 + 0S2 -0.004T2 - 0.001BL + 0.003BS
+ 0.003BT - 0.005LS - 0.005LT - 0.006ST (3)
Testing the Significance of the Coefficients
The values of the coefficients give an idea to what extent the process parameters affect the responses quantitatively. Insignificant coefficients were dropped along with the parameters with which they are associated, without affecting the accuracy of the model very much, this was carried out by conducting backward elimination analysis with t — probability criterion kept at 0.55 [Ref. 7]. The significant coefficients were recalculated and the final mathematical model was developed using only these significant coefficients. The final mathematical model as determined by the above analysis is represented in the-following:
BTE = 19.585-0.258B+6.153L-l.851S-1.644L2 +0.325S2-0.809LS+0.266ST (4)
SFC = 0.472+0.010B-0171L+0.043S+0.055L2 (5)
Checking the Adequacy of the Model Developed
The adequacy of the model was tested using the analysis of variance techniques (ANOVA). As per this technique [8],
1) The calculated value of the F-ratio of the model developed should not exceed the standard tabulated value of F-ratio for a desired level of confidence (say 95%). and
Table 4. Calculation of variance for testing the adequacy of the Model
Parameter Factors df
Lack of Fit (SS) Df Error Terms (SS)
df F
ratio R ratio Whether the model is adequate Brake thermal efficiency (BTE)
1091.442 14 31.630 10 6.141 6 3.091 76.173 Adequate Specific fuel
consumption (SFC)
0.839 14 0.039 10 0.008 6 3.037 46.270 Adequate
F - Ratio = MS - l.ack of fit / MS - pure error R- Ratio = MS - factors / MS - pure error, Where. MS Mean Square - SS/df.
SS Sum of squares df - Degrees of freedom
F - Ratio (10,6,0.05)=4.06 and R - ratio (14,6,0.05)= 3.96
Validation of Mathematical Model
Validity of the developed models was tested by drawing scatter diagrams that show the observed and predicted values of Brake Thermal Efficiency and specific fuel consumption. Representative scatter diagrams are shown in figures 2 and 3. To determine accuracy of the model conformity test runs were conducted. For these runs, engine and fuel parameters were assigned some intermediate values within their limits. A comparison was made between actual and predicted values. The result shows that the model accuracy is above 95%.
S. No
Parameters in coded form
Actual values of responses
Predicted values of
responses Error %
B L S T BTE SFC BTE SFC BTE SFC
1 1.S 1 1 1 20.85 0.416 20.09 0.423 3.6: -1.72
2 -1 1 1 -2 20.98 0.410 20.10 0.429 4.17 -4.71
3 -2 2 1 -1 21.87 0.3X9 21.56 0.370 1.39 4.72
4 -1.5 l 1.5 2 22.19 0.384 21.41 0.389 3.54 -1.53
5 2 1 0 0 23.10 0.382 23.21 0.387 -0.50 -1.54
RESULTS AND DISCUSSIONS
The final mathematical model developed can be used to predict the Brake Thermal Efficiency and specific fuel consumption by substituting the values of the respective engine and oil parameters. Also required combination of values of the-engine and oil parameters can be determined by substituting the values of Brake Thermal Efficiency and specific fuel consumption values. The effect of engine and oil parameters on Brake Thermal Efficiency and specific fuel consumption were determined quantitatively using models and are represented in graphs figure (4-19). These graphs show generally convincing trends between cause and effect. The direct effects and interaction effects are discussed in the following subtopics. ,
Direct Effects
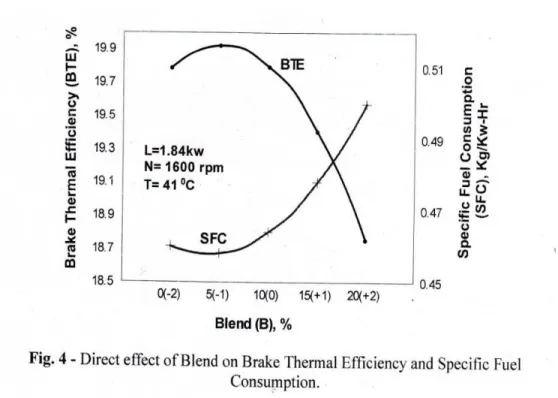
Direct effect of Blend on Brake Thermal Efficiency and specific fuel consumption
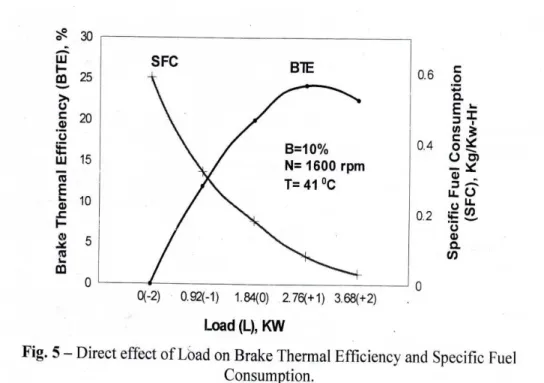
Direct effect of Load on Brake Thermal Efficiency and specific fuel consumption.
Fig. 5 represents the direct effect of Load (L) on Brake Thermal Efficiency (BTE) and specific fuel consumption (SFC). From the figure it is clear that the BTE increases from zero percent at no load, reaches maximum at optimum load and then starts decreasing. The SFC value decreases from infinite at no load to minimum at the maximum load. The above trend is the common trend for an IC engine using diesel as the fuel and the same trend is registered here also
Fig 6 represents the direct effect of speed (S) on Brake Thermal Efficiency (BTE) and specific fuel consumption (SFC). From the figure it is clear that the BTE is having negative trend and SFC is having positive trend. As speed increases the lesser time available for combustion produces improper combustion, hence the fuel power decreases as speed increases. As fuel power decreases for the same load the BTE decreases and hence SFC increases.
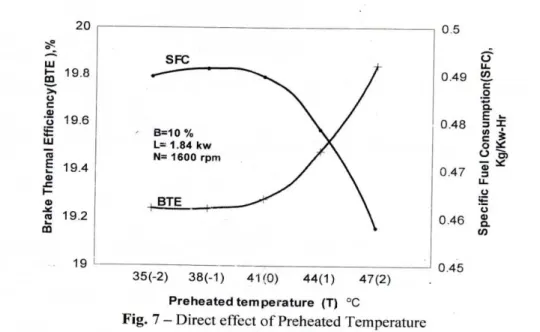
Direct effect of Pre heated Temperature on Brake Thermal Efficiency and specific fuel consumption.
Fig 7 represents the direct effect of preheated temperature (T) on Brake Thermal Efficiency (BTE) and specific fuel consumption (SFC). From the figure it is clear that the BTE is having positive trend and SFC is having negative trend. As T increases the combustion properties of the blend improves [6] and hence for the same load (output) and speed, fuel power required (input) decreases and hence the BTE increases. For the same power, speed and blend, as combustion properties improves with increase in T |6|, the total fuel consumption decreases and hence the SFC also decreases. In both the cases the trend is almost constant at lower level and then varies. This may be due to the improvement in the combustion properties in the lower level (-2 level) of preheating is not significant compared to the higher level (+2 level) of preheating.
Interaction effects
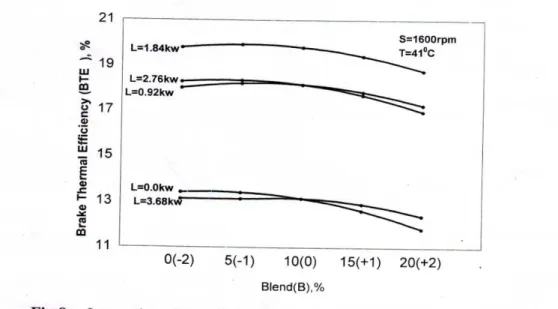
Interaction Effect of Blend and i.oad on Brake Thermal Efficiency
Figure 8 represents the interaction effect of Blend (B) and Load (L) on the Brake Thermal Efficiency (BTE). From the Figure, it is clear that for all loads. BTE is having almost same trend against blend. The BTE is maximum when the load is at middle value (1.84 kW) and blend at middle value (10% Blend). However the BTE decreases at extreme levels of both B and L.
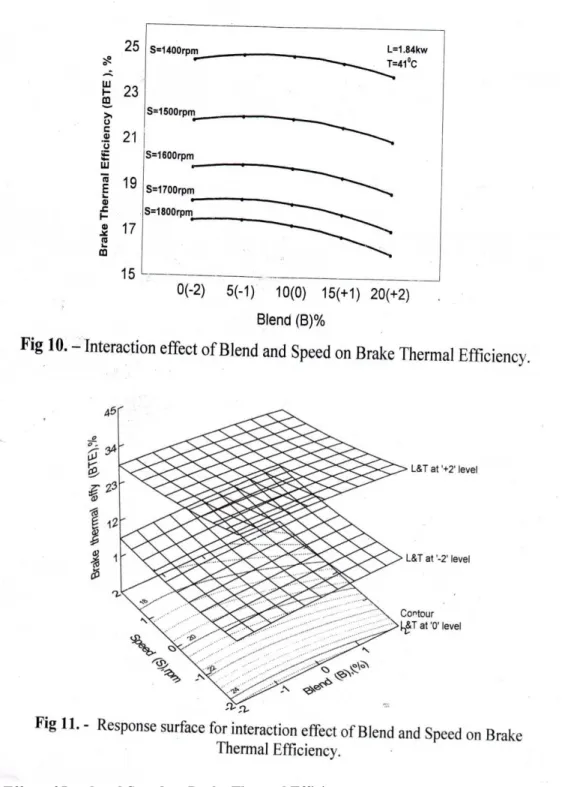
Interaction Effect of Blend andSpeed onBrake Thermal Efficiency
speed (S=1400 rpm). The decrease in BTE with respect to speed at lower level of B (-2level) is about 17%. But this value is going on increases steadily with the increase in B and is about 24% at higher level of B (+2 level).
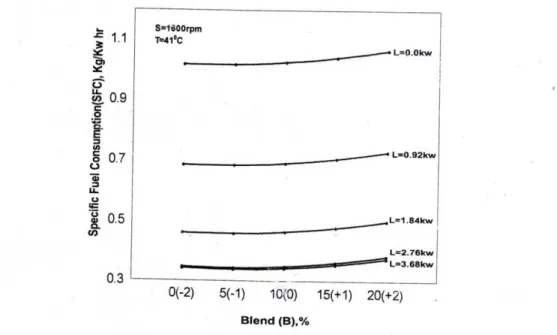
These effects are further explained with the help of a response surface plot, as shown in figure 11. It is evident from the contour surface BTE is maximum (about 26%) when B at middle level (0 level) and S are at (-2 level).
Interaction Effect of Load and Speed on Brake Thermal Efficiency
in BTE decreases with the increase in load and become almost constant at higher level (-2) of loads. The decrease in BTE with increase in S is about l% at lower level of load, but this value is 14% at higher level of load.
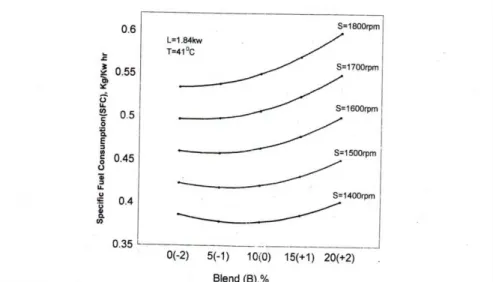
Interaction Effect of Blend and Load on Specific fuel consumption.
Figure 14 represents the interaction effect of Blend (B) and Load (L) on specific fuel consumption (SFC). From the figure it is clear that irrespective of loads the Blend is having a exactly the same effect on SFC. Similarly for all the Blends the effect of load on SFC is exactly the same.
Interaction Effect of Blend and Speed on Specific fuel consumption.
Figure 16 represents the interaction effect of Blend (B) and Speed (S) on Specific fuel consumption (SFC). From the figure it is clear that at all speeds the SFC increases with the increasing in blend. However this increase is about 0.02 kg/kw-hr at lower speeds (-2 level) and is about 0.065 kg/kw-hr at higher speeds (+2 level). The increase in SFC with the increase in speed is less, (about 0.15 hr) at lower blends (-2) and is more (about 0.2 kg'/kw-hr) at higher blends (-2 level)
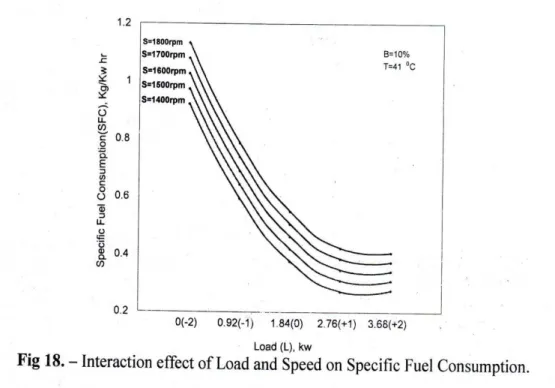
Interaction Effect of Load and Speed on Specific fuel consumption.
Figure 18 represents the interaction effects of the Load (L) and (S) Speed on specific fuel consumption. From the figure it is clear that irrespective of loads the speed is having a exactly the same effect on SFC. Similarly for all the speeds the effect of load on SFC is exactly the same.
CONCLUSION
The conclusions below were arrived at from this investigation
1. The second-order quadratic mathematical models are useful in predicting Brake Thermal Efficiency and specific fuel consumption.
2. The blend is having negative trend on Brake Thermal Efficiency. The break thermal efficiency decreases from 20% to 18.7% for the increase in blend from 0% to 20%.
3. The preheated temperature is having positive trend on break thermal efficiency. The Brake Thermal Efficiency increases about 1% for the increase in preheated temperature of about 12%.
4. The preheated oil temperature is having negative trend on specific fuel consumption
5. The increase in specific fuel consumption with the increase in blend has to be carefully dealt in practical cases while using the jatropha blend as the fuel in IC engine.
REFERENCES
[1] Ali,Y., and Hanna M.A., 1994. Alternative Diesel Fuels from Vegetable Oils, Bio resource Technology. 50. 153-163
[2] Knothe,. G.H., Dunn, R. O. 2005. Biodiesel: An Alternative Diesel Fuel from Vegetable Oils Or Animal Fats. In: Erhan, S., Editor. Industrial Uses of Vegetable Oils. 4. 42-89
[3] Bagby. M O, B. Freedman, and A. W. Schwab 1987. Seed Oils for Diesel Fuels: Sources and Properties, ASAE Paper No. 87-1583. 15-18. [4] Harrington KJ. 1986. Chemical and physical properties of vegetable oil esters and their effect on diesel fuel performance. Biomass 9.1 -17. [5] Masjuki H. Salit. 1993, Biofuel as diesel fuel alternative: an overview, Journal o f Energy Heat Mass Transfer. 15. 293-304
[6] K.Pramanik, 2003, Properties and use of jatropha curcas oil and diesel fuel blends in compression ignition. Renewable Energy 28,239-248. [7] DOE — PC IV.1998. Software reference manual. Quality America. Inc.
[8] Cochran. W. G., and Cox G. M. 1963. Experimental Designs. India. Asia Publishing House.
[9] Kumar M Senthil. Kamesh A. & Nagalingam B.2003.An experimental comparison of methodsto use methanoland Jatropha oil in a compression ignition engine. Biomass-and-Bioenergy. 25 (3) 309-328.
[10] Barsic, N.J., and A. L. Humke. I981. Vegetable oils: diesel fuel supplements. Automotive Engineering 89(4): 37-41.
[11] Harrington. K. J.. !986, Chemical and Physical Properties of Vegetable Oil Esters and their Effect on Diesel Fuel Performance. 9, 1-17. [12] Jacobus. M. J., S. M. Geyer. S.S. Lestz, W.D. Taylor, and T.H. Risby. 1983. Single-cylinder Diesel Engine Study of four Vegetable Oils,
SAC Paper 831743.
[13] Peter GB Vadamuthu. 2004. Evaluation and testing of curcas SRO as an extender of diesel- Research report, Ministry of non-conventional energy. Delhi.
[14] N. Vijaya Raju. G. Amba Prasad Rao and P.Ramamohan. 2000, Esterified Jatropha Oil as a Fuel in Diesel Engines. Proceedings of the 14th