by Harold Tobin, Masataka Kinoshita, Juichiro Ashi, Siegfried Lallemant,
Gaku Kimura, Elizabeth Screaton, Moe Kyaw Thu, Hideki Masago,
Daniel Curewitz,
and IODP Expeditions 314/315/316 Scientiic Party
NanTroSEIZE Stage 1 Expeditions 314, 315, and 316:
First Drilling Program of the Nankai Trough
Seismogenic Zone Experiment
doi:10.2204/iodp.sd.8.01.2009
Introduction
Integrated Ocean Drilling Program (IODP) Expeditions 314, 315, and 316 were carried out as a unified program of drilling collectively known as Stage 1 of the Nankai Trough Seismogenic Zone Experiment, or NanTroSEIZE, the first multi-stage complex drilling project in IODP and the most ambitious effort in scientific ocean drilling to date (Tobin and Kinoshita, 2006b; Kinoshita et al., 2006). The first of four planned operational stages, the Stage 1 expeditions were conducted aboard the new riser-capable drilling vessel
Chikyu from September 2007 to February 2008, and were
Chikyu’s inaugural IODP expeditions. Seventy-one scientists
from twelve countries took part in the three expeditions as shipboard participants, and thirty-three holes in total were drilled at eight sites, to as much as 1400 meters below the sea floor (Table 1, Fig. 1).
In the region offshore the Kii peninsula of Honshu, Japan, a transect of eight sites was drilled using riserless methods, targeting the accretionary complex in the
frontal thrust region, the midslope mega-splay fault region, and the Kumano forearc basin region. Two of these sites were preparatory pilot holes for planned later deep-riser drilling operations, while the others targeted fault zone material at relatively shallow sub-bottom depth, where the faults were presumed to be aseismic. Expedition 314 was dedicated to in situ measurements of physical properties and borehole imaging through logging-while-drilling (LWD) in holes dedicated to that purpose. Expedition 315 was devoted to core sampling and downhole temperature measurements at one site in the mega-splay region and at another in the Kumano forearc basin. Expedition 316 targeted the frontal thrust fault and so-termed “mega-splay” (Tobin and Kinoshita, 2006a; Moore et al., 2007) fault region in the mid-slope environment. The initial scientific results on accretionary complex and fault zone structure, lithology and age, physical properties, and state of stress are summa- rized here and unified across the expeditions.
This article provides only an overview of the Stage 1 ship-board results; for the comprehensive results, please consult the IODP Expedition Report (Kinoshita et al., 2009) and the individual expedition summaries and site chapters therein.
Background and Objectives
The Nankai Trough subduction zone forearc is among the most intensively studied seismogenic and tsunamigenic plate boundary zones in the world, including previous DSDP and ODP drilling transects off Shikoku island southwest of the NanTroSEIZE study area. In the NanTroSEIZE transect, the offshore region exhibits a well-developed accretionary prism and forearc basin (Kumano basin), as well as a major thrust fault that splays from the deep plate interface at about 10 km depth beneath the Kumano basin and bisects the entire overriding prism, termed the “mega-splay” (Park et al., 2002; Moore et al., 2007). Similar mega-splay geome-tries are increasingly being identified in other subduction forearcs. The Nankai Trough in this region is considered a well-coupled megathrust (Wang and Hu, 2006) and exhibits
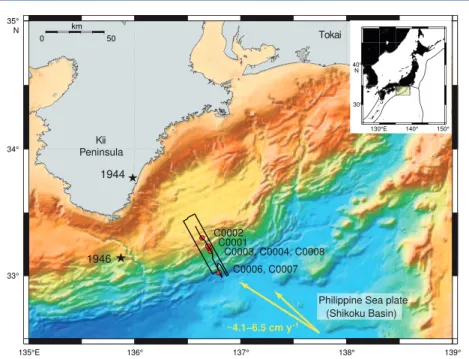
Figure 1. Location of sites drilled during the three expeditions of NanTroSEIZE Stage 1 (red circles) in the Nankai Trough off Kumano, Japan. Black box = location of the 2006 3-D seismic survey, black line = arbitrary line extracted from 3-D seismic volume (Fig. 3), yellow arrows = computed far-field convergence vectors between Philippine Sea plate and Japan (Seno et al., 1993; Heki, 2007). Stars = epicentral location of great earthquakes. Inset shows location of Nankai Trough.
km
Izu
C0002 C0001
C0003, C0004, C0008 C0006, C0007
1944
1946
° 9 3 1 °
8 3 1 °
7 3 1 °
6 3 1 E
° 5 3 1 33° 34° 35° N
Kii Peninsula
Tokai
Izu
Philippine Sea plate (Shikoku Basin)
0 50
Izu
130°E 140° 150° 30°
40° N
Therefore Chikyu Expeditions 314–316 were planned to sample and characterize the sediments and relatively shallow levels of the major fault systems targeted for deep drilling in NanTroSEIZE to characterize fault properties outside the seismogenic zone, and to “pilot” the planned deep riser holes as a preparatory step towards borehole engineering for drilling to unprecedented depths (Tobin and Kinoshita, 2006a). As outlined below, we were successful in achieving a substantial majority of our objectives during Stage 1.
Stage 1 Expedition Strategy
NanTroSEIZE Stage 1 was divided into three individual expeditions, due to its five-month duration. The goals of Stage 1 were to obtain logs, cores, and downhole measure-ments through riserless drilling along the transect of sites (Tobin and Kinoshita, 2006a). Based on extensive past ODP experience of unsuccessful attempts to use wireline logging techniques in unstable accretionary prism environments, logging-while-drilling (LWD) was selected to obtain a com-prehensive suite of logs; Expedition 314 was devoted entirely to LWD drilling of a first hole at each of the planned sites. Logging was performed using a state-of-the-art suite of LWD technology and included the measurement of natural gamma radiation, azimuthal gamma ray density, neutron porosity, full waveform sonic velocity, azimuthal resistivity imaging, zero-offset vertical seismic profile, ultrasonic caliper, and annular fluid pressure, though not all logs in this suite were collected at all sites (Kinoshita et al., 2009). The over-arching objective of the LWD program was to provide borehole data no known interplate seismicity. The downgoing
plate exhibited two ~Mw7 thrust and
transpres-sional earthquakes in 2004 (Enescu et al., 2005), suggesting that, in contrast to many outer arc bending regions, this portion of the Nankai Trough’s downgoing plate is in compres-sion.
The NanTroSEIZE project is the first attempt to drill, sample, and instrument the seismo-genic portion of a plate-boundary fault or megathrust within a subduction zone, identi-fied as a very high priority in the IODP Initial Science Plan (2001). The fundamental goal of NanTroSEIZE science plan (Tobin and Kinoshita, 2006b) is to access, sample, and then instrument the faults in aseismic and seismogenic regions of the megathrust system. This involves drilling of key elements of the active plate boundary system at several loca-tions off the Kii Peninsula, from the shallow onset of the plate interface to depths where earthquake slip and locking takes place (Figs. 1, 2). At this location, the plate interface and active mega-splay faults implicated in causing tsunami are accessible to drilling
within the region of coseismic rupture in the 1944 Tonankai (magnitude 8.1) great earthquake (Baba et al., 2006). The final objective is to access and instrument the Nankai plate interface within the seismogenic zone through deep riser drilling, planned for a later stage in NanTroSEIZE.
The primary objectives of NanTroSEIZE Stage 1 were to complete the majority of the riserless coring and logging operations of the NanTroSEIZE transect as a whole—that is, all objectives besides the two planned deep riser-drilled sites into the plate boundary fault systems and the trench reference sites (see box; Tobin and Kinoshita, 2006a, 2006b).
NanTroSEIZE Stage 1 Riserless Drilling Expeditions: September 2007–February 2008
Scientiic Targets
• The frontal thrust system at the toe of the accrtionary wedge
• The mid-wedge megasplay fault system
• 1000 m and 1400 m deep holes, respectively, at the two sites planned for later deep penetrations of the seismogenic zone faults
Expedition Breakdown of Drilling Activities
• Expedition 314: Logging-while-drilling (LWD) only transect of the all prism and forearc basin sites
• Expedition 315: Coring-focused drilling of the mega-splay fault thrust sheet and forearc basin
• Expedition 316: Coring-focused drilling of the shallow (<1000 mbsf) portions of the frontal thrust and mega-splay fault zone
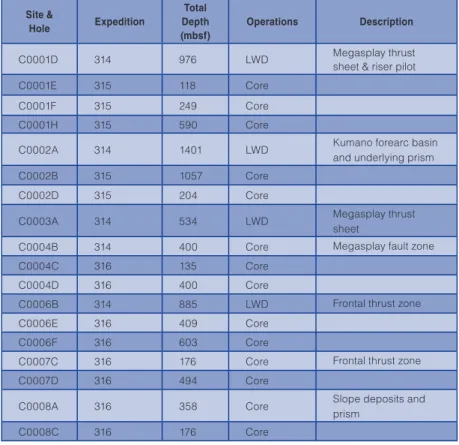
Table 1. Drilling summary for Expeditions 314, 315, and 316 (pilot holes, including Site C0005 where no scientiic drilling was done) and very short penetrations omitted).
Site &
Hole Expedition
Total Depth (mbsf)
Operations Description
C0001D 314 976 LWD Megasplay thrust
sheet & riser pilot
C0001E 315 118 Core
C0001F 315 249 Core
C0001H 315 590 Core
C0002A 314 1401 LWD Kumano forearc basin
and underlying prism
C0002B 315 1057 Core
C0002D 315 204 Core
C0003A 314 534 LWD Megasplay thrust
sheet
C0004B 314 400 Core Megasplay fault zone
C0004C 316 135 Core
C0004D 316 400 Core
C0006B 314 885 LWD Frontal thrust zone
C0006E 316 409 Core
C0006F 316 603 Core
C0007C 316 176 Core Frontal thrust zone
C0007D 316 494 Core
C0008A 316 358 Core Slope deposits and
prism
to be used in conjunction with cores to document the geo-logy, physical properties, mechanical state, fluid content, and stress conditions at the drilling site locations.
After Expedition 314 was completed, the same sites (for the most part) were revisited during Expeditions 315 and 316, in order to collect cores and other downhole measure-ments (e.g., temperature) in adjacent holes (typically 25–50 m away). Due to drilling challenges and other lost-time incidents causing contingency plans to be invoked a number of times, not all sites that were LWD logged were also cored, and vice versa. Multiple attempts to find sites to drill into the mega-splay and frontal thrust fault zones resulted in eight numbered sites drilled (note that at Site C0005, only pilot holes were drilled, and no scientific results were generated before this site was abandoned due to poor drilling conditions), with multiple holes at each one (Fig. 2, Table 1).
Site Descriptions and Results from Three
Tectonic Domains
In this section, the principal results of drilling in each of the three tectonic regions are summarized, beginning with the two sites drilled in the frontal thrust region, moving to the four sites in the mid-slope, mega-splay fault zone region, and finally, the single Kumano basin site. This summary
merges results from the Expedition 314 LWD logging drilling and the Exp. 315 or 316 coring and other measure-ments at each of these sites.
Frontal Thrust Region: Sites C0006 and
C0007
Drilling at Sites C0006 (Expeditions 314 and 316) and C0007 (316 only) allowed examination of the frontal thrust region (Fig. 3). In Hole C0006B, LWD operations success-fully drilled and logged to 885 meters below seafloor (mbsf), crossing the probable frontal thrust zone in the interval 657–711 mbsf (Expedition 314 Scientists, 2009a). The ambiguity exists because of the complex seismic reflectivity character, including apparent trench-fill channel deposit packages, and the lack of coring to this depth to elucidate the detailed structure. At 657 mbsf there is a zone of appar-ent high degree of fracturing/brecciation (based on LWD resistivity images) that is the most likely candidate for the frontal thrust. On Expedition 316, however, Holes C0006E and C0006F did not penetrate to this depth before drilling and coring was stopped because of poor borehole conditions and extremely poor core recovery. Several fault zones within the prism (above the frontal thrust) were penetrated and recovered, identified by concentrations of core-scale structural features, biostratigraphically-identified inver- sions of sediment age, and correlation with seismic reflection Figure 2. [A] Uninterpreted depth section, processed with pre-stack depth migration. [B] Interpreted version. Only a few representative faults are shown; dashed lines indicate less certain fault locations. Morpho-tectonic zones are shown between the two sections. Composite seismic line extracted from 3-D seismic volume, reproduced from Moore et al., (2009). The line crosses through (or near) all Stage 1 drill sites (solid vertical lines); location shown in Fig. 1. Location of planned Stage 3 ultra-deep drilling at Site C0002 is indicated by dashed vertical line. KBEFZ = Kumano Basin edge fault zone; PTZ = Protothrust zone; BSR=Bottom simulating reflection; VE = Vertical exaggeration.
Depth (km)
Inactive décollement Décollement
Thrust in oceanic crust
Subducting sediment
Shikoku Basin sediment Trench sediment
Older accretionary prism Kumano Basin sediments
Mega-splay fault
Slope sediment
PTZ
BSR
Top oceanic crust
BSR BSR
C0002 C0001C0003
C0004 C0008
C0007 C0006
Depth (km)
Forearc basin Mega-splay
fault zone Imbricate thrust zone
KBEFZ Frontal thrust zoneTrench
NW SE
10 9 8 7 6 5 4 3 2
11
10 9 8 7 6 5 4 3 2
11
A
B
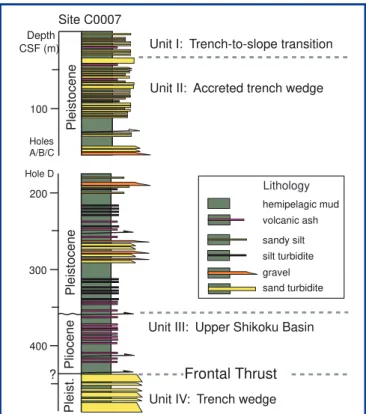
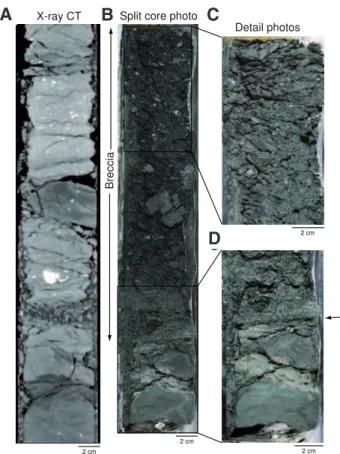
ranging from breccia to fault gouge was recovered (Expedition 316 Scientists, 2009b). The lowermost part of Fault Zone 3 at 438 m core-based depth below seafloor (CSF) is intensely brecciated into fragments ~1–10 mm in size (Fig. 5). This 29-cm-thick breccia shows a foliated aspect with an anastomosing network of polished and striated surfaces. At the base of this zone, a dark 2-mm-thick layer sharply separates intensely brecciated hemipelagic mudstone above from unbroken hemipelagic mudstone and ash below. There is a biostratigraphic age reversal as well. These features indicate that the thin dark layer most likely represents extreme localization of slip associated with thrust faulting. This frontal thrust zone at 418–438 m CSF is located in a stratigraphic package of late Miocene mud, which appears to be similar to the Shikoku Basin facies that hosts the décollement in the Muroto and Ashizuri transects (Moore et al., 2001). The footwall proved to be remarkably coarse-grained, as it was dominated by sand and gravel trench-axial channel facies deposits, and core recovery was very poor in this interval.
Lithologic Unit I sediments at Site C0006 (Fig. 3) are interpreted as representing a transition from trench to slope deposition, while Unit II is composed of trench fill facies sediment; thus, the Unit I/II boundary records the uplift of trench material into the prism. Unit I sediments are younger than or the same age as sediments filling the basin behind the thrust. The age of this transition is 0.78–0.44 Ma. Seismic data show that about 6 km of overriding of trench channel facies by the frontal thrust has taken place since this fault initiation time (Fig. 3; Moore et al., 2009) without develop-. 3; Moore et al., 2009) without develop- 3; Moore et al., 2009) without develop-; Moore et al., 2009) without develop- Moore et al., 2009) without develop-ment of any further frontal accretion thrusts. How such a large amount of slip has concentrated within the fault zone imaging (Expedition 316 Scientists, 2009a). LWD gamma
and resistivity logs in Hole C0006B indicate that the interval beneath 711 mbsf is dominated by massive sand, consistent with a position below the frontal thrust in the trench fill deposits, correlative to the footwall cored at Site C0007 (see next paragraph).
The plate boundary frontal thrust was successfully cored at Site C0007 nearby (Figs. 4, 5), and thrust fault material
Figure 3. Inline seismic section for the frontal thrust region, Sites C0006 and C0007. Reproduced from Moore et al. (2009).
U S B U S B
Trench channel complex
Protothrust Zone
Frontal thrust
Trench wedge C0007
(proj) C0006
Slope sediments
Trench wedge
Frontal thrust
IL 2434 500 mNo VE
XL3650 3600 3550 3500 3450 3400
4.0
4.5
5.0
5.5
Depth (k
m)
SE NW
Pleistocene
Unit I: Trench-to-slope transition
Unit II: Accreted trench wedge
Hole D 100
Site C0007
Unit IV: Trench wedge Unit III: Upper Shikoku Basin
Pliocene
200
300
400
Pleist.
?
Pleistocene
Holes A/B/C
Frontal Thrust
hemipelagic mud volcanic ash
sandy silt silt turbidite
sand turbidite gravel
Depth CSF (m)
Lithology
judged too deep at ~2000 mbsf to access with riserless drilling at this site). For NanTroSEIZE Stage 2, 3.5-km riser drilling had been planned at Site C0001, located at a small bench on the hanging wall of the main branch of the mega-splay fault (Fig. 6) where a small slope basin with coherent layered reflectors is developed, overlying a more seismically-chaotic thrust sheet above the splay fault. In Stage 1, pilot-scale drilling of the uppermost ~1000 mbsf at this site was executed to test conditions for riser drilling and to set the surface casing for this later effort. The results of this pilot, detailed below, indicate that this may be a difficult location for a riser site, and that plan is being reevaluated.
We first drilled an LWD-only hole at this site (Expedition 314 Scientists, 2009b), achieving 976 m of penetration (just 24 m short of the planned depth, but sufficient to achieve all logging objectives). Difficult hole conditions were encountered, including an interval of high drill string torque due to apparent borehole caving, enlargement, and partial collapse around 460–540 mbsf, an interval that became known as “the sticky zone”. Logging results suggested that the sediments of the hanging wall thrust sheet are primarily muds and mudstones with some silty to sandy (or ash-bearing) sediments, overlain by ~200 m of hemipelagic slope deposits. Resistivity imaging suggested widespread fracturing and variable bedding orientation, and how the evolution of the fault zone has affected the
characteristic features in this region are two important issues for post-expedition research. Furthermore, taking into account the relative plate motion velocity of ~4 cm yr -1
between the overriding Japanese islands and the Philippine Sea plate (Seno et al., 1993), we determine the relative total slip distance has to be ~40 km, not 6 km. Therefore, the majority of the total shortening must be taken up elsewhere within the accretionary prism.
The accretionary prism in the frontal thrust region is deformed by thrusting, as visible on the seismic profiles (Figs. 2, 3; Moore et al., 2009). Most of the thrusts inferred from the seismic profiles and LWD data were confirmed through age reversals, fault zones sampled in cores, and repetition of specific strata, but some additional faults were also defined during Expedition 316 drilling. Initial chemical analyses of interstitial fluid (porewater geochemistry) and microbial habitat around most of these “intraprism” thrusts do not indicate any signal of active fluid flow focused along these faults or in other permeable conduits.
In contrast to such intraprism thrusts, many normal faults are developed at the core scale and appear to be the youngest deformation feature. Clear slope-parallel mass sliding is observed from the submarine topography, seismic profiles, and shallow cores (Fig. 3). These facts suggest that the taper angle of the prism locally at the toe is presently above the critical wedge taper angle and is unstable. There is evidence that the system is currently in a period of wedge collapse, perhaps as a readjustment to the passage of subducted base-ment topography.
Porosity data suggest that a considerable thickness of material has been eroded or otherwise removed from the surface at Sites C0006 and C0007. Porosity is quite low at shallow depths below the surface, reaching 48% at 5 m and 34 m CSF at Sites C0006 and C0007, respectively. In contrast, porosity does not decrease to <50% until ~150 to ~200 mbsf, at other sites on the Stage 1 transect farther landward in the prism.
Mega-Splay Fault Region (Sites C0001,
C0003, C0004, and C0008)
The out-of-sequence mega-splay fault zone branches into a number of individual splays as it enters the upper few kilometers of the subsurface (Fig. 2; Moore et al., 2009). A series of sites targeted the thrust sheet, fault zone, and footwall of the lower of these branches, which was judged to be the most active and most significant of the seismically imaged splays (Tobin and Kinoshita, 2006b; Moore et al., 2009).
Site C0001: Site C0001 was chronologically first in drilling,
and targeted only the thrust sheet (not the underlying fault itself) in the most landward position (the fault zone was
Figure 5. Fault core example from the frontal thrust region at Site C0007 (Expedition 316). Appearance of concentrated deformation in lower portion of frontal thrust fault Zone 3, at a depth of 438 mbsf. [A] CT image and [B] core photograph of finely brecciated hemipelagic mudstone (interval 316-C0007D-29R-2, 37–73 cm). [C] Close-up of finely brecciated interval. [D] Thin (2-mm-thick) dark layer (arrow) developed at base of finely brecciated interval..
2 cm
2 cm
2 cm
A B
D C
2 cm
ai
c
c
er
B
X-ray CT Split core photo
Detail photos
C
D
indicative of strong deformation, especially below ~460 mbsf.
Subsequent coring at this site during Expedition 315 confirmed and greatly added to these observations (Fig. 6B). Results of the coring document the age and make-up of the deformed mega-splay thrust sheet and overlying slope apron deposits, as well as structural features and inferences on evolution of the stress state (Expedition 315 Scientists, 2009a). Despite numerous attempts in multiple holes at this site, the challenges posed by “the sticky zone” proved too great to advance the coring beyond 458 mbsf. The cored interval includes the slope basin (Unit I) and the top ~250 m of the underlying accretionary prism (Unit II). Unit I is composed mainly of Quaternary to late Pliocene silty clay and clayey silt with volcanic ash, while Unit II is made up of older (late-Pliocene to Miocene) mud-dominated sediments. The boundary between Units I and II, identified at 207 mbsf, is an unconformity located immediately below a thick sand layer. Unit II exhibits much more deformation at core and seismic scales, and a range of small-scale structures including normal, thrust, and strike-slip faults. Kinematic solutions computed from normal and thrust faults are consistent with northeast-southwest extension and northwest-southeast shortening, respec-tively, suggesting that tectonic shortening during emplacement of the thrust sheet and contemporaneous or later extension perpendicular to that are recorded. The extension may be evidence of near-surface collapse of the slope.
We found it interesting to note that at the frontal thrust area, interstitial water geochemistry and organic geochemistry data do not show clear evidence for advection of chemically-distinct fluids from depth.
Site C0003: This proposed site was
intended to begin the downdip transect of the mega-splay fault system by sampling a relatively shallow, presumably aseismo-genic, point on the fault zone at ~800 mbsf (Fig. 7). Unfortunately, we encountered very difficult drilling conditions at this site, such as especially pronounced caving and
Depth (km)
2.5
3.0
3.5
4.0
500 m VE = 1.05 C0001
C0004 C0003 (proj)
mega-splay fault 1.4 Ma
2–4 Ma 5–6 Ma
5–6 Ma
1.6 Ma 2.0 Ma
NW SE
A
100
200
300
400
Unit IA: slope apron facies
Unit IC: basal slope apron
Unit II: upper accretionary prism
Sand, hemipelagic mud
Hemipelagic mud
Bioturbated with rare silt, volcanic ash Depleted in biogenic carbonate Outer trench-wedge facies? Nannofossil-bearing hemipelagic mud with volcanic ash
B A I
II Logging
unit Depth
CSF (m) Stage
Quater
nar
y
Pliocene
Unit IB: basal slope apron
Hemipelagic mud with silt turbidites
C B A Local soft-sediment deformation
Miocen
e
Age
(Ma)
0.436
3.79 2.06 1.60 1.46 1.04 0.90
4.5
Silt, sandy silt
Sand, silty sand Silty clay
Volcanic ash
Slump folds Site
C0001
Lithology
Figure 6. [A] Inline PSDM seismic section through the mega-splay fault thrust sheet sites, showing total drilled depth at each site. Age labels show maximum sediment depositional ages based on nannofossil biostratigraphy. [B] Site C0001 summary column of lithostratigraphy, logging units, and age of sediments determined through biostratigraphy and paleomagnetic data.
washout of likely fault zones and possibly sandy intervals, which caused the drill string to become irretrievably stuck before reaching the primary objective (Expedition 314 Scientists, 2009c). While drillers worked to free the stuck pipe, it parted and we were ultimately unable to recover the bottom hole assembly with the LWD tool string and ~200 m of drill collars at this site. Nevertheless, real-time data trans-mission provided substantial logging data from the seafloor to ~530 m LWD depth below seafloor (LSF). No further drilling or coring was attempted here; we instead moved to Site C0004 (see next section).
Consistent with the other midslope sites, the lithology at C0003 is
appa-rently composed of relatively coarse silt-sand and hemipelagic mud in the shallowest portion, underlain by more clay-rich, generally homogeneous muddy deposits interrupted by prominent zones of washouts interpreted as brecciated intervals, indicating likely faults (Expedition 314 Scientists, 2009c). The seismic reflection imaging shows that this site was drilled into a series of at least three indivi-dual thrust sheets within the hanging wall of the mega-splay fault system (Fig. 7). Therefore, major washout zones identi-fied in logs at ~240 m and 420–450 m LSF are likely to be strongly brecciated damage zones from subsidiary thrusts, analogous to fault breccia recovered in core at other sites.
The seismic interpretation is consistent with substantial uplift of the thrust sheet bringing older and more deeply buried accretionary prism rocks to within 500 m of the seafloor. Log density data show relatively constant and high values for this depth; these suggest that anomalously well-indurated rocks make up the thrust sheet. When the broken section of drill pipe was recovered to the rig floor after loss of the LWD string, it was plugged with numerous large chunks (up to 5–8 cm in diameter) of cavings that had come from an unknown position in the hole. This material had a nannofossil age of late Miocene (5.5–7.2 Ma), bulk density of 2.1 g cm -3, and P-wave velocity of ~2.1 km s -1, also
consistent with the thrust sheet rocks having been uplifted from greater depth within the accretionary complex.
Site C0004: Site C0004 is located seaward of Sites C0001
and C0003 (Fig. 6). It targeted the prominent splay fault reflector at a depth of approximately 300 mbsf. The overlying thrust sheet, the mega-splay fault zone, and ~100 m of the footwall sediments were successfully drilled with LWD logging (Expedition 314) and coring (Expedition 316). Drilling at this site also examined the youngest sediments on the slope overlying the accretionary prism, which consist
of slowly deposited hemipelagic marine sediments and rede-posited material from upslope. This rederede-posited material provides information about past slope failures, which may be related to past mega-splay movement, earthquakes, and tsunamigenesis. This will be the subject of future work on the core samples. The top of the prism corresponds to a prominent unconformity (age gap = ~1My) that displays pyrite and other mineralization. Structural observations of core material from the fault zone and two age reversals suggested by nannofossils indicate a complex history of deformation. Sediments under the fault zone were sampled to understand their deformation, consolidation, and fluid flow history. Further results and discussion of Site C0004 are summarized below in the “Key Results” section.
Site C0008: Drilling at Site C0008 targeted the slope basin
seaward of the mega-splay fault (Fig. 2B) as a complement to Site C0004, which is about 1 km farther landward. This basin records the history of fault movement. Sediments are Pleistocene to late Pliocene hemipelagic silts and clays with ashes (Expedition 316 Scientists, 2009c). Several gravelly sequences were identified and interpreted as indicative of mass transport complexes. Sediments of the slope basin at Site C0008 provide a “reference site” for the sediments underthrust beneath the mega-splay fault. Comparison of the interval 190–200 m CSF in Hole C0008A (with an average porosity of 50%) and the correlated interval 320–330 m CSF in the mega-splay footwall section of Hole C0004D (average porosity of 43%) suggests the sediments are dewatering during underthrusting. Evidence for lateral flow from the C0004 area toward Site C0008 is provided by C1/C2 (methane/ethane; one indicator of biogenic vs. thermogenic gas origin) ratios that are slightly lower than expected for biogenic production at the estimated in situ temperature, but they are similar to those at Site C0004. Lateral flow along sand layers could transmit fluids from areas of higher Figure 7. Site C0003 on Inline 2596. Black line is the originally planned total depth of 1000 mbsf;
green line is actual depth achieved when the drill string became stuck. Yellow line is approximate length of stuck and abandoned bottom-hole assembly . The reflector that intersects the borehole at ~2.9 km depth is interpreted as a fault zone, and is the probable source of dated cavings in the hole.
NW
SE 200 m
VE=1.0X C0003
Depth (km)
2.4
2.6
2.8
3.0
3.2
3.4
timing and history of the mega-splay system in the formation and filling of the Kumano basin, and it was used to document the present-day stress regime in this portion of the margin (see “Summary of Key Results” below).
During Expedition 315, Site C0002 was drilled again (in two separate holes) to 1057 m CSF, with coring of the intervals 0–204 m CSF and 475–1057 m CSF (Fig. 8B, 8C). The Kumano Basin is a young feature (mostly Quaternary) with a high sedimentation rate (>800 m Ma-1) overlying a late
Miocene (5–6 Ma) accretionary prism. This is much younger than most of the Tertiary Shimanto belt outcropping onland. Biostratigraphic data show that the transition from Pliocene to late Miocene strata occurs as a marked age gap around 922 m CSF.
We cored across the basal unconformity of this Kumano forearc basin at ~922 m CSF and another 135 m into the accretionary prism (Expedition 315 Scientists, 2009b). The forearc basin sequence was divided into two units based on lithofacies. All units are dominated by mud and mudstone; however, Units I and II contain more sand and silt inter- calation and have a much faster sedimentation rate than the basal deposits of Unit III. Underlying accretionary prism materials contain moderately more lithified—and much more deformed—sediments.
temperature because of greater burial beneath the splay fault, driving fluids out along permeable sandy layers.
Kumano Forearc Basin Region: Site C0002
Site C0002 sampled the Kumano forearc basin and the underlying old accretionary prism material (Figs. 2, 8). LWD drilling during Expedition 314 was very successful here, with a single hole achieving 1401 m penetration—the deepest LWD hole in scientific ocean drilling to date—and we show a comprehensive log summary in Figure 8A (Expedition 314 Scientists, 2009d). Approximately 940 m of this drilling was through the sediments of the Kumano forearc basin, whereas the lower ~460 m accessed the underlying rocks interpreted to be the accretionary prism formed through earlier frontal accretion.
This site is slated to be the centerpiece of the NanTro-SEIZE project, with six or more kilometers of drilling plan-six or more kilometers of drilling plan- or more kilometers of drilling plan-ned to access the plate boundary at seismogenic zone depths in a later stage (Fig. 2). Therefore, understanding the physi-Fig. 2). Therefore, understanding the physi-ig. 2). Therefore, understanding the physi-. 2). Therefore, understanding the physi- 2). Therefore, understanding the physi-Therefore, understanding the physi-nderstanding the physi-cal properties and documenting tectonic processes and lithology in the hanging wall of the plate boundary here were important goals of Stage 1 drilling, not the least because of the need for high-quality borehole engineering parameters to plan riser drilling. Scientifically, the hole records the
Figure 8 [A]. Site C0002 Results – Summary plots of major LWD logs for the full 1400-m interval drilled. (Figure 8. [B] shown on p.12 and [C] shown
on p.13)
I
II
III
IV
Zone B
Medium resistivity image Static
N E S W N
Conductive Resistive
100
200
300
400
500
600
700
800
900
Depth LSF (m)
1000
1100
1200
1300
1400
(gAPI) 20 120
Gamma ray Ring resistivity 5
0 2 4
PEF Neutron porosity 1
0.2 (V/V) 0.8 2.3
Bulk density Sonic velocity
Fracture dips
90
0 (°)
Slowness Ultrasonic caliper
Deep button resistivity
(m s )
1220 30480 100(V/V) Resistivity-derived porosity
(°) 90
0
Structural data Bedding dips
F
orearc basin sediment
s
Accretionar
y pr
ism
5
0 7 18(inch) 250 100 Hole location
Inline 2529 NWVE = 4 350 mSE
Zone A
Logging
unit ( m) (b/e )- (g cc )
(µs ft ) ( m)
A
-1 -1
At Site C0002, a well-developed bottom simulating reflec-tor (BSR) is imaged in the seismic data, and LWD logs recorded comprehensive in situ information about the nature of this gas hydrate BSR (Expedition 314 Scientists, 2009d). Resistivity logs showed a pattern of elevated resistivity background and spikes for ~200 m above the BSR depth at ~400 m LSF (Fig. 8). The gamma response indica-ted that the spikes are in especially sandy intervals as thick as 1–2 m, which were interpreted as the coarse basal beds in turbidite deposits. Sonic and resistivity responses are consistent with pore space in these sands being partially filled and “cemented” with gas hydrate. In contrast, similar sands below the BSR reflector depth show no elevated resis-tivity response. In a zone 80 m deeper and ~70 m thick, a low resistivity response in the sandy beds suggests a potential gas-charged interval beneath the gas hydrate stability field. The logging data indicate that the BSR reflectivity is a response to a small velocity high from hydrate cement in the hydrate stability zone and to a more significant velocity low caused by the presence of uncemented sediments and/or free gas below the stability field.
Ongoing log analysis integrated with 3-D seismic analysis will quantify the amount of pore space charged with hydrate in the zone above the BSR and the total amount of gas in this region of the Kumano Basin section. During Expedition 316, Site C0002 was cored late in the expedition as a contingency operation. The BSR interval and overlying apparent gas hydrate-rich zone was not cored in order to allow time for deeper objectives..
Summary of Key Results
Lithology, Structure, and Recent Activity of
Mega-Splay Fault and Associated Thrust Sheet
(Sites C0001, C0004, and C0008):
A key question for the NanTroSEIZE transect is whether or not the mega-splay style of fault development indicates that tsunamigenic coseismic slip comes near to the surface preferentially in the mid-slope region, as opposed to ex-tending along the basal décollement out toward the trench. Based on seismic and tsunami inversion studies combined with seismic reflection research, various workers have suggested that the splay fault system in this area slipped during the 1944 Tonankai Mw 8.2 earthquake to
generate the observed tsunami (Baba et al., 2006; Park et al., 2002). From a 3-D seismic reflection investigation, Moore et al. (2007) also suggest recent historical and geological accumulation of dis-placement along the mid-slope mega-splay fault. The age reversal from Pliocene to Pleistocene docu- mented beneath the splay fault during Expedition 316 (Fig. 6) is consistent with geologically recent activity. However, age resolution is, of course, insufficient to document historical fault activity.
Integration of seismic imaging, coring, and logging results for Site C0004 provides evidence for recent activity of the splay fault. The splay fault clearly thrusts the hanging wall prism over younger slope sediments in the footwall; however, the youngest (less than about 1 Ma) slope sediments that cover the fault appear not to be cut by the fault. In addition, the lack of a slope break on the seafloor above the fault might also suggest that this splay fault is presently not active but ceased activity in the
B
CSF (m)
Site
C0002D CSF (m)
Site C0002B
Lithology
B
recent past. However, the following shipboard results interpreted in the context of seismic reflection imaging provide support for the alter-nate interpretation that the splay fault is active as a blind thrust, in which the tip of the fault has not propagated to the surface but remains buried. Shallow cover sedi-. Shallow cover sedi- Shallow cover sedi-ments were found in cores to be composed of repeated mass transport complexes associated with repeated slope collapses and rip-up debris generation. Pleistocene cover sediments dip steeply approximately parallel to the slope and are cut by numer-ous normal faults, expressed at core and seismic scales (Expedition 316 scientists,
2009d). Slip on deeper levels of the fault zone could be manifested in some combination of folding and layer-parallel slip in the shallow slope sediments draping the uppermost portion of the mega-splay, as well as the possible triggering of numerous marine slump or slide deposits.
Despite inferences of recent activity on the splay fault system, no porosity inversion is observed beneath the splay fault; this contrasts with previous results from the décollement of the Muroto transect (Screaton et al., 2002), in which a clear porosity inversion across the fault likely reflects fluid overpressure. Unlike the Muroto transect décollement, the splay fault system observed at Site C0004 has permeable pathways for dewatering provided by the observed sand and coarse ash layers.
Age of Cover Sequence and Uplifted
Accretionary Prism Units
Rocks of the thrust sheet below 500 m LSF at Site C0001 and also of the cavings sampled at Site C0003 are anomalously dense relative to their present depth of burial, with high sonic/seismic velocity, indicating relatively advanced lithification. This suggests significant uplift and exhumation along the splay thrust. These inferences are consistent with the age determinations made on cores, showing that this thrust sheet contains rocks several millions of years old, in contrast to the immediately overlying Pleistocene and younger slope deposits (Fig. 6). Thrust sheet material drilled at C0004 is substantially younger than the analogous material at C0001 or C0003, suggesting that the mega-splay thrust sheet contains internal structural imbrication and has incorporated material progressively as it advanced.
At all of the sites landward of the frontal thrust area, units interpreted to be an uplifted section that was frontally accreted to the prism are covered by varying amounts of slope drape. In the case of Site C0002, this slope drape is in turn covered with the thick, dominantly Pleistocene Kumano forearc basin section (Fig. 2). Biostratigraphy (predominantly by nannofossil zones) and magnetostratigraphy define the ages of sediments above and below these boundaries, which also record time gaps of various durations between the prism section and cover (Figs. 6, 8C).
In the frontal thrust region at Site C0006, the transition from uplifted trench sediments into the overlying slope apron cover sediments is dated to 0.436–0.78 Ma, which presumably records the timing of initial frontal thrust activity. Only twenty-seven meters of younger slope cover overlies this boundary, and this implies potential removal of young deposits through slumping or mass wasting.
Moving to the mid-slope mega-splay fault region, the oldest sediment at the base of the slope cover at Site C0004 (dated at 1.46 Ma) rests on sediments that are 1.1. My older than that. Just a short distance landward at Site C0001, in the same apparent overall thrust complex (Figs. 2, 6), the age of the base of the slope apron is 2.0 Ma—substantially older than C0004—resting on a nearly 4 Ma accreted section. Ten kilometers further landward in the Kumano basin at Site C0002, the slope apron lies on top of the accreted complex at a depositional age of 3.79 Ma and rests on >5 Ma sediments in the accreted section. This landward progression of successively older dates marking the uplift and surface exposure of Shikoku basin sediments is consistent with progressive growth of the accretionary prism through late Miocene to Quaternary time.
Figure 8 [C]. Site C0002 – Biostratigraphic age determinations for the cored intervals, illustrating contrast between prism, slope drape, and forearc basin sediment accumulation timing and rates.
Age (Ma)
min. age
C
100 m My min.
age Unit I:
forearc basin facies
max. age
nanofossil planktonic foraminifera
depth range of event
pmag boundary No Coring
NA 100
0 Silty clay
turbidite rich
500
600
700
800
900
1000
Unit II: 400-800 m My
forearc basin facies
Unconformity?
Unit III: 18-30 m My
basal forearc basin
Unconformity
Unit IV:
upper accretionary prism
Quaternary late middle early
Pliocene
late Miocene
100
500
600
700
800
900
1000
1100 200
300
400
Depth (mbsf)
min. age
NW SE
500 m VE=2.4x
2.0
2.2
2.4
2.6
2.8
3.0
3.2
3.4
1 2 3 4 5 6 7
-1
-1
Furthermore, the slope apron at Site C0002 accumulated very slowly until ~1.5 Ma, then more than 800 meters of forearc basin turbidites accumulated rapidly (Fig. 8C). The implication is that the onset of splay fault uplift of a pronounced outer arc high and/or capture of a significant turbidite sediment source for the basin was abrupt in the early Pleistocene.
Indicators of Stress Regime
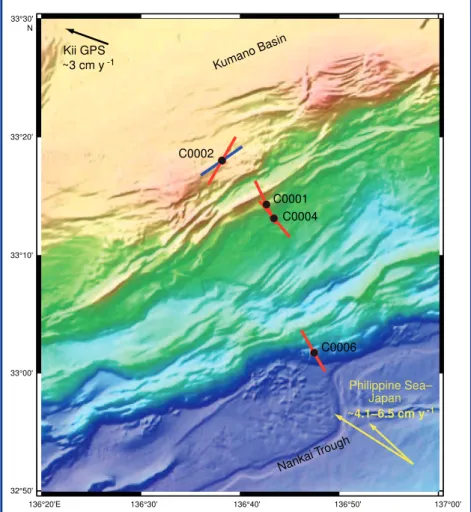
Borehole breakouts and present-day stress orientations: Borehole breakouts were observed at all four sites for which we have imaging data. They also show very systematic orientations (Fig. 9). In a vertical borehole, the orientation of breakouts, or compressive borehole wall failures upon drilling, is a well-established indicator of the orientation of the horizontal maximum principal stress in the present-day stress field (Zoback et al., 2003). Drilling-induced tensile fractures (DITF) were observed less frequently, primarily at Site C0001 in the splay fault thrust sheet. Breakout orientations at Sites C0001, C0004, and C0006 all indicate northwest–southeast azimuths of the maximum horizontal principal stress (SHmax) (Fig. 10). In the thrust-dominated
tectonic environment, this is consistent with trench-normal shortening, although strike-slip and/or normal faulting stress states are also permissible (see next section). By contrast, at Site C0002 in the Kumano Basin, the orienta-tion of SHmax is northeast–southwest at 134º, or very nearly
perpendicular to that in the more trenchward sites (Figs. 9, 10). This is consistent with a normal faulting stress state that extends through the basin section (which, in fact, exhibits numerous normal faults) and also in the upper
400 m (at least) of the underlying older accretionary prism section; however, given that stress magnitudes are unknown, the breakout orientation here also does not preclude strike-slip or reverse faulting stress state. This contrast between the outer accretionary prism and the forearc basin region (including the buried prism rocks beneath) suggests that the tectonic stress orientations differ markedly in the upper part of the prism at sites just a few kilometers apart along our transect. Implications of these data will be explored in post-expedition research to understand the mechanical state of the prism and basins.
Paleostress from core-based structural data: Core-scale
structures can be used to infer paleostress regimes, while breakouts respond to present-day stress. Oriented struc-tural data from cores drilled on Expedition 315 in Holes C0002C and C0002D (Kumano Basin site) show small-scale structures consistent with the interpretation that the present-day stress field is extensional and directed NE-SW. This agrees very well with the interpretation of breakout data for the present-day stress field (Expedition 315 Scientists, 2009b).
In the minor structures observed in the mega-splay thrust sheet at C0001 and at the frontal thrust at C0006, reverse and normal faults were documented (with minor strike-slip as well). In general, there is an overall indication at both of these sites that the youngest and/or most numerous small faults are normal and record extensional conditions striking NW-SE and dipping sub-equally to NE and SW (Expedition 315 Scientists, 2009a; Expedition 316 Scientists, 2009a). In the case of Site C0006, this was interpreted by the ship-board party as evidence of geologi-cally recent collapse of an oversteepened frontal wedge (Expedition 316 Scientists, 2009a). By contrast, at Site C0004, normal faults were not prominent in the front of the mega-splay thrust sheet (except in a thin and shallow slope cover sequence of 0–78 mbsf), and reverse faults dominate, though they were not numerous and generally were not in oriented intervals of the core.
Site C0001, on the other hand, shows reverse faulting beneath the slope cover but overprinted by normal faults recording NE-SW directed extension, even in the thrust sheet, similar to C0006 at the frontal thrust area, and Figure 9. Resistivity at bit images synoptically showing full depth extent of LWD logged intervals at Sites
C0001, C0002, C0004, and C0006. Vertical paired dark bands are images of borehole breakouts that have been interpreted in order to generate the average SHmax azimuths shown in Figure 10.
N S
N N S
N
Site C0002 Site C0001
Static Static
Site C0004 Site C0006
Depth LSF (m)
Conductive Resistive
1400 1200 1000 800 600 400 200 0
Dynamic Dynamic
N S
N S N N S
approximately orthogonal to the present-day
SHmax direction. These apparently
heteroge-neous paleostress states at the various sites along the lower-slope portion of the transect (i.e., all except for C0002) may not be in conflict if the three principal stresses differ only modestly at these shallow depths, and small changes in their relative magnitude can effect a “flip” in stress/faulting regime. As the wedge develops, shortens, rides over basement topography, it might respond by successive and frequent flips in faulting regime, especially in the upper 1000 meters or so. The remarkably uniform orientation of the breakouts down each hole would typically be interpreted as evidence of a high-differential stress, homogeneous stress state environment. Further analysis of the stress conditions and this apparent paradox awaits post-cruise efforts.
Thermal Regime
Acquisition of a transect of good quality downhole temper-ature profiles and thermal conductivity data were an important part of Stage 1 drilling. Thermal regime may be closely tied to fault stability criteria (Hyndman et al., 1995), and the prediction of temperature at plate boundary fault zone depths is dependent on well-defined heat flow and thermal properties. Prediction of temperature
at deeper levels is also crucial for future deep well planning and the mechanical specifications of long-term borehole instruments to be installed during NanTroSEIZE Stage 4, because operating temperature places severe constraints on available instruments.
Downhole temperature measurements using the APCT3 and Davis-Villinger Temperature Probe (DVTP) were successfully conducted across the Stage 1 transect. For details of the data from each site, see the respective site chapters in the Expedition Report (Kinoshita et al., 2009). In general, good linear gradients indicative of predomi- nantly conductive heat flow were found at all sites, with the exception of some depths at Site C0006.
From SE to NW (i.e., seaward to landward along the transect), the results are as follows. In the frontal thrust region at Site C0007, the thermal gradient is 42ºC km-1 (heat
flow of 53 mW m2). At the nearby Site C0006, a thermal
gradient of 27ºC km -1 (heat flow of 33 mW m2) was computed.
This is surprisingly low relative to regional data and the other sites. Moving to the mega-splay sites, we find the best fitting thermal gradients were 51ºC km -1 and 57ºC km -1 in
Holes C0008A and C0008C, respectively. Very close by at Site C0004, the measured gradient was 52ºC km-1. At Site
C0001, the measured gradient was 44ºC km -1 (heat flow of
47 mW m2). In the Kumano basin, the thermal gradient at
Site C0002 was 43ºC km -1. All of these gradients are
consistently lower—by 10% to >50%—than those estimated from surface measurements (Kinoshita et al., 2008). The reason for this is not clear. The extremely low heat flow observed at frontal thrust Sites C0006 and C0007 might be related to stratigraphic or structural fluid pathways developed in this region, perhaps facilitating circulation of seawater down into the thrust sheet, though geochemical evidence of seawater circulation was not identified in porewater analyses at those sites. Also, lower heat flow relative to that predicted by surface probe measurements is consistent across all the sites, even those where such circulation seems less likely. The measured gradients appear to be very nearly linear over the depth range of the available data, so discrepancies between borehole and surface measurements are probably not attributable to an advective component. The borehole vs. surface heat flow discrepancy remains enigmatic.
Conclusion
Major scientific accomplishments of NanTroSEIZE Stage 1 include the following:
Figure 10. Azimuth of maximum horizontal stress estimated from borehole breakout images at Sites C0001, C0002 (in basin above 936 mbsf), C0004, and C0006 (red lines). Blue line = estimate for older accretionary prism formation below 936 mbsf at Site C0002.
−4000
−4000
−3500
−3500
−3500
−3500
−3500
−3000
3000
−2500
−2500
−2000
−2000
−200 0
−2000
−2000
−2000
−2000
136°20'E 136°30' 136°40' 136°50' 137°00'
32°50' 33°00' 33°10' 33°20' 33°30' N
~4.1–6.5 cm y
Kii GPS ~3 cm y
Nankai Trough
Philippine Sea– Japan C0006 C0002
C0001 C0004 Kumano Basi
n
-1
Successful core sampling of the presumed aseismic portions of major faults and the near-fault environment at the mega-splay fault system and the frontal thrust area;
In situ measurements of physical properties and borehole
imaging with LWD instruments, documenting present-day horizontal stress orientations through borehole breakout interpretation; and
Documenting of the lithology, structural features, and age of sediments in and below the thrust sheets, fault zones, slope cover, and forearc basin. In particular, age determina-tion of the forearc basin fill, slope cover, and secdetermina-tions over-ridden by thrusts provides a framework for understanding the materials and processes in the seismogenic zone, by providing information on its development and evolution.
As these were the pioneering IODP expeditions for Chikyu, the tremendous amount of technically-challenging drilling that was accomplished is a testament to the skill of the drilling and operations teams on board and in support onshore. The scientific goals of the NanTroSEIZE transect have been framed from its earliest conception as a comparison of the properties and state of faults and wall rock between the shallow aseismic portion and the deeper, seismogenic system. Taken as a whole, the NanTroSEIZE Stage 1 transect of sites has documented the structure, sedimentology, tectonic history, present-day stress conditions, hydrologic and geochemical regime, and other aspects of the margin for the region shallower than ~1400 m below seafloor. Thus the crucial first part of the comparison has been achieved, setting the stage for deep riser drilling to the seismogenic zone.
References
Baba, T., Cummins, P.R., Hori, T., and Kaneda, Y., 2006. High
pre-cision slip distribution of the 1944 Tonankai earthquake
inferred from tsunami waveforms: possible slip on a splay
fault. Tectonophysics, 426(1–2):119–134. doi:10.1016/j.
tecto.2006.02.015.
Enescu, B., Mori, J., and Ohmi, S., 2005. Double-difference
reloca-tions of the 2004 off the Kii peninsula earthquakes. Earth,
Planets Space, 57(4):357–362.
Expedition 314 Scientists, 2009a. Expedition 314 Site C0006.
In: Kinoshita, M., Tobin, H., Ashi, J., Kimura, G., Lallemant,
S., Screaton, E.J., Curewitz, D., Masago, H., Moe, K.T., and
the Expedition 314/315/316 Scientists, Proc. IODP,
314/315/316. Washington, DC (Integrated Ocean Drilling Program Management International, Inc.), doi:10.2204/
iodp.proc.314315316.123.2009.
Expedition 314 Scientists, 2009b. Expedition 314 Site C0001.
In: Kinoshita, M., Tobin, H., Ashi, J., Kimura, G., Lallemant,
S., Screaton, E.J., Curewitz, D., Masago, H., Moe, K.T., and
the Expedition 314/315/316 Scientists, Proc. IODP,
314/315/316. Washington, DC (Integrated Ocean Drilling Program Management International, Inc.), doi:10.2204/
iodp.proc.314315316.123.2009.
Expedition 314 Scientists, 2009c. Expedition 314 Site C0003.
In: Kinoshita, M., Tobin, H., Ashi, J., Kimura, G., Lallemant, S., Screaton, E.J., Curewitz, D., Masago, H., Moe, K.T., and
the Expedition 314/315/316 Scientists, Proc. IODP,
314/315/316. Washington, DC (Integrated Ocean Drilling
Program Management International, Inc.), doi:10.2204/ iodp.proc.314315316.123.2009.
Expedition 314 Scientists, 2009d. Expedition 314 Site C0002. In
Kinoshita, M., Tobin, H., Ashi, J., Kimura, G., Lallemant, S.,
Screaton, E.J., Curewitz, D., Masago, H., Moe, K.T., and the
Expedition 314/315/316 Scientists, Proc. IODP, 314/315/316.
Washington, DC (Integrated Ocean Drilling Program
Management International, Inc.), doi:10.2204/iodp.
proc.314315316.123.2009.
Expedition 315 Scientists, 2009a. Expedition 315 Site C0001.
In: Kinoshita, M., Tobin, H., Ashi, J., Kimura, G., Lallemant,
S., Screaton, E.J., Curewitz, D., Masago, H., Moe, K.T., and
the Expedition 314/315/316 Scientists, Proc. IODP,
314/315/316. Washington, DC (Integrated Ocean Drilling Program Management International, Inc.), doi:10.2204/
iodp.proc.314315316.123.2009.
Expedition 315 Scientists, 2009b. Expedition 315 Site C0002. In: Kinoshita, M., Tobin, H., Ashi, J., Kimura, G., Lallemant,
S., Screaton, E.J., Curewitz, D., Masago, H., Moe, K.T., and
the Expedition 314/315/316 Scientists, Proc. IODP,
314/315/316. Washington, DC (Integrated Ocean Drilling Program Management International, Inc.), doi:10.2204/
iodp.proc.314315316.124.2009.
Expedition 316 Scientists, 2009a. Expedition 316 Site C0006. In: Kinoshita, M., Tobin, H., Ashi, J., Kimura, G., Lallemant,
S., Screaton, E.J., Curewitz, D., Masago, H., Moe, K.T., and
the Expedition 314/315/316 Scientists, Proc. IODP,
314/315/316. Washington, DC (Integrated Ocean Drilling
Program Management International, Inc.), doi:10.2204/
iodp.proc.314315316.134.2009.
Expedition 316 Scientists, 2009b. Expedition 316 Site C0007.
In: Kinoshita, M., Tobin, H., Ashi, J., Kimura, G., Lallemant,
S., Screaton, E.J., Curewitz, D., Masago, H., Moe, K.T., and
the Expedition 314/315/316 Scientists, Proc. IODP,
314/315/316. Washington, DC (Integrated Ocean Drilling Program Management International, Inc.), doi:10.2204/
iodp.proc.314315316.134.2009.
Expedition 316 Scientists, 2009c. Expedition 316 Site C0008.
In: Kinoshita, M., Tobin, H., Ashi, J., Kimura, G., Lallemant,
S., Screaton, E.J., Curewitz, D., Masago, H., Moe, K.T., and
the Expedition 314/315/316 Scientists, Proc. IODP,
314/315/316. Washington, DC (Integrated Ocean Drilling Program Management International, Inc.), doi:10.2204/
iodp.proc.314315316.134.2009.
Expedition 316 Scientists, 2009d. Expedition 316 Site C0008. In: Kinoshita, M., Tobin, H., Ashi, J., Kimura, G., Lallemant,
S., Screaton, E.J., Curewitz, D., Masago, H., Moe, K.T., and
the Expedition 314/315/316 Scientists, Proc. IODP,
314/315/316. Washington, DC (Integrated Ocean Drilling Program Management International, Inc.), doi:10.2204/
Heki, K., 2007. Secular, transient and seasonal crustal movements in
Japan from a dense GPS array: implication for plate
dynam-ics in convergent boundaries. In: Dixon, T., and Moore, C.
(Eds.), The Seismogenic Zone of Subduction Thrust Faults.
New York (Columbia University Press), 512–539.
Hyndman, R.D., Wang, K., and Yamano, M., 1995. Thermal
con-straints on the seismogenic portion of the southwestern
Japan subduction thrust. J. Geophys. Res., 100:15373–15392,
doi:10.1029/95JB00153.
Kinoshita, M., Kanamatsu, T., Kawamura, K., Sibata, T., Hamamoto,
H., and Fujino, K., 2008. Heat flow distribution on the floor of Nankai Trough off Kumano and implications for the
geo-thermal regime of subducting sediments. JAMSTEC Rep.
Res. Dev., 8:13–28.
Kinoshita, M., Moore, G., von Huene, R., Tobin, H., and Ranero, C.R.,
2006. The Seismogenic Zone Experiment. Oceanography,
19(4):28–38.
Kinoshita, M., Tobin, H., Ashi, J., Kimura, G., Lallemant, S., Screaton,
E.J., Curewitz, D., Masago, H., Moe, K.T., and the Expedition
314/315/316 Scientists, 2009. Proc. IODP, 314/315/316,
Washington, DC (Integrated Ocean Drilling Program
Management International, Inc.), doi:10.2204/iodp.
proc.314315316.134.2009.
Moore, G.F., Bangs, N.L., Taira, A., Kuramoto, S., Pangborn, E., and Tobin, H.J., 2007. Three-dimensional splay fault geometry
and implications for tsunami generation. Science,
318(5853):1128–1131. doi:10.1126/science.1147195. Moore, G., Park, J.-O., Bangs, N.L., Gulick, S.P., Tobin, H.J.,
Nakamura, Y., Saito, S., Tsuji, T., Yoro, T., Tanaka, H., Uraki, S., Kido, Y., Sanada, Y., Kuramoto, S., and Taira, A., 2009. Structural and seismic stratigraphic framework of the NanTroSEIZE Stage 1 transect. In: Kinoshita, M., Tobin, H., Ashi, J., Kimura, G., Lallemant, S., Screaton, E.J., Curewitz, D., Masago, H., Moe, K.T., and the Expedition 314/315/316
Scientists, Proc. IODP, 314/315/316. Washington, DC
(Integrated Ocean Drilling Program Management
International, Inc.), doi:10.2204/iodp.proc.314315316.
134.2009.
Moore, G.F., Taira, A., Klaus, A., et al., 2001. Proc. ODP, Init. Repts.,
190. College Station, Texas (Ocean Drilling Program),
doi:10.2973/odp.proc.ir.190.2001.
Park, J.-O., Tsuru, T., Kodaira, S., Cummins, P.R., and Kaneda, Y., 2002. Splay fault branching along the Nankai subduction
zone. Science, 297(5584):1157–1160. doi:10.1126/
science.1074111.
Screaton, E., Saffer, D., Henry, P., and Hunze, S., 2002. Porosity loss within the underthrust sediments of the Nankai accretionary complex: implications for overpressures.
Geology, 30(1):19–22. doi:10.1130/0091-7613.
Seno, T., Stein, S., and Gripp, A.E., 1993. A model for the motion of the Philippine Sea plate consistent with NUVEL-1 and
geological data. J. Geophys. Res., 98(B10):17941–17948.
doi:10.1029/93JB00782.
Tobin, H.J., and Kinoshita, M., 2006a. Investigations of
seismogene-sis at the Nankai Trough, Japan. IODP Sci. Prosp.,
NanTroSEIZE Stage 1. doi:10.2204/iodp.sp.nantroseize1. 2006.
Tobin, H.J., and Kinoshita, M., 2006b. NanTroSEIZE: the IODP
Nankai Trough Seismogenic Zone Experiment. Sci. Drill.,
2:23–27. doi:10.2204/iodp.sd.2.06.2006.
Wang, K., and Hu, Y., 2006, Accretionary prisms in subduction earth-quake cycles: The theory of dynamic Coulomb wedge.
J. Geophys. Res., 111(B6):B06410 doi:10.1029/2005 JB004094.
Zoback, M.D., Barton, C.A., Brudy, M., Castillo, D.A., Finkbeiner, T., Grollimund, B.R., Moos, D.B., Peska, P., Ward, C.D., and Wiprut, D.J., 2003. Determination of stress orientation and
magnitude in deep wells. Int. J. Rock Mech. Min. Sci.,
40(7–8):1049–1076. doi:10.1016/j.ijrmms.2003.07.001.
Authors
Harold Tobin, Department of Geoscience, University of
Wisconsin – Madison, 1215 West Dayton Street, Madison, Wis. 53706, U.S.A.
Masataka Kinoshita, Institute for Research on Earth
Evolution/JAMSTEC, Kanazawa-ku, Yokohama, Kanagawa 236-0001, Japan.
Juichiro Ashi, Ocean Research Institute, The University of
Tokyo, 1-15-1 Minamidai, Nakano-ku, Tokyo, 164-8639, Japan.
Siegfried Lallemant, Département des Sciences de la Terre
et de l’Environnement, Université de Pontoise, Cergy-Pontoise 95031 Cedex, France.
Gaku Kimura, Department of Earth and Planetary Science,
Graduate School of Science, The University of Tokyo, Tokyo, Japan.
Elizabeth Screaton, Department of Geology, University of
Florida, P.O. Box 112120, Gainesville, Fla. 32611, U.S.A.
Moe Kyaw Thu, Center for Deep Earth Exploration/
JAMSTEC, 3173-25 Showa-machi, Kanazawa-ku, Yokohama, Kanagawa 236-0001, Japan.
Hideki Masago, Center for Deep Earth Exploration/
JAMSTEC, 3173-25 Showa-machi, Kanazawa-ku, Yokohama, Kanagawa 236-0001, Japan.
Daniel Curewitz, Center for Deep Earth Exploration/
JAMSTEC, 3173-25 Showa-machi, Kanazawa-ku, Yokohama, Kanagawa 236-0001, Japan, now at: Department of Earth Sciences, Syracuse University, Syracuse, N.Y. 13244, U.S.A.
![Figure 6. [A] Inline PSDM seismic section through the mega-splay fault thrust sheet sites, showing total drilled depth at each site](https://thumb-eu.123doks.com/thumbv2/123dok_br/18247932.341954/6.892.352.826.108.1093/figure-inline-psdm-seismic-section-thrust-showing-drilled.webp)
![Figure 8 [A]. Site C0002 Results – Summary plots of major LWD logs for the full 1400-m interval drilled](https://thumb-eu.123doks.com/thumbv2/123dok_br/18247932.341954/8.892.66.826.608.1129/figure-site-results-summary-plots-major-interval-drilled.webp)
![Figure 8 [B]. Site C0002 – Summary of coring results for the two cored intervals at this site](https://thumb-eu.123doks.com/thumbv2/123dok_br/18247932.341954/9.892.65.600.505.1177/figure-site-summary-coring-results-cored-intervals-site.webp)
![Figure 8 [C]. Site C0002 – Biostratigraphic age determinations for the cored intervals, illustrating contrast between prism, slope drape, and forearc basin sediment accumulation timing and rates.](https://thumb-eu.123doks.com/thumbv2/123dok_br/18247932.341954/10.892.260.827.105.474/biostratigraphic-determinations-intervals-illustrating-contrast-forearc-sediment-accumulation.webp)