www.drink-water-eng-sci.net/3/29/2010/
©Author(s) 2010. This work is distributed under the Creative Commons Attribution 3.0 License.
Engineering and Science
Open Access
Rapid evaluation of water supply project feasibility
in Kolkata, India
K. Dutta Roy1, B. Thakur2, T. S. Konar3, and S. N. Chakrabarty3 1Kolkata Metropolitan Water and Sanitation Authority, Kolkata, India
2Meghnad Saha Institute of Technology, Kolkata, India
3Civil Engineering Dept., Jadavpur University, Kolkata, India
Received: 22 December 2009 – Published in Drink. Water Eng. Sci. Discuss.: 22 January 2010 Revised: 26 March 2010 – Accepted: 26 March 2010 – Published: 31 March 2010
Abstract. Mega cities in developing countries are mostly dependent on external funding for improving the civic infrastructures like water supply. International and sometimes national agencies stipulate financial jus-tifications for infrastructure funding. Expansion of drinking water network with external funding therefore requires explicit economic estimates. A methodology suitable for local condition has been developed in this study. Relevant field data were collected for estimating the cost of supply. The artificial neural network tech-nique has been used for cost estimate. The willingness to pay survey has been used for estimating the benefits. Cost and benefit have been compared with consideration of time value of money. The risk and uncertainty have been investigated by Monte Carlo’s simulation and sensitivity analysis. The results in this case indicated that consumers were willing to pay for supply of drinking water. It has been also found that supply up to 20 km from the treatment plant is economical after which new plants should be considered. The study would help to plan for economically optimal improvement of water supply. It could be also used for estimating the water tariffstructure for the city.
1 Introduction
Urban population in India is increasing rapidly. The number of cities with a population in excess of one million has in-creased from 23 in 1991 to 35 in 2001. Yet the services like safe drinking water to support these growing populations is lagging behind resulting, among other problems, a chronic shortage of safe drinking water. In Kolkata, water services are historically provided free of charge by the government and politicians are now unwilling to charge fees. In addition, majority of the Kolkata population are too poor to pay any tax at all. Revenues for the sector come from a share of the prop-erty tax (Ruet, 2002). Roy et al. (2003) reported that Kolkata Municipal Corporation grants about 75% subsidy to its water supply costs. As a result, internal resources are not available in the Kolkata to finance its water supply projects. Interna-tional agencies like World Bank, Asian Development Bank etc generally provide soft loans for such development. In countries like India, official policies generally support water
Correspondence to:B. Thakur ([email protected])
been applied to a water supply expansion plan for southern fringes of the city.
2 Methodology
Average use of water per person varies from community to community. In US, per capita water use may range from 189 to 1893 litres per day (AAWA, 1986). New York Times (2006) reports that even after a reduction of 28% of demand for increased awareness and stringent regulations per capita water use is about 500 l (136 US Gal) in New York. The In-dian building code assumes a minimum water supply of 200 l per capita per day (NBC, 1983) and the government specifies minimum 150 l per capita per day of water supply (CPEEHO, 2008). However, Singh et al. (2003) and Zerah (2003) both found that only about 27 l per capita per day is the actual con-sumptions of water in the poorer areas of Varanasi and New Delhi, India respectively. Similar water use values are also expected in slums of Kolkata. There is a growing pressure for increasing water supply in Kolkata. Expansion of water supply network would demand funding mainly from interna-tional agencies that require cost benefit analysis (CBA). The present methodology is proposed for such cases.
Explicit CBA for water supply projects are not new. Hanke and Walker (1974) criticized the CBA of a US federal gov-ernment project executed in 1967 and pointed out a num-ber of anomalies. Water supply CBA reports are often sub-jected to such criticism mainly because the analysis is al-most always a complicated process. Mathematical program-ming for cost allocation in water supply projects is also not new. Young et al. (1980) published detailed treatment of lin-ear programming, game theory and shapely values for water resources cost allocation among Swedish municipalities.
Efforts have been made over time to standardize the CBA. For example, Office of Management and Budget (OMB) in US has issued guidelines for CBA and risk assessment (Kopp et al., 1997). The paper offers a number of suggestions to reg-ulatory agencies in conducting CBA, drawing on the “best practices” identified in guidelines issued by the OMB. These include the use of clear and consistent baseline assumptions; the evaluation of an appropriately broad range of policy al-ternatives, including alternatives to new regulation; appro-priate treatment of discounting future benefits and costs and accounting for the cost of risk-bearing; the use of probabilis-tic analyses and other methods to explore the robustness of conclusions and the use of benefit and cost measures that are grounded in economic theory. They found that estimates of the willingness to pay for reductions in mortality and mor-bidity risks and for avoiding environmental damage consti-tute the most-successful activities in the field of valuation.
European Union started TECHNEAU, an integrated project funded by the European Commission and conducted by a consortium of universities, research institutes and con-sultants (Baffoe-Bonnie et al., 2006). One of the mandates
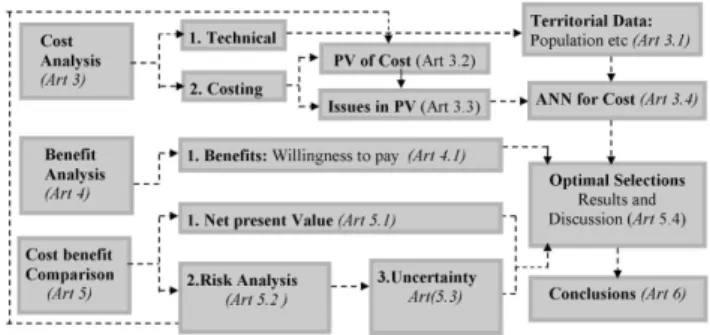
Figure 1.Flow diagram of the cost benefit analysis.
was to develop and demonstrate CBA and supply system op-tions including practices for risk management. These tech-nologies and management practices will enable end-users to make informed choices, appropriate to their own circum-stances and constraints, for cost-effective and sustainable source-to-tap solutions for the provision of safe high qual-ity drinking water that has the trust of the consumer. They investigated the utility of CBA for evaluation of the options implemented at end-user sites to make improvements to the water supply systems. They also recommended economic valuation, decision criteria and risk management in CBA. In addition, they emphasized on sensitivity analysis to evaluate the potential effects of key uncertainties in the decision mak-ing process.
Similar to US administration European Union published guides for CBA (Florio, 2006). Industry specific guidelines including integrated water supply scheme have been pro-vided. It has advises for steps like collection of territorial data, option analysis, financial analysis, economic analysis, evaluation criteria, risk and sensitivity analysis etc. In ad-dition, it has examples for demand calculations, inflation, present value, quantification of costs and benefits etc. The efforts for development of standardized guidelines for CBA have been studied. There are three separate areas of inves-tigations namely cost analysis, benefit analysis, and benefit-cost comparisons including risk studies that are required for economic evaluation. A block diagram showing the process of evaluation has been presented in Fig. 1. Each of the step presented in the block diagram has been discussed in the fol-lowing.
3 Cost analysis
3.1 Territorial data
Table 1.Water supply network details.
Sl. No Booster Station Name Tributary Present Tank Present Supply Possible Possible Supply
Population (000) Capacity (MG) Capacity (MGD) Expansion (MG) Increase (MGD)
01 GRWW direct 579.6 NA 60.00 NA 0.00
02 Behala 550.9 3.50 9.00 3.50 9.00
03 Maheshtala 236.1 5.00 10.00 5.00 10.00
04 Ranikuthi 241.3 3.50 7.00 3.50 7.00
05 Garfa 185.9 3.50 7.00 3.50 7.00
06 Kalighat 319.7 4.00 8.00 4.00 8.00
07 Bansdroni 122.7 2.00 4.00 2.00 4.00
08 Pujali 34.7 0.70 2.10 0.70 2.10
09 Akra (Plan) 230.0 0.00 0.00 6.00 18.00
10 Daspara (Plan) 130.0 0.00 0.00 4.00 12.00
Total 2630.9 22.20 107.10 32.20 77.10
Figure 2.Water supply network.
the present system. The water supply network consisting of GRWW and booster pumping stations is presented in Fig. 2. A part of the water from GRWW is directly fed into the con-sumers’ network. There are seven existing booster pumping stations and additional two stations have been planned.
The sizes, service areas and operating costs of the booster pumping stations are estimated from GRWW records and are presented in Table 1. A study has been conducted for assess-ing the additional quantities of water that can be supplied from the existing stations by upgrading the system. The re-sulting expansion limits of the booster pumping stations have also been presented in Table 1.
3.2 Present value of cost
Cost estimation generally involves predicting land, labour, material, utilities and other costs over time. An estimate can be made by various methods like proration estimate, capacity
cost curve, equipment ratio or unit rate method. In this case, the unit rate method has been used for estimating costs. Each of the facility has two major costing components namely cap-ital cost and operating cost. Existing cost data have been col-lected from GRWW planning and accounting records. The details of capital and operating costs are presented in Tables 2 and 3 respectively.
The investment for a project is spread through out its life span. The investments are discounted to its present value for normalizations of the different time factors in the following manner.
C=
t
X
t=0
Cn
(1+i)t (1)
Where,C=Present value,Cn=Investment at yeartandi=
Discount rate at yeart.
The present value of the stream of cash outflows presented in Tables 2 and 3 that are required for setting up and opera-tion of the booster pumping staopera-tions for the GRWW network can be estimated in the following manner.
C p=
L
P
t=1
Ct (1+i)t
Lc
P
t=1 Qt
+
L
X
t=1
Ot
Qt
(1+i)t (2)
WhereC p=Present value of cost in INR/kl,Ct =Capital
costs in INR incurred at yeart,Ot=Operating costs in INR
incurred at yeart,Qt=Quantity of water in kl generated at
yeart, L=Expected life of the facilities andi =Discount rate at yeart.
Table 2.Details of capital costs.
Installation Commencement Land Area Civil Cost Electro-Mech. Cost
(sqm) (INR Mil.) (INR Mil.)
GRWW Plant 1981 231000 660 130
Garfa UGR 2003 6070 122 40
Bansdroni UGR 2004 4280 85 25
Pujali UGR 2007 4280 78 10
Kalighat UGR 2003 100000 260 50
Ranikuthi UGR 2003 9000 125 40
Behala UGR 1007 12000 71.5 21
Mahestala UGR 2003 10000 70 15
Acra UGR 2010 12456 180 40
Daspara UGR 2010 4367 86 27
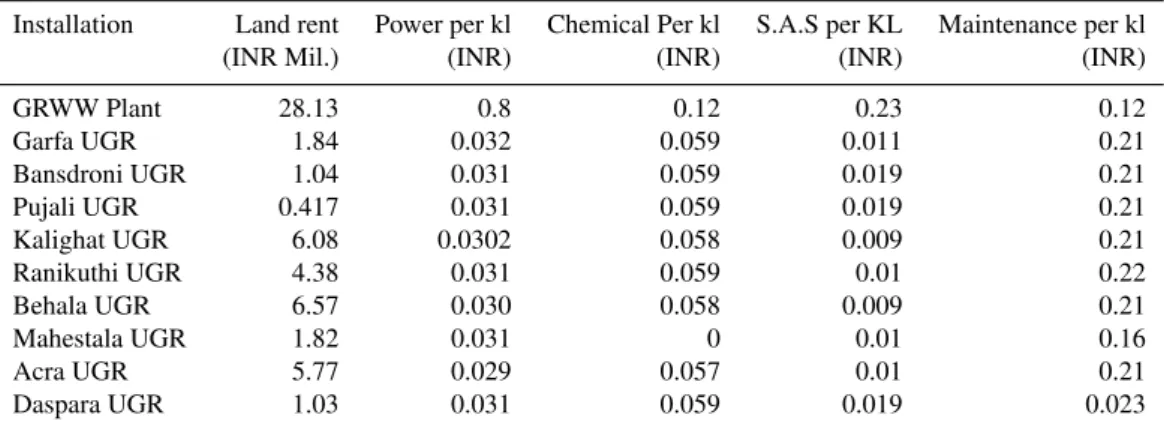
Table 3.Typical details of operating costs.
Installation Land rent Power per kl Chemical Per kl S.A.S per KL Maintenance per kl
(INR Mil.) (INR) (INR) (INR) (INR)
GRWW Plant 28.13 0.8 0.12 0.23 0.12
Garfa UGR 1.84 0.032 0.059 0.011 0.21
Bansdroni UGR 1.04 0.031 0.059 0.019 0.21
Pujali UGR 0.417 0.031 0.059 0.019 0.21
Kalighat UGR 6.08 0.0302 0.058 0.009 0.21
Ranikuthi UGR 4.38 0.031 0.059 0.01 0.22
Behala UGR 6.57 0.030 0.058 0.009 0.21
Mahestala UGR 1.82 0.031 0 0.01 0.16
Acra UGR 5.77 0.029 0.057 0.01 0.21
Daspara UGR 1.03 0.031 0.059 0.019 0.023
costs that are summarized in Tables 2 and 3 have been ef-fected with inflation impact for the projects’ life span. Equa-tion (2) is then modified for inflaEqua-tion as shown in Eq. (3).
C p=
L
P
t=1
Ct(1+r)t (1+i)t
Lc
P
t=1 Qt
+
L
X
t=1
Ot(1+r)t
Qt
(1+i)t (3)
Whereris the annual rate of inflation in yeart.
In such present value estimates, the discount factor i is one of the most important deciding factor for selection of a project. Since the civil engineering structures have a long life span the input values in Eq. (3) is difficult to estimate and can not be decided with certainty. The discount factors including project life span have been discussed in Sect. 3.3.
The existing technical details like drawings and specifica-tions of each of the booster pumping staspecifica-tions including the GRWW have been collected. The feasibility of doubling the capacity of each of the facilities were evaluated and the limit is presented in Table 1. There were three options for ex-pansions namely extension of tank, increasing pumping
ca-pacities and increasing pumping schedule for expanding the water supply capacity. Combinations of the three are also considered. The unit cost rates that are presently in use in the locality have been applied to the bill of materials to ar-rive at the capital cost estimates as presented in Table 2 for increasing the water supply capacities. The values presented in Table 3 have been used for estimating the operating costs for expansion of the water supply network. The relationship presented in Eq. (3) has been used to compress the stream of capital and operating cash outflows to its present value for each kilo litre of water.
3.3 Issues in present value estimate
in 1911 is still in use (KMWSA, 2009). Stillman (2004) estimated that most public project structures have an esti-mated life span of 60 to 120 years. British code of prac-tice for bridges, BS5400 specifically expects a service life of 120 years. The channel tunnel in UK specified a service life of 120 years (Rostam, 2006). Jaspers (2008) guidelines for EU countries suggest the life span of civil engineering and electro-mechanical facilities of water treatment plants as forty and fifteen years respectively. Florio et al. (2006) suggested 30 years as the time horizon for CBA for water supply network in EU countries. The service life generally expected from a standard RCC building is about 75 years (Rostam, 2006). Considering the various suggestions in the literature a life span of 75 years for civil structures and 15 years for electro-mechanical facilities have been assumed for the present CBA.
Inflation has almost become an integral part of the eco-nomic estimates. Jaspers (2008) specifically included infla-tion in CBA. Florio et al. (2006) suggested inflainfla-tion correc-tions for both cost and tariffsides of the cash flows. They provided country specific rates and mentioned inflation as a critical factor for risk analysis. Canadian guidelines used consumer price index to reflect inflation (Canada, 2007). Kopp et al. (2007) advised to include inflation during the risk analysis for CBA in USA. Green (2003) suggested to deduct the effect of inflation from benefit and cost cash flows in CBA. In this study, consumers’ price index as reported in RBI (2009) bulletins has been used for inflation. The long-term distribution assumed for this study is presented in Ta-ble 6.
The discount rate in Eq. (3) is used to compress a stream of future benefits and costs into a single present value amount. Thus, present value is the value today of a stream of pay-ments, receipts, or costs occurring over time, as discounted through the use of an interest rate. The discounting rule for public projects is based on the Social Time Preference Rate (STPR). It is used for discounting future benefits and costs, and is based on comparisons of utility across differ-ent points in time or differdiffer-ent generations. The rate has sev-eral components namely pure time preference, inflation and long term risks like war or technical obsolescence. A num-ber of economists like Marglin (1963), Sen (1967), Baumol (1968), Mishan (1976) etc. investigated about STPR with re-lation to factors like savings rate, intergenerational equity, opportunity cost of public investment etc. Marini (1999) and Weitzman (1998) investigated the impact of intergener-ational equity on STPR. The theoretical framework for es-timating STPR is still under scrutiny particularly for issues like global warming, radioactive disposal etc. For example, Nordhaus (1999) discussed about two different STPR, one for the advanced countries and the other for developing coun-tries in connection with the projects related to Kyoto proto-col. Creedy (2007) suggested a sensitivity analysis of so-cial discounting rate in lieu of a single value in cost benefit analysis.
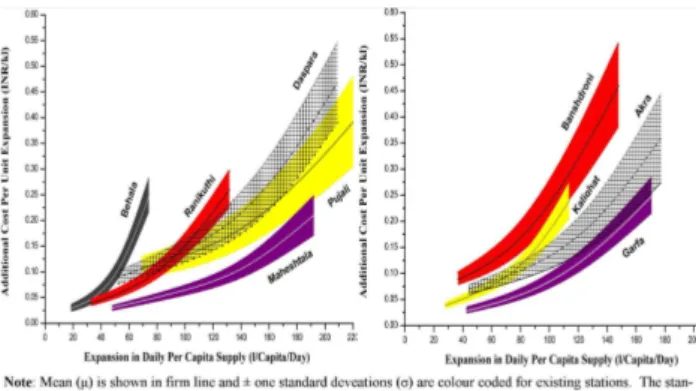
Figure 3.Capacity-Cost curves for booster pumping stations.
In practice, investigators used varieties of rates while eval-uating the environmental control projects. In UK, public projects are evaluated as per provisions of “Green Book” for STPR. In earlier editions like in 1989, the rate was estimated to about 6%. However, it has been now adjusted to 3.5% (HM Treasury, 2003). It indicates that future benefits for environmental protection are presently given more weigh-tage in UK. While estimating the cost-benefit of metro lines in New Delhi, India the STPR was assumed as 8% (Murty et al., 2006). Boscolo et al. (1998) presented a list of dis-count rates used in many dis-countries for environmental control project. The rate varied from 0 to 10%. However, a rate of about 6 to 7% was selected in most of these studies. The rate of STPR for the present study is also taken as 7%.
Many of the inputs for estimating cash out flows do not have a definite value. For example, the STPR value may vary from 6 to 8% in Indian condition. The resulting esti-mates for cost would also vary. Monte Carlo’s Simulation detailed in Sect. 5.2 is one of the standard methods for esti-mating the statistics of the output in such cases. In this case, Palisade @risk software (DTS, 2009) has been used to sim-ulate the Eq. (3) for estimating the present value of cost and itsσfor each kilo litre of water for different supply ranges. Triangular distributions of inflation and STPR as presented in Table 6 have been assumed for simulation. The cost esti-mates similar to values presented in Tables 2 and 3 that are derived from bill of quantities have been used for estimating the present value of cost. Such estimated present values have been used for developing the capacity-cost relationship of the water supply expansion for nine numbers booster pumping stations and is presented in Fig. 3. The mean (µ) and the range of one standard deviation (σ) estimated from the sim-ulation are presented in Fig. 3 for each booster station.
3.4 Artificial neural network for costing
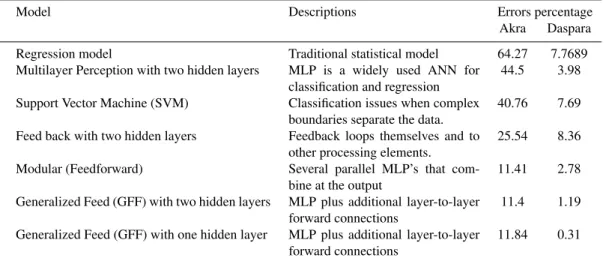
Table 4.Performance of ANN at various options.
Sl Model Descriptions Errors percentage
Akra Daspara
1 Regression model Traditional statistical model 64.27 7.7689
2 Multilayer Perception with two hidden layers MLP is a widely used ANN for classification and regression
44.5 3.98
3 Support Vector Machine (SVM) Classification issues when complex
boundaries separate the data.
40.76 7.69
4 Feed back with two hidden layers Feedback loops themselves and to
other processing elements.
25.54 8.36
5 Modular (Feedforward) Several parallel MLP’s that
com-bine at the output
11.41 2.78
6 Generalized Feed (GFF) with two hidden layers MLP plus additional layer-to-layer forward connections
11.4 1.19
7 Generalized Feed (GFF) with one hidden layer MLP plus additional layer-to-layer forward connections
11.84 0.31
Note: The present value of cost for Akra: INR 1.84/kl and Daspara: INR 2.51/kl.
required to be developed which is expensive and time con-suming. Therefore, statistical approaches have been investi-gated for developing a rapid cost estimating routine. It has been hypothesized that land rent, serving population and the distance from GRWW should be the major factors contribut-ing towards the unit costs described in Fig. 3.
In order to develop an empirical relationship among these major factors a multivariate regression model has been at-tempted. The capacity-cost data of the seven numbers ex-isting booster stations which is presented in Fig. 3 has been used to generate a best fit regression equation. The devel-oped relationship is used to estimate the costs for the two planned stations namely Akra and Daspara. The statistical and technical estimates of costs for the two planned stations namely Akra and Daspara are compared and the errors have been found to be 64.27% and 7.76% respectively. It is felt that further improvement of the model is essential for its ef-fective use.
Artificial neural network (ANN) is lately found to be a promising technique for predicting complex nonlinear rela-tionships. The ANN is a mathematical model of theorized brain activity which attempt to exploit the massively par-allel local processing and distributed storage properties be-lieved to exist in the human brain (Zurada, 1992). Adeli (2001) chronicled a number of ANN applications in civil and water resources engineering. Boussabaine (1996) reviewed application of ANN in construction management. Leo’n et al. (2000) proposed ANN for water network management. Jain et al. (2001) used ANN for water demand forecasting of a college campus in India. Adeli and Wu (1998) used ANN for construction cost estimating. Smith and Mason (1996) compared performance of regression and ANN techniques for predictive cost analysis models. Cavalieri et al. (2004) compared performance of parametric and ANN cost models
in a production unit. Boussabaine and Kaka (1998) applied ANN for cost flow forecasting in a construction setting. The literature indicate that the ANN could be an useful tool for predictive cost modelling for the present case.
The capacity-cost relationships of the existing booster pumping stations which are presented in Fig. 3 have been used to train an ANN model for cost estimation with the help of NeuroSolutions software (NeuroDimensions, 2009).
Different network conditions have been attempted in ANN analysis to identify the optimum condition for the present case. The networks at different conditions have been trained using four independent variables namely, tributary popu-lation (numbers), supply capacity (kl/day), distance from GRWW (km) and land rent (INR/yr) against paramet- ri-cally estimated cost values (INR/kl) of the existing booster pumping stations. The percent difference between ANN and parametric estimates of Akra (Cost INR 1.84/kl) and Daspara (Cost INR 2.51/kl) booster stations for each option are com-pared in Table 4.
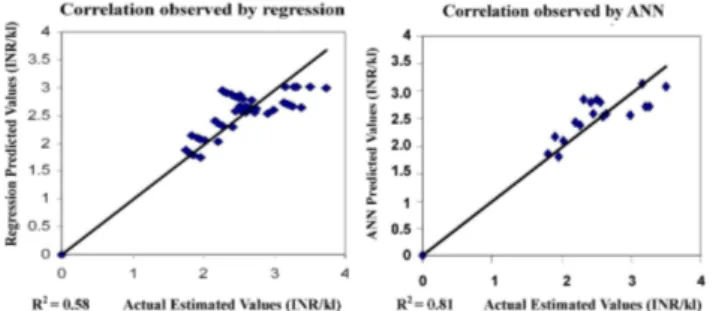
Figure 4.Correlation coefficient (R2) for estimated prediction and actual values.
Other conditions are also identical as that of first case. The serial 5 is Modular feedforward network with two hidden lay-ers, and in either hidden layer, the upper and lower branch TF being tanh, where as that in out put being linear. Momentum learning rule was applied. Other conditions are same as in serial 1. In serial 6, the GFF neural network with two hidden layers was used. The hidden layers are having tanh as TFs and the out put layer is having liner TF. In serial 7, GFF with one hidden layer was used. The hidden layer is having tanh as TF and the out put layer is with liner TF. The rest of the conditions are same as the first case.
The costing data for planned booster stations namely Akra and Daspara have not been included for training of the net-work. The results for each option of ANN have been com-pared with Akra and Daspara costing data and the errors between the estimated and ANN data are presented in Ta-ble 4. The option in serial 7 seems to have the least errors and deems to be the optimum ANN for predicting the cost-ing data. It has been selected for prediction of the cost. The technical estimates and actual values have been regressed in Fig. 4 and the correlation coefficientR2has been found to be 0.58. The selected ANN predicted costs and the actual values have also been compared in Fig. 4 andR2has been found to be 0.81. It has been decided that ANN predicted costs rea-sonably predict the technical estimates for booster pumping stations in GRWW network.
The selected ANN has been used to estimate the cost (INR/kl) of water supply for a number of combinations of the input variables namely, tributary population, supply ca-pacity, distance from GRWW and land rent and the results have been presented in Fig. 5. The trend and interrelationship of the data can be reviewed in Fig. 5. It may be noted that for a given serving population of say five hundred thousands, the cost fabric generated by land rent and distance from GRWW is mildly increasing in most combinations except at the cor-ners where the cost is rapidly changing for a small change in distance from GRWW. In other words, there is a boundary zone where the water supply cost shall be reasonably opti-mum. The maximum distance of the booster station seems to be about 20 km within which the supply cost shall remain optimum.
Figure 5. Relationships among cost, land rent, distance from GRWW and Tributary population.
4 Benefit analysis
4.1 Willingness to pay
Willingness to pay or contingent valuation is a method of estimating the non market value of environmental amenities such as the value of safe drinking water. These values are measured based on the willingness to pay of the consumers for improved environment. In this case, the benefit of the project is assumed as the monetary value of WTP derived from the survey. The interesting aspect of the contingent val-uation method is that it allows to estimate total value rather than components of that value. The method is appropriate and well known for valuation of environmental amenities.
4.2 Willingness to pay studies
United Nations Conference on the Environment and Devel-opment held in Rio de Janeiro in 1992 (UNCED, 1992), ad-dressed the need for an integrated management of water re-sources. It was stated that water should be regarded as an economic good. At the Second World Water Forum held in Hague in 2000, it was resolved that the resource value should be recognised in water management decisions. Use of WTP survey for valuing water resources has been recommended by many researchers (Agudelo, 2001).
The demand for environmental quality is often presumed to be low in developing countries due to poverty. Jalan and Somanathan (2004) conducted a WTP survey in New Delhi, India to estimate the effects of awareness on home water pu-rification. Average costs of different home purification meth-ods are used to get estimates on willingness to pay for better drinking water quality. They found that measures of aware-ness such as schooling and exposure to mass media have sta-tistically significant effects on adoption of different home pu-rification methods and therefore, on willingness to pay. In a World Bank sponsored workshop (UTT, 2002) it was re-solved that WTP surveys are appropriate and would be the most suitable method for estimating demand for water sup-ply services for urban India.
135 per month to informal entities for purchasing water for each household. It is considerably higher than that of the higher income group. But one has to be very careful before converting this amount into willingness to pay. Despite pay-ing high charges the household may not accept to pay “offi-cially” for a better service. The dwellers seem to be of the opinion that the government should act to provide them water free of charges because of their low income status.
Katz and Sara (1997) studied seven World Bank spon-sored rural water supply schemes in poorer countries span-ning across three continents. The study has found that large gaps often exist between the perceptions of households and the community leaders with which project staffor interme-diaries work. It has also found that quality improves when projects employ trained staffto ensure that all members of the community have the opportunity to participate in the decision-making process. The study has showed that users have a strong preference for house connections and there was a strong willingness to pay the additional costs of these con-nections. The willingness to pay varies depending upon the method of supply.
Oca et al. (2003) conducted a WTP survey for water sup-ply in Mexico City. They have observed that poorer house-holds are primarily concerned with securing reliable ser-vices, while wealthier households, which already enjoy bet-ter services, offer higher WTP amounts to avoid service dete-rioration. They have proposed a method to use WTP to create equity based policy of water tariffs reflecting income distri-bution. The aggregated WTP amounts show that the author-ities could collect sufficient resources for both service mod-ernisation and could also reduce existing subsidies by about 70%. Remaining subsidies could be targeted on households with lower income levels.
Kaliba et al. (2003) analyzed willingness to pay survey to improve community-based rural water in Tanzania. An estimate of willingness to pay provides an indication of the demand for improved services and potential for them being sustainable. They also advised to ensure that disadvantaged community members should not suffer unduly from increases in tariffor fees.
Islam et al. (1994) in course of a study at Dhaka, Bangladesh proposed that affordability combined with will-ingness to use leads to willwill-ingness to pay. They have found that low reliability, poor service, institutional obstacles, man-agerial problems and lack of awareness are among the com-pelling causes for low “willingness to pay/use”.
Soheil (2004) has studied about tariffwith special attention to poor in developing countries found that WTP surveys are expensive and time consuming. Its principal value is insight into the propensity to connect on the part of those groups currently without a piped supply. This propensity would be only otherwise available from attempts to extend supplies into new areas.
Zerah (2002) conducted a WTP survey for water supply in Vijayada, India. About 60% of the surveyed population
opted to pay for 40 to 60 INR per month for each household for water. There are no significant differences in WTP be-tween the number of hours of supply, the perception of pres-sure and the city zones etc. Singh et al. (2003) conducted a WTP survey in Varanasi, India. They also found that about 62% of the surveyed population were willing to pay about 40 to 60 INR per month for each household for water.
A literature search has revealed four numbers of studies in recent times for WTP survey 5 for drinking water in Kolkata. Each of these studies are presented in the following. World Bank (2001) conducted the first WTP study for drinking wa-ter in Kolkata in connection with the approval of a loan to-wards a water supply expansion project. The study also sur-veyed socio economic aspects like water source, education, income level, housing condition etc. The monthly WTP per family varied widely from INR 54 for dwellers of multisto-ried buildings to INR 16.6 for slum dwellers.
Roy et al. (2003) conducted a WTP survey in a sample of 240 household in Kolkata for safe drinking water. The survey showed striking disparity in the economic status of the residents. The incomes varied from INR 2000 to over INR 100 000 per month while majority of slum dwellers’ in-come was less than INR 5000 per month. The large varia-tion of income also reflected on WTP which varied within a wide range of INR 0.0023/l to INR 1.06/l of purified water. They found that spending power of households and educa-tional background are important determining factor in WTP. Guha (2007) conducted a WTP survey for water supply in Kolkata. He found large variation of income among the re-spondents. In his survey, the family income varied 20 from under INR 5000 in slum areas to above INR 40 000 among apartment dwellers. The variation of income also caused variation in WTP. The mean of WTP in slum areas and apart-ment housings were INR 0.45 and INR 2.25 respectively. He estimated the mean WTP for water supply in Kolkata as INR 11.70 per kl of water. The study included high and low income groups but the medium income groups consist-ing about 33% of the population and mostly livconsist-ing in small houses have not been included. The result would be probably biased towards the higher sides for exclusion of this group.
Table 5.Comparisons of WTP Studies for Water Supply in Kolkata.
Study Year Willingness to pay Comments
Ave INR/Mo/House INR/kl
World bank 2001 – INR 3.63
Roy et al. (2003) 2003 168.72 INR 9.37 High range in simulation
Mazumdar and Gupta (2009) 2006 59.68 INR 3.18 Low range in simulation
Guha (2007) 2007 156.35 INR 11.70 Note 1
Present Study 2007 87.13 INR 4.83 Mean in simulation
Note 1: The study included high income and slum areas but did not exclude medium income group which would constitute about 33% of household.
supply of drinking water in Kolkata as described in the fol-lowing section.
4.3 Willingness to pay estimate
A WTP survey was conducted in Kolkata in May 2008. The surveyors visited the households and interviewed an earning member of the family. About 326 households were covered in the survey. A stratified sampling method has been em-ployed for the selection of households. The slum dwellers as well as the apartment dwellers were surveyed.
World Bank (2001) in connection with the WTP survey, estimated the average value of monthly household income in Kolkata as INR 6628 in 2001 price level. The value is ad-justed according to consumers’ price index in Kolkata (RBI, 2009) to accommodate annual inflations. The inflation cor-rected mean household income in 2008 price level is esti-mated as INR 8748. The mean monthly household income of the presently surveyed sample is INR 8583 which is about two percent less than the estimated mean of INR 8748. It is therefore decided that the presently surveyed samples are representative of the average monthly income aspect of the Kolkata households.
The WTP questionnaire had two broad divisions. The first part included the different socio economic status of the re-spondent such as the monthly family income, educational qualification of all the members of the family, occupation, number of family members, ownership status of the resi-dence, availability of municipal water within the premises etc. In the second part, the respondents were asked about the maximum monthly amount they would be willing to pay for the supply of filtered drinking water in their residences.
The literatures about the WTP survey recognize the fact that some subjects may not agree to pay and has developed methods to manage such protest variables. Similar cases have been found in this case. Some of the subjects stated about their financial inability to pay any tax at all. Some did not accept the idea of a separate fee in addition to property tax. About twenty five percent of the surveyed population did not accept the idea of a separate water fees in addition to property tax. These responses were recorded as nil which
has reduced theµand increased theσof WTP. However, the mean should accurately reflect the present status in Kolkata.
The WTP survey conducted under this study is compared with other WTP surveys recently executed in Kolkata and are summarized in Table 5. The results vary considerably which are not uncommon for WTP studies. For the pur-pose of CBA, the upper and lower values of these studies have been utilized as ranges as shown in Table 6. The mean WTP is assumed as INR 87.13 per month per household as found from the present survey. The highest range is assumed as INR 168.72 per month per household as found by Roy et al. (2003). The lowest range is assumed as INR 59.68 per month per household as found by Mozumdar and Gupta (2009). The differences of findings are accommodated in simulation. A triangular distribution has been assumed with a mean of INR 87.13 and the ranges INR 59.68 to INR 168.72 for the Monte Carlos’ simulation routine.
5 Benefit cost comparison
5.1 Net present value
The present value of the cost is shown in Eq. (3). The net present value of the project which is the difference between the benefit and cost of the water supply project is presented in Eq. (4).
NPV= 75
X
t=1
W0(1+r)t (1+i)t −
L
P
t=1
Ct(1+r)t (1+i)t
Lc
P
t=1 Qt
+
L
X
t=1
Ot(1+r)t
Qt (1+i)t
(4)
Table 6.Parameters for the simulation.
Sl Symbol Item Unit Variation of data
High Average Low
1 W0 WTP INR/kl 9.37 4.83 3.18
2 Cost INR Mean and standard deviations are
derived for ANN for each case
3 r Inflation rate % 7 6 5
4 i Discount rate % 8 7 6
5.2 NPV and risk analysis
The purpose of risk analysis is to estimate the probability that the project performances will fall below the design esti-mate (ADB, 1999). It further specifies that decision should be taken at an early stage of analysis whether to include a risk analysis in the appraisal. Monte Carlo’s simulations (MCS) have been used in different types of CBA of water supply projects. For example, Whittington et al. (2004) ap-plied MCS for CBA of a water supply project for the poor in Kathmandu, Nepal. Zhang (2009) used MCS for assess-ing the strategic risk of water supply network in Sassess-ingapore. In the CBA guide of Canada (Canada, 2007), MCS has been specifically recommended in the regulatory proposal. CBA guidelines for EU (Jasper, 2008) also made risk and sensitiv-ity analysis mandatory in their reports. MCS performs risk analysis by building models of possible results by substitut-ing a range of values based on probability distribution. It then calculates results over and over, each time using a dif-ferent set of random values from the probability functions. A MCS could involve thousands of recalculations before it is complete. MCS produces distributions of possible outcome values.
The meanσand of NPV in Eq. (4) are estimated by MCS. Palisade @risk software (DTS, 2009) has been used to con-duct risk analysis based on Eq. (4) for assessing the variabil-ity of the outcome. The estimated present value of costs for various combinations of input variables like land rent, dis-tance from GRWW and serving population are estimated by ANN in Sect. 3.4 and the trend is presented in Fig. 5.
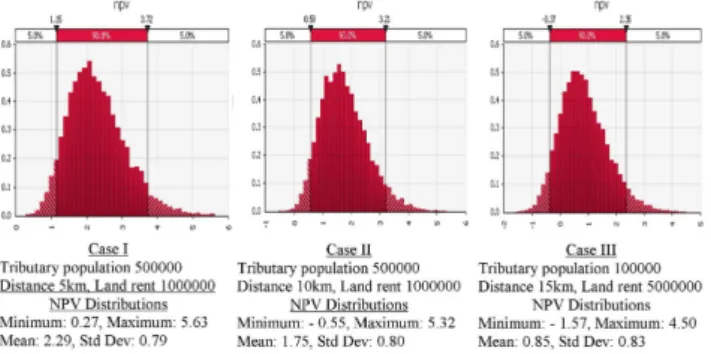
For MCS, ten thousands iterations have been conducted for each simulation run. MCS results of Eq. (4) for typi-cal three cases have been presented in Fig. 6 as examples. Theσof the present value of costs have been presented in Fig. 3. The mean andσhave been used as input for simula-tion of Eq. (4). The WTP estimates for drinking water sup-ply have been collected from various studies conducted in Kolkata. The WTP study presently conducted for this analy-sis has been used as the mean. Similar studies performed by other investigators as discussed in Sect. 4.3 have been used as ranges for a triangular distribution of WTP. The ranges for triangular probability distributions of other factors that are required for input in Eq. (4) have been also estimated. The
Figure 6. Distributions observed in typical simulation runs for NPV.
inflation ranges has been estimated from government records (RBI, 2009). The STPR ranges have been estimated from lit-erature survey as presented in Sect. 3.3. The input value for MCS has been presented in Table 6. MCS of Eq. (4) has been conducted for estimations of mean andσof NPV.
The NPV values for a number of combinations of input variables namely land rent, serving population and distance from GRWW have been presented in Appendix A. It can be used for rapid estimate of the NPV of a proposed booster pumping station in the GRWW network from three basic in-formation like capacity, land rent and distance from the plant. Theσof NPV values for typical cases have been presented in the data table in Fig. 7. Further investigations about the variability of NPV have been carried out in the following ar-ticle.
5.3 Uncertainty
Figure 7.Net present values of typical cases.
(INSA, 2005). OECD (2006) suggested sensitivity study of NPV in CBA.
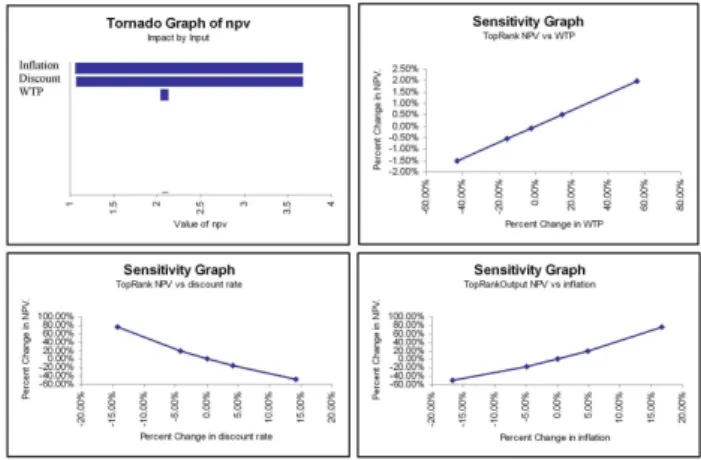
Sensitivity analysis is essentially a “What if” analysis in an iterative process. Each variable of the Eq. (4) namely WTP, ANN derived cost, inflation and discount rates are changed to a possible value and the resultant values of NPV are noted. The process is repeated many times. A set of data so gener-ated provides an idea about the input which has the largest effect on the result i.e. the NPV. In the present case, toprank software of the Palisade system (DTS, 2009) has been used to conduct the sensitivity analysis. The results of the sensi-tivity analysis are presented in Fig. 8. A standard “Tornado graph” for sensitivity analysis is presented. The inflation and discount rate is found to be much more significant than the WTP values. Individual sensitivity curves for WTP, discount rate and inflation have been also plotted in Fig. 8. It may be noted that only an increase of 15% of the inflation or dis-count rate would change NPV in the range of 80%. On the other hand, a change of 50% of the WTP value would affect the NPV less than 2%. The power series relations of discount rate or inflation over the NPV for a period of 75 years have made these many times more sensitive than the WTP values.
5.4 Results and discussion
The table in Appendix A would show that the NPV of a booster pumping station in GRWW network can be rapidly estimated from three input variables namely land rent, serv-ing population and distance from the GRWW. The classical cost estimating methods involving design, drawings and bill of materials may be replaced within the given assumptions by simple input variables. The chart in Appendix A (Table A1) may be directly utilized for estimating NPV of a proposed booster pumping station within the GRWW command area.
In order to show the trend of NPV, a few typical cases are presented in a bubble chart in Fig. 7. The diameter of a bubble represents the NPV in each case. It would show that the NPV values decrease weakly with respect to land rent and population. For example, comparisons between bub-bles 1 and 8 would show that NPV has reduced from 2.08
Figure 8.Sensitivity analysis.
to 1.83 i.e. about 10% for considerable changes in land rent and population. On the other hand, the NPV values decrease rapidly for increasing distance from GRWW. The bubbles 1 and 5 would show that NPV has reduced from 2.08 to 0.32 i.e. about 85% for a change in distance of 15 km. Figure 7 would indicate that the NPV tends towards zero after a dis-tance of about 20 km. It means that supply from GRWW is economical for a radius of about 20 km. Additional water treatment plants should be constructed to supply demands that are more than 20 km away from GRWW.
Theσof the NPV are estimated from simulation exercise. Some of the typical cases are presented in the data table in Fig. 7. It may be noted that theσis around 0.8 and the re-sultant coefficient of variations are considerably high which has a detrimental impact on the usability of the NPV results. The issue is investigated further with the sensitivity analysis. It is found that the NPV value is weakly dependent on the WTP values. Therefore detail investigations for WTP values would not be cost effective. In this case, the data is dependent on the inflation and discount rate. Again, these two factors are positively correlated because inflation itself is integrated to STPR. The inflation is thus the major source of uncertainty for the present methodology. The forecast of long-term infla-tion rate is a complex issue in economics and is beyond the scope of this paper.
6 Conclusions
Table A1.
GRWW Distance Tributary Land Rent Supply ANN Predicted NPV mean
(km) Population (INR) (kl/day) Supply Cost (INR/kl) (INR)
5 100 000 1 000 000 15 000 1.89 2.08
5 200 000 2 000 000 30 000 1.91 2.06
5 500 000 2 000 000 75000 1.85 2.12
5 500 000 5 000 000 75 000 2.04 1.93
10 100 000 5 000 000 15 000 2.66 1.31
10 200 000 5 000 000 30 000 2.65 1.32
10 500 000 5 000 000 75 000 2.46 1.51
15 100 000 2 000 000 15 000 3.11 0.86
15 200 000 1 000 000 30 000 3.01 0.96
15 500 000 1 000 000 75 000 2.86 1.11
20 100 000 1 000 000 15 000 3.76 0.21
20 200 000 1 000 000 30 000 3.65 0.32
20 200 000 5 000 000 30 000 3.75 0.22
20 500 000 2 000 000 75 000 3.47 0.50
25 100 000 5 000 000 15 000 4.46 −0.48
25 200 000 2 000 000 30 000 4.32 −0.34
25 500 000 5 000 000 75 000 4.2 −0.22
30 100 000 1 000 000 15 000 5.14 −1.16
30 200 000 2 000 000 30 000 5.01 −1.03
30 500 000 5 000 000 75 000 4.78 −0.80
expected that the presentR2 value of 0.81 would be further improved after more training of the ANN. The methodology has helped to reduce considerably the effort for a CBA study. It can be also used as a guide for fixing tariffstructure for water supply. The model is affected by the uncertainty as-sociated with the long term inflation rate of the economy. Therefore the model needs to be calibrated after a few years for practical use.
Edited by: H. van Dijk
References
Adeli, H.: Neural Networks in Civil Engineering: 1989–2000, Comput.-Aided Civ. Inf., 16, 126–142, 2001.
Adeli, H. and Wu, M.: Regularization Neural Network for Con-struction Cost estimation, J. Constr. Eng.-ASCE, 124, 1, 18–24, 1998.
Agudelo, J.: The Economic Valuation of Water Principles and Methods, Value of Water Research Rep. Series No. 5, http://www.unesco-ihe.org/content/download/415/5091/file/
Value%20of%20Water%20Research%20Report%20Series% 205%20The%20economic.pdf (last access: 13 January 2010), 2001.
American Water Works Association (AAWA): 1984 Water Utility Operating Data, Denver, CO, 1986.
(ADB) Asian Development Bank: Handbook for the Economic Analysis of Water Supply Projects, http://www.adb.org/
documents/handbooks/water supply projects/default.asp (last access: 30 March 2010), 1999.
(ADB) Asian Development Bank: Project No: 29466, India: Kolkata Environmental Improvement Project (Supplementary Loan), 2006.
(ADB) Asian Development Bank: Project No: 29466, In-dia: Kolkata Environmental Improvement Project Loan Agree-ment, 2007, http://www.adb.org/documents/legal-agreements/
ind/29466/29466-ind-lbj.pdf (last access: 30 March 2010), 2007.
Baffoe-Bonnie, B., Harle, T., Glenne, E., et al.: Framework For Op-erational Cost Benefit Analysis in Water Supply, TECHNEAU, contract number 018320, 2006.
Baumol, W.: On the Social Rate of Discount, The American Eco-nomic Review, 58, 4, 788–802, 1968.
Birta, L. and Arbez, G.: Modelling and Simulation Exploring Dy-namic System Behaviour, Springer-Verlag London, 2007. Boscolo, M., Vincent, J., and Panayotou, T.: Discounting Costs And
Benefits in Carbon Sequestration Projects, Environment Discus-sion Paper No. 41, Harvard Institute for International Develop-ment, 1998.
Boussabaine, H.: The use of artificial neural networks in construc-tion, Construction Management and Economics, 14, 427–436, 1996.
Boussabaine, H. and Kaka, A.: A neural networks approach for cost flow forecasting, Construction Management and Economics, 16, 471–479, 1998.
(Canada) President of the Treasury Board: Canadian Cost-Benefit Analysis Guide Regulatory Proposals, http://sciencepolicy. colorado.edu/students/envs 5120/CanadaCBA.pdf (last access: 30 March 2010), 2007.
study in the automotive industry, Int. J. Prod. Econ., 91, 2, 165– 177, 2004.
(CPEEHO) The Central Public Health and Environmental Engi-neering Organisation: Manual on Water Supply and Treatment, N. Delhi, India, 2008.
Chatterjee, N., Bhattacharya, N., and Halder, A.: Report on Socio-Economic profile of Household in Calcutta Metropolitan area: 1996–97, Kolkata Metropolitan Development Authority, 1997. Creedy, J.: Discounting and the Social Time Preference Rate,
Uni-versity of Melbourne, Department of Economics, Research Paper No. 989, 2007.
(DTS) Decision Tools Suite: Palisade Corporation, Ithaka, New York, USA, http://www.palisade.com/(last access: 13 January 2010), 2009.
Fellin, W., Lessmann, H., Oberguggenberger, M., et al.: Analyzing Uncertainty in Civil Engineering, Springer, Berlin, 2005. Florio, M., Finzi, U., Genco, M., et al.: Guide to cost-benefit
analy-sis of investment projects, Evaluation Unit, DG Regional Policy, European Commission, 2006.
Guha, S.: Valuation of Clean Water Supply by Willingness to Pay Method in a Developing Nation: A Case Study in Calcutta, In-dia, Journal of Young Investigators, 17, 4, http://www.jyi.org/
research/re.php?id=1295, 2007.
Green, C.: Handbook of Water Economics Principles and Practice, John Wiley & Sons Ltd, UK, 30, 177–201, 2003.
Hanke, S. and Walker, R.: Beneit Cost Analysis Reconsidered: An Evaluation of the Mid State Project, 10, 5, 898–908, 1974. HM Treasury: The Green Book Appraisal and Evaluation in Central
Government, London, 2003.
INSA-Lyon: Rehabilitation of water supply network in urban fields (CARE-WARP), 2005.
Jain, A., Varshney, A., and Joshi, U.: Short-TermWater Demand Forecast Modelling at IIT Kanpur Using Artificial Neural Net-works, Water Resour. Manag., 15, 299–321, 2001.
Jalan, J. and Somanathan E.: Awareness and the Demand for Envi-ronmental Quality II: Experimental Evidence on the Importance of Being Informed, JEL Codes 112, O10, Q53, Q56, 2004. Jaspers: Guidelines for Cost Benefit Analysis of Water
And Wastewater Projects to be Supported By The Cohe-sion Fund And The European Regional Development Fund in 2007–2013, http://discutii.mfinante.ro/static/10/Mfp/evaluare/
Water WasteWater GuideFINAL.pdf (last access: 30 March 2010), 2008.
Kaliba, A., Norman, D., and Chang, Y.: Willingness to Pay to Improve Domestic Water Supply in Rural Areas of Central Tanzania: Implications for Policy, http://www.uaex.edu/akaliba/
Documents/p03-∼3.pdf (last access: 30 March 2010), 2003.
Katz, T. and Sara, J.: UNDP – World Bank Water and Sanitation Program Making Rural Water Supply Sustainable: Recom-mendations from a Global Study, http://www-wds.worldbank. org/external/default/WDSContentServer/WDSP/IB/1998/11/
17/000009265 3981005112156/Rendered/PDF/multi page.pdf (last access: 30 March 2010), 1997.
(KMWSA) Kolkata MetropolitanWater and Sanitation Authority: Retrospect, http://www.kmwsa.gov.in/html/retros.html, last ac-cess: 13 January 2010.
Kopp, R. J., Krupnick, A. J., and Toman, M.: Cost-Benefit Analysis and Regulatory Reform: An Assessment of the Science and the Art, Discussion Paper 97-19, Resources for the Future,
Washing-ton, DC, USA, 1997.
Leo’n, C. Mart´ın, S., Elena, J. M., et al: EXPLORE–Hybrid Ex-pert System for Water Networks Management, J. Water Res. Pl.-ASCE, 126, 2, 65–74, 2000.
Llorente, M. and Zerah, M.: The urban water sector: Formal ver-sus Informal Suppliers in India, Urban India, Vol. XXII, No. 1, National Institute of Urban Affairs, January–June 2003. McIntosh, A.: Asian Water Supplies Reaching the Urban Poor,
Chapter 11, Asian Development Bank, http://www.adb.org/
documents/books/asian water supplies/(last access: 30 March 2010), 2003.
Marglin, S.: The Social Rate of Discount and The Optimal Rate of Investment, Q. J. Econ., 77, 1, 95–111, 1963.
Marini, G. and Scaramozzino, P.: Social Time Preference, J. Popul. Econ., http://www.soas.ac.uk/economics/research/
workingpapers/file28891.pdf (last access: 30 March 2010), 1999.
Majumdar, C. and Gupta, G.: Willingness to pay and municipal water pricing in transition: a case study, Journal of Integrative Environmental Sciences, 6, 4, 1–12, 2009.
Mishan, E. and Quah, E.: Cost-benefit analysis, Allen & Unwin, UK, 1976.
Majumdar, C.: 5 Water provision and taxation; a case study of kolkata, PhD Thesis, Jadavpur university, Kolkata, 2008. Moglia, M., Perez, P., and Pope, S.: Small town water
gover-nance in developing countries: the uncertainty curse, 18th World IMACS/MODSIM Congress, Cairns, Australia, http://mssanz. org.au/modsim09 (last access: 30 March 2010), 2009.
Murty, M. N., Dhavala, K. K., Ghosh, M., et al.: Social Cost-Benefit Analysis of Delhi Metro, Institute of Economic Growth, Delhi University Enclave, N. Delhi, http://iegindia.org/workpap/
wp273.pdf (last access: 30 March 2010), October 2006. NBC, National Building Code of India: Bureau of Indian Standards,
New Delhi, India, 1983.
New York Times, 3 Oct 2006: http://www.nytimes.com/2006/10/
03/nyregion/03water.html (last access: 30 March 2010), 15, 2006.
NeuroDimensions Inc.: Neural network software, http://www.nd. com/(last access: 13 January 2010), 2009.
Nordhaus, W. and Boyer, J.: Requiem for Kyoto: An Economic Analysis of the Kyoto Protocol, Cowles Foundation, Yale Uni-versity, 1999.
Oca de, M., Bateman, I. J., Tinch, R., et al.: Assessing the Willing-ness to Pay for Maintained 20 and Improved Water Supplies in Mexico City, CSERGE Working Paper ECM 03-11, http://www. uea.ac.uk/env/cserge/pub/wp/ecm/ecm200311.pdf (last access: 30 March 2010), 2003.
(OECD) Organization for Economic Co-operation and Develop-ment: Cost-Benefit Analysis and the EnvironDevelop-ment: Recent De-velopments, ISBN 92-64-01004-1, 2006.
Page, C. and Page, M.: Durability of concrete and cement compos-ites, Woodhead Publishing and Maney Publishing, CRC Press, USA, 2007.
(RBI) Reserve Bank of India Bulletin: Government of India, New Delhi, http://www.rbi.org.in/scripts/BS ViewBulletin.aspx (last access: 30 March 2010), 2009.
Rostam, S.: The European Approach to design life, The Design Life of Structure, Edited Sommerville, Blackie, UK, 2006.
Roy, J., Chattopadhyay, S., Mukherjee, S., et al.: An Economic Analysis of Demand for Water Quality: Case of Kolkata, Eco-nomic and Political Weekly, Jan., 186–192, 2003.
Ruet, J.: Water supply & sanitation as “urban commons” in Indian metropolis: how redefining the State/Municipalities relationships should combine global and local de facto ‘commoners’, Centre de Sciences Humaines, N. Delhi, India, 2002.
Sen, A. K.: Isolation, Assurance and the Social Rate of Discount, Q. J. Econ., 81, 112–124, 1967.
Smith, A. and Mason, A.: Cost Estimation Predictive Mod-eling: Regression versus Neural Network, Accepted to The Engineering Economist November, http://www.eng.auburn.edu/ ∼aesmith/publications/journal/tony.pdf (last access: 30 March
2010), 1996.
Cost Estimation Predictive Modeling: Regression versus Neural Network Accepted to The Engineering Economist, November 1996.
Singh, R., Franceys, R., Kumar, V., et al.: Water Supply Projects: A Case Study of Varanasi and Chandauli Districts, Journal of Institutions of Engineers, 84, 35–38, 2003.
Soheil, M.: Water and Sanitation Tariffs for the Poor Guidance notes, Water, Engineering and Development Centre, Loughbor-ough University, 2004.
Stillman, J.: Design life and the new code, The design Life of Struc-tures, edited by: Sommerville, G., Blackie, UK, 2004.
UNCED (United Nations Conference on Environment and Devel-opment): Agenda 21. Chapter 18, Protection on the quality and supply of freshwater resources, Vol. II, New York, United Na-tions, 1992.
(UTT) Urban Think Tank: Willingness to Charge for Water and Sanitation Services, 14th Meet, Kolkata, 14–15 Nov 2002. Vaidya, C.: Study on Willingness to Pay for water and
sanita-tion services-case study of Baroda, Report submitted to HSMI (HUCO), New Delhi, 1995.
WEDC Conference 20th: Affordable Water Supply And Sanitation, Willingness to pay/use for water supply and sanitation, Colombo, Sri Lanka, 1994.
Weitzman, M.: Why the Far-Distant Future Should Be Discounted at Its Lowest Possible Rate, J. Environ. Econ. Manag., 36, 201– 208, 1998.
Whittington, D., Lauria, D., Prabhu, V., et al.: An economic reap-praisal of the Melamchi water supply project – Kathmandu, Nepal, Portuguese Economic Journal, 3, 157–178, 2004. Wu, Z., Walski, T. M., Mankoski, R., et al.: Optimal Capacity of
Water Distribution Systems, Proc. of 1st Annual Environmental and Water Resources Systems Analysis Symposium, 19–22 May, Roanoke, VA, USA, 2002.
World Bank (Weston International, USA, et al.: Final Report: An Assessment of Social Aspect and Willingness to Pay, Project Preparation Studies for Calcutta Water Supply, Sewerage and Drainage Projects, World Bank Project No. P.O. 50648, Kolkata, 2001.
Wu, Z., Walski, T., Naumic, G., et al.: Optimizing Water System Improvement For A Growing Community, International Confer-ence of Computing and Control in the Water Industry, 5–7 Sep 2005, Exeter, UK, 2005.
Young, H. P., Okada, N., and Hashimoto, T.: Cost Allocation in Wa-ter Resources Development – A Case Study of Sweden, RR-80-32, International Institute For Applied Systems Analysis, Laxen-burg, Austria, 1980.
Zerah, M.: Water Supply and Sanitation in Vijayawada: Analysis of households’ situation towards modes and cost of access, con-sumption and level of satisfaction, Centre for Economic Studies in India, Report Number 2/2002, 2002.
Zhang, S.: Architecting Water Supply System – A Perspective from Value of Flexibility, Second International Symposium on Engi-neering Systems, MIT, Cambridge, USA, 15–17 June 2009. Zurada, M.: An Introduction to Artificial Neural Systems, PWS