DWESD
3, 65–105, 2010Rapid evaluation of water supply project
feasibility
K. Dutta Roy et al.
Title Page
Abstract Introduction
Conclusions References
Tables Figures
◭ ◮
◭ ◮
Back Close
Full Screen / Esc
Printer-friendly Version
Interactive Discussion
Drink. Water Eng. Sci. Discuss., 3, 65–105, 2010 www.drink-water-eng-sci-discuss.net/3/65/2010/ © Author(s) 2010. This work is distributed under the Creative Commons Attribution 3.0 License.
Drinking Water Engineering and Science Discussions
This discussion paper is/has been under review for the journal Drinking Water Engineering and Science (DWES). Please refer to the corresponding final paper in DWES if available.
Rapid evaluation of water supply project
feasibility in Kolkata, India
K. Dutta Roy1, B. Thakur2, T. S. Konar3, and S. N. Chakrabarty3
1
Kolkata Metropolitan Water and Sanitation Authority, Kolkata, India
2
Meghnad Saha Institute of Technology, Kolkata, India
3
Civil Engineering Dept., Jadavpur University, Kolkata, India
Received: 22 December 2009 – Accepted: 8 January 2010 – Published: 22 January 2010
Correspondence to: B. Thakur ([email protected])
DWESD
3, 65–105, 2010Rapid evaluation of water supply project
feasibility
K. Dutta Roy et al.
Title Page
Abstract Introduction
Conclusions References
Tables Figures
◭ ◮
◭ ◮
Back Close
Full Screen / Esc
Printer-friendly Version
Interactive Discussion
Abstract
Mega cities in developing countries are mostly dependent on external funding for im-proving the civic infrastructures like water supply. International and sometimes national agencies stipulate financial justifications for infrastructure funding. Expansion of drink-ing water network with external funddrink-ing therefore requires explicit economic estimates.
5
A methodology suitable for local condition has been developed in this study. Relevant field data were collected for estimating the cost of supply. The artificial neural network technique has been used for cost estimate. The willingness to pay survey has been used for estimating the benefits. Cost and benefit have been compared with consid-eration of time value of money. The risk and uncertainty have been investigated by
10
Monte Carlo’s simulation and sensitivity analysis. The results in this case indicated that consumers were willing to pay for supply of drinking water. It has been also found that supply up to 20 km from the treatment plant is economical after which new plants should be considered. The study would help to plan for economically optimal improve-ment of water supply. It could be also used for estimating the water tariffstructure for
15
the city.
1 Introduction
Urban population in India are increasing rapidly. The number of cities with a population in excess of one million has increased from 23 in 1991 to 35 in 2001. Yet the services like safe drinking water to support these growing populations is lagging behind
result-20
ing, among other problems, a chronic shortage of safe drinking water. In Kolkata, water services are historically provided free of charge by the government and politicians are now unwilling to charge fees. In addition, majority of the Kolkata population are too poor to pay any tax at all. Revenues for the sector come from a share of the prop-erty tax (Ruet, 2002). Roy et al. (2003) reported that Kolkata Municipal Corporation
25
DWESD
3, 65–105, 2010Rapid evaluation of water supply project
feasibility
K. Dutta Roy et al.
Title Page
Abstract Introduction
Conclusions References
Tables Figures
◭ ◮
◭ ◮
Back Close
Full Screen / Esc
Printer-friendly Version
Interactive Discussion
not available in the Kolkata to finance its water supply projects. International agencies like World Bank, Asian Development Bank etc generally provide soft loans for such development. In countries like India, official policies generally support water tariffs cov-ering operation and maintenance costs plus parts of depreciation, debt servicing and a contribution to new capital investment. Policies also cover issues like cross subsidies
5
from large domestic consumers to the poor, those from industry to domestic users etc. In practice, such issues are often ignored and tariff collection even if it is introduced remains unenforced (ADB, 2006). McIntosh (2003) provided a typical example. In Colombo, the average domestic tariffis only about one seventh of the average nondo-mestic tariff. In fact, the tariff is so low that for many people transportation costs for
10
payment are higher than the amount of the bill itself, thus making collection a problem. However, funding agencies are determined for prudent financial management and are making explicit conditions in the loan for adequate financial planning (ADB, 2007). In this scenario, water supply project financings can no longer take place on ad-hoc basis like before. In industrialized countries, formal cost benefit analysis (CBA) has been
15
used for evaluation of water supply projects. A set of best management practices has been also developed to standardise the CBA. In India, such standards do not exist at present. This study is intended for developing an economically sound method for eval-uation of water supply networks rapidly in Kolkata, India. The methodology has been applied to a water supply expansion plan for southern fringes of the city.
20
2 Methodology
Average use of water per person varies from community to community. In US, per capita water use may range from 189 to 1893 litres per day (AAWA, 1986). New York Times (2006) reports that even after a reduction of 28% of demand for increased awareness and stringent regulations per capita water use is about 500 l (136 US Gal)
25
DWESD
3, 65–105, 2010Rapid evaluation of water supply project
feasibility
K. Dutta Roy et al.
Title Page
Abstract Introduction
Conclusions References
Tables Figures
◭ ◮
◭ ◮
Back Close
Full Screen / Esc
Printer-friendly Version
Interactive Discussion
per day of water supply (CPEEHO, 2008). However, Singh et al. (2003) and Zerah (2003) both found that only about 27 l per capita per day is the actual consumptions of water in the poorer areas of Varanasi and New Delhi, India respectively. Similar water use values are also expected in slums of Kolkata. There is a growing pressure for increasing water supply in Kolkata. Expansion of water supply network would demand
5
funding mainly from international agencies that require cost benefit analysis (CBA). The present methodology is proposed for such cases.
Explicit CBA for water supply projects are not new. Hanke and Walker (1974) criti-cized the CBA of a US federal government project executed in 1967 and pointed out a number of anomalies. Water supply CBA reports are often subjected to such
criti-10
cism mainly because the analysis is almost always a complicated process. Mathemat-ical programming for cost allocation in water supply projects is also not new. Young et al. (1980) published detailed treatment of linear programming, game theory and shapely values for water resources cost allocation among Swedish municipalities.
Efforts have been made over time to standardize the CBA. For example, Office of
15
Management and Budget (OMB) in US has issued guidelines for CBA and risk as-sessment (Kopp et al., 1997). The paper offers a number of suggestions to regulatory agencies in conducting CBA, drawing on the “best practices” identified in guidelines issued by the OMB. These include the use of clear and consistent baseline assump-tions; the evaluation of an appropriately broad range of policy alternatives, including
20
alternatives to new regulation; appropriate treatment of discounting future benefits and costs and accounting for the cost of risk-bearing; the use of probabilistic analyses and other methods to explore the robustness of conclusions and the use of benefit and cost measures that are grounded in economic theory. They found that estimates of the willingness to pay for reductions in mortality and morbidity risks and for avoiding
25
DWESD
3, 65–105, 2010Rapid evaluation of water supply project
feasibility
K. Dutta Roy et al.
Title Page
Abstract Introduction
Conclusions References
Tables Figures
◭ ◮
◭ ◮
Back Close
Full Screen / Esc
Printer-friendly Version
Interactive Discussion
demonstrate CBA and supply system options including practices for risk manage-ment. These technologies and management practices will enable end-users to make informed choices, appropriate to their own circumstances and constraints, for cost-effective and sustainable source-to-tap solutions for the provision of safe high quality drinking water that has the trust of the consumer. They investigated the utility of CBA
5
for evaluation of the options implemented at end-user sites to make improvements to the water supply systems. They also recommended economic valuation, decision cri-teria and risk management in CBA. In addition, they emphasized on sensitivity analysis to evaluate the potential effects of key uncertainties in the decision making process.
Similar to US administration European Union published guides for CBA (Florio,
10
2006). Industry specific guidelines including integrated water supply scheme have been provided. It has advises for steps like collection of territorial data, option analy-sis, financial analyanaly-sis, economic analyanaly-sis, evaluation criteria, risk and sensitivity anal-ysis etc. In addition, it has examples for demand calculations, inflation, present value, quantification of costs and benefits etc. The efforts for development of standardized
15
guidelines for CBA have been studied. There are three separate areas of investiga-tions namely cost analysis, benefit analysis, and benefit-cost comparisons including risk studies that are required for economic evaluation. Each of these steps for the present case has been presented in the following.
3 Cost analysis
20
3.1 Territorial data
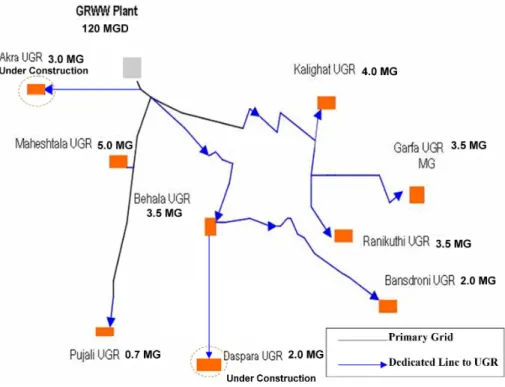
The southern part of the city of Kolkata is serviced by a 120 MGD water treatment plant called Garden Reach Water Works (GRWW). The treated water from the plant is transported through dedicated lines to a number of booster pumping stations that in turn serves the consumers’ water networks. In total, 2.3 million residents are served
25
DWESD
3, 65–105, 2010Rapid evaluation of water supply project
feasibility
K. Dutta Roy et al.
Title Page
Abstract Introduction
Conclusions References
Tables Figures
◭ ◮
◭ ◮
Back Close
Full Screen / Esc
Printer-friendly Version
Interactive Discussion
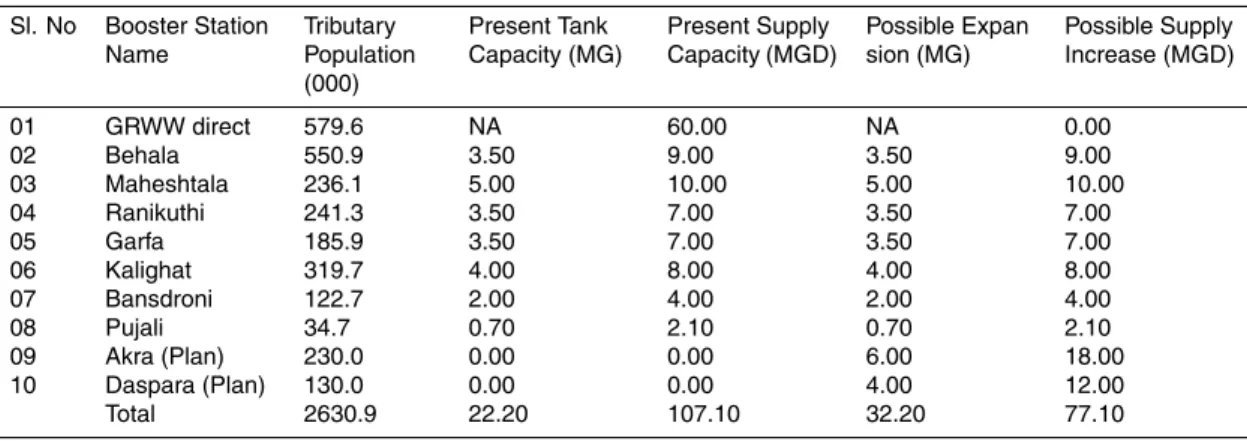
booster pumping stations is presented in Fig. 1. A part of the water from GRWW is directly fed into the consumers’ network. There are seven existing booster pumping stations and additional two stations have been planned.
The sizes, service areas and operating costs of the booster pumping stations are estimated from GRWW records and are presented in Table 1. A study has been
con-5
ducted for assessing the additional quantities of water that can be supplied from the existing stations by upgrading the system. The resulting expansion limits of the booster pumping stations have also been presented in Table 1.
3.2 Present value of cost
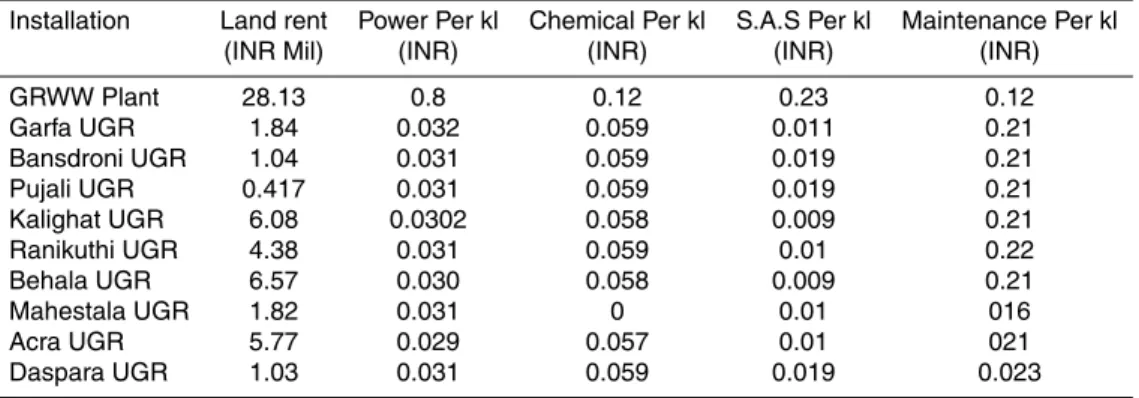
Cost estimation generally involves predicting land, labour, material, utilities and other
10
costs over time. An estimate can be made by various methods like proration estimate, capacity cost curve, equipment ratio or unit rate method. In this case, the unit rate method has been used for estimating costs. Each of the facility has two major costing components namely capital cost and operating cost. Existing cost data have been collected from GRWW planning and accounting records. The details of capital and
15
operating costs are presented in Tables 2 and 3 respectively.
The investment for a project is spread through out its life span. The investments are discounted to its present value for normalizations of the different time factors in the following manner.
C=
t
X
t=0
Cn
(1+i)t (1)
20
DWESD
3, 65–105, 2010Rapid evaluation of water supply project
feasibility
K. Dutta Roy et al.
Title Page Abstract Introduction Conclusions References Tables Figures ◭ ◮ ◭ ◮ Back Close
Full Screen / Esc
Printer-friendly Version
Interactive Discussion
network can be estimated in the following manner.
Cp=
L
P
t=1 Ct
(1+i)t Lc
P
t=1 Qt
+
L
P
t=1
Ot
Qt
(1+i)t (2)
WhereCp=Present value of cost in INR/kl,Ct =Capital costs in INR incurred at year
t,Ot=Operating costs in INR incurred at yeart,Qt=Quantity of water in kl generated at yeart,L=Expected life of the facilities andi =Discount rate at year t.
5
The life of water supply network infrastructures are long. The impact of inflation is required to be considered for a realistic CBA analysis. In India, the inflation phenom-ena is observed by Reserve bank of India and published sector wise in their bulletins (RBI, 2009). These values are used for projecting the future inflation. The capital and operating costs that are summarized in Tables 2 and 3 have been effected with inflation
10
impact for the projects’ life span. The Eq. (2) is then modified for inflation as shown in Eq. (3).
Cp=
L
P
t=1 Ct(1+r)
t
(1+i)t Lc
P
t=1 Qt
+
L
P
t=1
Ot(1+r)t
Qt
(1+i)t (3)
Wherer is the annual rate of inflation in yeart.
In such present value estimates, the discount factor i is one of the most important
15
deciding factor for selection of a project. Since the civil engineering structures have a long life span the input values in Eq. (3) is difficult to estimate and can not be decided with certainty. The discount factors including project life span have been discussed in Sect. 3.3.
The existing technical details like drawings and specifications of each of the booster
20
DWESD
3, 65–105, 2010Rapid evaluation of water supply project
feasibility
K. Dutta Roy et al.
Title Page
Abstract Introduction
Conclusions References
Tables Figures
◭ ◮
◭ ◮
Back Close
Full Screen / Esc
Printer-friendly Version
Interactive Discussion
capacities and increasing pumping schedule for expanding the water supply capacity. Combinations of the three are also considered. The unit cost rates that are presently in use in the locality have been applied to the bill of materials to arrive at the capital cost estimates as presented in Table 2 for increasing the water supply capacities. The values presented in Table 3 have been used for estimating the operating costs for
5
expansion of the water supply network. The relationship presented in Eq. (3) has been used to compress the stream of capital and operating cash outflows to its present value for each kilo litre of water.
3.3 Issues in present value estimate
There are several issues namely project life span, inflation and discounting factor that
10
are particularly relevant for estimating present value of cost. The life span of concrete structures that are widely used for pumping stations could be long. Page and Page (2007) reported concrete structures that are still stable since the Roman times. In Kolkata, the first water treatment plant built in 1868 and first booster station built in 1911 is still in use (KMWSA, 2009). Stillman (2004) estimated that most public project
15
structures have an estimated life span of 60 to 120 years. British code of practice for bridges, BS5400 specifically expects a service life of 120 years. The channel tunnel in UK specified a service life of 120 years (Rostam, 2006). Jaspers (2008) guidelines for EU countries suggest the life span of civil engineering and electro-mechanical facilities of water treatment plants as forty and fifteen years respectively. Florio et al. (2006)
20
suggested 30 years as the time horizon for CBA for water supply network in EU coun-tries. The service life generally expected from a standard RCC building is about 75 years (Rostam, 2006). Considering the various suggestions in the literature a life span of 75 years for civil structures and 15 years for electro-mechanical facilities have been assumed for the present CBA.
25
DWESD
3, 65–105, 2010Rapid evaluation of water supply project
feasibility
K. Dutta Roy et al.
Title Page
Abstract Introduction
Conclusions References
Tables Figures
◭ ◮
◭ ◮
Back Close
Full Screen / Esc
Printer-friendly Version
Interactive Discussion
specific rates and mentioned inflation as a critical factor for risk analysis. Canadian guidelines used consumer price index to reflect inflation (Canada, 2007). Kopp et al. (2007) advised to include inflation during the risk analysis for CBA in USA. Green (2003) suggested to deduct the effect of inflation from benefit and cost cash flows in CBA. In this study, consumers’ price index as reported in RBI (2009) bulletins have
5
been used for inflation. The long-term distribution assumed for this study is presented in Table 6.
The discount rate in Eq. (3) is used to compress a stream of future benefits and costs into a single present value amount. Thus, present value is the value today of a stream of payments, receipts, or costs occurring over time, as discounted through the use of
10
an interest rate. The discounting rule for public projects is based on the Social Time Preference Rate (STPR). It is used for discounting future benefits and costs, and is based on comparisons of utility across different points in time or different generations. The rate has several components namely pure time preference, inflation and long-term risks like war or technical obsolescence. A number of economists like Marglin
15
(1963), Sen (1967), Baumol (1968), Mishan (1976) etc. investigated about STPR with relation to factors like savings rate, intergenerational equity, opportunity cost of public investment etc. Marini (1999) and Weitzman (1998) investigated the impact of inter-generational equity on STPR. The theoretical framework for estimating STPR is still under scrutiny particularly for issues like global warming, radioactive disposal etc. For
20
example, Nordhaus (1999) discussed about two different STPR, one for the advanced countries and the other for developing countries in connection with the projects related to Kyoto protocol. Creedy (2007) suggested a sensitivity analysis of social discounting rate in lieu of a single value in cost benefit analysis.
In practice, investigators used varieties of rates while evaluating the environmental
25
DWESD
3, 65–105, 2010Rapid evaluation of water supply project
feasibility
K. Dutta Roy et al.
Title Page
Abstract Introduction
Conclusions References
Tables Figures
◭ ◮
◭ ◮
Back Close
Full Screen / Esc
Printer-friendly Version
Interactive Discussion
estimating the cost-benefit of metro lines in New Delhi, India the STPR was assumed as 8% (Murty et al., 2006). Boscolo et al. (1998) presented a list of discount rates used in many countries for environmental control project. The rate varied from 0 to 10%. However, a rate of about 6 to 7% was selected in most of these studies. The rate of STPR for the present study is also taken as 7%.
5
Many of the inputs for estimating cash out flows do not have a definite value. For example, the STPR value may vary from 6 to 8% in Indian condition. The resulting estimates for cost would also vary. Monte Carlo’s Simulation detailed in Sect. 5.2 is one of the standard methods for estimating the statistics of the output in such cases. In this case, Palisade @risk software (DTS 2009) has been used to simulate the Eq. (3)
10
for estimating the present value of cost and itsσfor each kilo litre of water for different supply ranges. Triangular distributions of inflation and STPR as presented in Table 6 have been assumed for simulation. The cost estimates similar to values presented in Tables 2 and 3 that are derived from bill of quantities have been used for estimating the present value of cost. Such estimated present values have been used for developing
15
the capacity-cost relationship of the water supply expansion for nine numbers booster pumping stations and is presented in Fig. 2. The mean (µ) and the range of one standard deviation (σ) estimated from the simulation are presented in Fig. 2 for each booster station.
3.4 Artificial neural network for costing
20
Development of the traditional capacity-cost curves as presented in Fig. 2 would re-quire complete technical design, drawing and specifications for a specific booster sta-tion. The relevant details for a proposed booster pumping station are required to be developed which is expensive and time consuming. Therefore, statistical approaches have been investigated for developing a rapid cost estimating routine. It has been
hy-25
DWESD
3, 65–105, 2010Rapid evaluation of water supply project
feasibility
K. Dutta Roy et al.
Title Page
Abstract Introduction
Conclusions References
Tables Figures
◭ ◮
◭ ◮
Back Close
Full Screen / Esc
Printer-friendly Version
Interactive Discussion
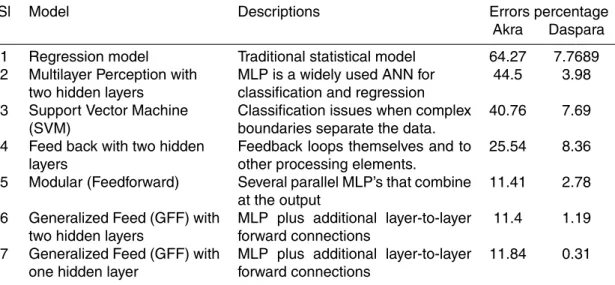
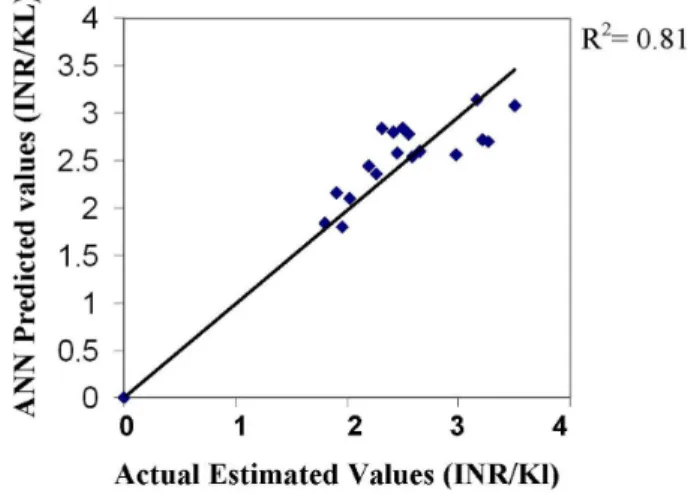
In order to develop an empirical relationship among these major factors a multivariate regression model has been attempted. The capacity-cost data of the seven numbers existing booster stations which is presented in Fig. 2 has been used to generate a best fit regression equation. The developed relationship is used to estimate the costs for the two planned stations namely Akra and Daspara. The statistical and technical estimates
5
of costs for the two planned stations namely Akra and Daspara are compared and the errors have been found to be 64.27% and 7.76% respectively. It is felt that further improvement of the model is essential for its effective use.
Artificial neural network (ANN) is lately found to be a promising technique for predict-ing complex nonlinear relationships. The ANN is a mathematical model of theorized
10
brain activity which attempt to exploit the massively parallel local processing and dis-tributed storage properties believed to exist in the human brain (Zurada, 1992). Adeli (2001) chronicled a number of ANN applications in civil and water resources engineer-ing. Boussabaine (1996) reviewed application of ANN in construction management. Le ´on et al. (2000) proposed ANN for water network management. Jain et al. (2001)
15
used ANN for water demand forecasting of a college campus in India. Adeli and Wu (1998) used ANN for construction cost estimating. Smith and Mason (1996) compared performance of regression and ANN techniques for predictive cost analysis models. Cavalieri et al. (2004) compared performance of parametric and ANN cost models in a production unit. Boussabaine and Kaka (1998) applied ANN for cost flow forecasting
20
in a construction setting. The literature indicate that the ANN could be an useful tool for predictive cost modelling for the present case.
The capacity-cost relationships of the existing booster pumping stations which are presented in Fig. 2 have been used to train an ANN model for cost estimation with the help of NeuroSolutions software (NeuroDimensions, 2009).
25
paramet-DWESD
3, 65–105, 2010Rapid evaluation of water supply project
feasibility
K. Dutta Roy et al.
Title Page
Abstract Introduction
Conclusions References
Tables Figures
◭ ◮
◭ ◮
Back Close
Full Screen / Esc
Printer-friendly Version
Interactive Discussion
rically estimated cost values (INR/kl) of the existing booster pumping stations. The percent difference between ANN and parametric estimates of Akra (Cost INR1.84/kl) and Daspara (Cost: INR2.51/kl) booster stations for each option are compared in Ta-ble 4.
The traditional multivariate regression model have not provided good result which
5
is evident from serial 1 in Table 4. ANN model has been tried from serial 2 to 7 in Table 4. Various network architecture with different transfer functions (TF) have been tried and observed errors are presented in Table 4. In serial 2, Multiple layer perceptron (MLP) with two hidden tan hyperbolic (tanh) layers and linear out put layer has been conducted . This was trained for 80 epochs and 100 generations with training data set,
10
with the additional condition that that the learning process terminates if mean square error (MSE) is less than 0.01 In serial 3, SVM without any hidden layer, which does not comprise any provision of transfer function (TF) has been tried. In serial 4, Feed Back network with two hidden layers was used. In this case also hidden layers TF are tanh, and that in and out put layer is liner. Other conditions are also identical as that of first
15
case. The serial 5 is Modular feedforward network with two hidden layers, and in either hidden layer, the upper and lower branch TF being tanh, where as that in out put being linear. Momentum learning rule was applied. Other conditions are same as in serial 1. In serial 6, the GFF neural network with two hidden layers was used. The hidden layers are having tanh as TFs and the out put layer is having liner TF. In serial 7, GFF with
20
one hidden layer was used. The hidden layer is having tanh as TF and the out put layer is with liner TF. The rest of the conditions are same as the first case.
The costing data for planned booster stations namely Akra and Daspara have not been included for training of the network. The results for each option of ANN have been compared with Akra and Daspara costing data and the errors between the estimated
25
DWESD
3, 65–105, 2010Rapid evaluation of water supply project
feasibility
K. Dutta Roy et al.
Title Page
Abstract Introduction
Conclusions References
Tables Figures
◭ ◮
◭ ◮
Back Close
Full Screen / Esc
Printer-friendly Version
Interactive Discussion
has been decided that ANN predicted costs reasonably predict the technical estimates for booster pumping stations in GRWW network.
The selected ANN has been used to estimate the cost (INR/kl) of water supply for a number of combinations of the input variables namely, tributary population, supply capacity, distance from GRWW and land rent and the results have been presented
5
in Fig. 4. The trend and interrelationship of the data can be reviewed in Fig. 4. It may be noted that for a given serving population of say five hundred thousands, the cost fabric generated by land rent and distance from GRWW is mildly increasing in most combinations except at the corners where the cost is rapidly changing for a small change in distance from GRWW. In other words there is a boundary zone where the
10
water supply cost shall be reasonably optimum. The maximum distance of the booster station seems to be about 20 km within which the supply cost shall remain optimum.
4 Benefit analysis
4.1 Willingness to pay
Willingness to pay or contingent valuation is a method of estimating the non
mar-15
ket value of environmental amenities such as the value of safe drinking water. These values are measured based on the willingness to pay of the consumers for improved environment. In this case, the benefit of the project is assumed as the monetary value of WTP derived from the survey. The interesting aspect of the contingent valuation method is that it allows to estimate total value rather than components of that value.
20
The method is appropriate and well known for valuation of environmental amenities.
4.2 Willingness to pay studies
DWESD
3, 65–105, 2010Rapid evaluation of water supply project
feasibility
K. Dutta Roy et al.
Title Page
Abstract Introduction
Conclusions References
Tables Figures
◭ ◮
◭ ◮
Back Close
Full Screen / Esc
Printer-friendly Version
Interactive Discussion
water resources. It was stated that water should be regarded as an economic good. At the Second World Water Forum held in Hague in 2000, it was resolved that the resource value should be recognised in water management decisions. Use of WTP survey for valuing water resources has been recommended by many researchers (Agudelo, 2001).
5
The demand for environmental quality is often presumed to be low in developing countries due to poverty. Jalan and Somanathan (2004) conducted a WTP survey in New Delhi, India to estimate the effects of awareness on home water purification. Average costs of different home purification methods are used to get estimates on will-ingness to pay for better drinking water quality. They found that measures of awareness
10
such as schooling and exposure to mass media have statistically significant effects on adoption of different home purification methods and therefore, on willingness to pay. In a World Bank sponsored workshop (UTT, 2002) it was resolved that WTP surveys are appropriate and would be the most suitable method for estimating demand for water supply services for urban India.
15
In a study (Llorente and Zerah, 2003) in New Delhi, India it was found that slum dwellers could use only 27 l per capita per day of water due to scarcity and pay INR100 to 135 per month to informal entities for purchasing water for each household. It is considerably higher than that of the higher income group. But one has to be very careful before converting this amount into willingness to pay. Despite paying high charges the
20
household may not accept to pay “officially” for a better service. The dwellers seem to be of the opinion that the government should act to provide them water free of charges because of their low income status.
Katz and Sara (1997) studied seven World Bank sponsored rural water supply schemes in poorer countries spanning across three continents. The study has found
25
DWESD
3, 65–105, 2010Rapid evaluation of water supply project
feasibility
K. Dutta Roy et al.
Title Page
Abstract Introduction
Conclusions References
Tables Figures
◭ ◮
◭ ◮
Back Close
Full Screen / Esc
Printer-friendly Version
Interactive Discussion
showed that users have a strong preference for house connections and there was a strong willingness to pay the additional costs of these connections. The willingness to pay varies depending upon the method of supply.
Oca et al. (2003) conducted a WTP survey for water supply in Mexico City. They have observed that poorer households are primarily concerned with securing reliable
5
services, while wealthier households, which already enjoy better services, offer higher WTP amounts to avoid service deterioration. They have proposed a method to use WTP to create equity based policy of water tariffs reflecting income distribution. The aggregated WTP amounts show that the authorities could collect sufficient resources for both service modernisation and could also reduce existing subsidies by about 70%.
10
Remaining subsidies could be targeted on households with lower income levels. Kaliba et al. (2003) analyzed willingness to pay survey to improve community-based rural water in Tanzania. An estimate of willingness to pay provides an indication of the demand for improved services and potential for them being sustainable. They also advised to ensure that disadvantaged community members should not suffer unduly
15
from increases in tariffor fees.
Islam et al. (1994) in course of a study at Dhaka, Bangladesh proposed that aff ord-ability combined with willingness to use leads to willingness to pay. They have found that low reliability, poor service, institutional obstacles, managerial problems and lack of awareness are among the compelling causes for low “willingness to pay/use”.
20
Soheil (2004) has studied about tariff with special attention to poor in developing countries found that WTP surveys are expensive and time consuming. Its principal value is insight into the propensity to connect on the part of those groups currently without a piped supply. This propensity would be only otherwise available from attempts to extend supplies into new areas.
25
DWESD
3, 65–105, 2010Rapid evaluation of water supply project
feasibility
K. Dutta Roy et al.
Title Page
Abstract Introduction
Conclusions References
Tables Figures
◭ ◮
◭ ◮
Back Close
Full Screen / Esc
Printer-friendly Version
Interactive Discussion
al. (2003) conducted a WTP survey in Varanasi, India. They also found that about 62% of the surveyed population were willing to pay about 40 to 60 INR per month for each household for water.
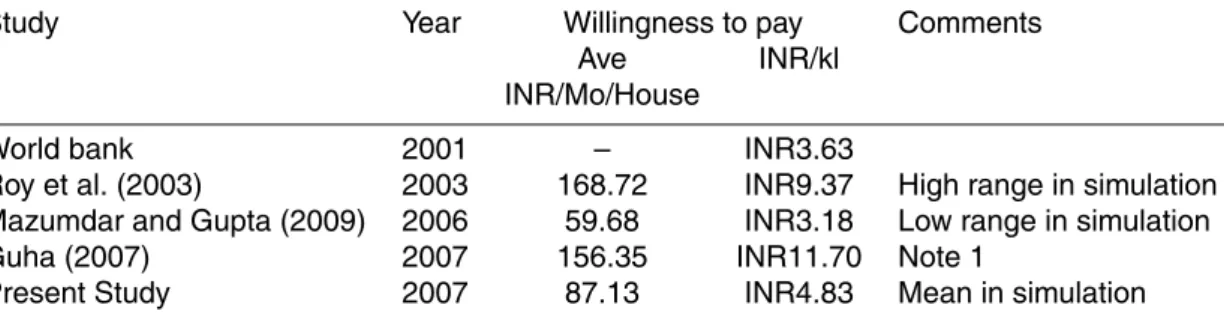
A literature search has revealed four numbers of studies in recent times for WTP survey for drinking water in Kolkata. Each of these studies are presented in the
fol-5
lowing. World Bank (2001) conducted the first WTP study for drinking water in Kolkata in connection with the approval of a loan towards a water supply expansion project. The study also surveyed socio economic aspects like water source, education, income level, housing condition etc. The monthly WTP per family varied widely from INR 54 for dwellers of multistoried buildings to INR16.6 for slum dwellers.
10
Roy et al. (2003) conducted a WTP survey in a sample of 240 household in Kolkata for safe drinking water. The survey showed striking disparity in the economic status of the residents. The incomes varied from INR2000 to over INR100 000 per month while majority of slum dwellers’ income was less than INR5000 per month. The large varia-tion of income also reflected on WTP which varied within a wide range of INR0.0023/l
15
to INR1.06/l of purified water. They found that spending power of households and educational background are important determining factor in WTP.
Guha (2007) conducted a WTP survey for water supply in Kokata. He found large variation of income among the respondents. In his survey, the family income varied from under INR5000 in slum areas to above INR40 000 among apartment dwellers.
20
The variation of income also caused variation in WTP. The mean of WTP in slum areas and apartment housings were INR0.45 and INR2.25 respectively. He estimated the mean WTP for water supply in Kolkata as INR11.70 per kl of water. The study included high and low income groups but the medium income groups consisting about 33% of the population and mostly living in small houses have not been included. The result
25
would be probably biased towards the higher sides for exclusion of this group.
DWESD
3, 65–105, 2010Rapid evaluation of water supply project
feasibility
K. Dutta Roy et al.
Title Page
Abstract Introduction
Conclusions References
Tables Figures
◭ ◮
◭ ◮
Back Close
Full Screen / Esc
Printer-friendly Version
Interactive Discussion
use of 12.59 kl. Mozumdar (2008) presented monthly average expenditure of the WTP survey. He found wide variations of expenditure that also reflects the variations in income. The expenditure varied from less than INR3000 (41%) to above INR7500 (5.6%). As expected, the WTP for water also varied widely. About 10% of the surveyed population indicated their inability to pay for water for financial limitations. The upper
5
range of monthly WTP was about INR140 per family. The insight developed through the literature survey helped to plan and conduct a WTP study for supply of drinking water in Kolkata as described in the following section.
4.3 Willingness to pay estimate
A WTP survey was conducted in Kolkata in May 2008. The surveyors visited the
house-10
holds and interviewed an earning member of the family. About 326 households were covered in the survey. A stratified sampling method has been employed for the selec-tion of households. The slum dwellers as well as the apartment dwellers were sur-veyed.
World Bank (2001) in connection with the WTP survey, estimated the average value
15
of monthly household income in Kolkata as INR6628 in 2001 price level. The value is adjusted according to consumers’ price index in Kolkata (RBI, 2009) to accommodate annual inflations. The inflation corrected mean household income in 2008 price level is estimated as INR8748. The mean monthly household income of the presently sur-veyed sample is INR 8583 which is about two percent less than the estimated mean of
20
INR8748. It is therefore decided that the presently surveyed samples are representa-tive of the average monthly income aspect of the Kolkata households.
The WTP questionnaire had two broad divisions. The first part included the dif-ferent socio economic status of the respondent such as the monthly family income, educational qualification of all the members of the family, occupation, number of family
25
DWESD
3, 65–105, 2010Rapid evaluation of water supply project
feasibility
K. Dutta Roy et al.
Title Page
Abstract Introduction
Conclusions References
Tables Figures
◭ ◮
◭ ◮
Back Close
Full Screen / Esc
Printer-friendly Version
Interactive Discussion
monthly amount they would be willing to pay for the supply of filtered drinking water in their residences.
The literatures about the WTP survey recognize the fact that some subjects may not agree to pay and has developed methods to manage such protest variables. Similar cases have been found in this case. Some of the subjects stated about their financial
5
inability to pay any tax at all. Some did not accept the idea of a separate fee in addition to property tax. About twenty five percent of the surveyed population did not accept the idea of a separate water fees in addition to property tax. These responses were recorded as nil which has reduced theµ and increased theσ of WTP. However, the mean should accurately reflect the present status in Kolkata.
10
The WTP survey conducted under this study is compared with other WTP surveys recently executed in Kolkata and are summarized in Table 5. The results vary consid-erably which are not uncommon for WTP studies. For the purpose of CBA, the upper and lower values of these studies have been utilized as ranges as shown in Table 6. The mean WTP is assumed as INR87.13 per month per household as found from the
15
present survey. The highest range is assumed as INR168.72 per month per household as found by Roy et al. (2003). The lowest range is assumed as INR59.68 per month per household as found by Mozumdar and Gupta (2009). The differences of findings are accommodated in simulation. A triangular distribution has been assumed with a mean of INR87.13 and the ranges INR59.68 to INR168.72 for the Monte Carlos’ simulation
20
routine.
5 Benefit cost comparison
5.1 Net present value
The present value of the cost is shown in Eq. (3). The net present value of the project which is the difference between the benefit and cost of the water supply project is
DWESD
3, 65–105, 2010Rapid evaluation of water supply project
feasibility
K. Dutta Roy et al.
Title Page Abstract Introduction Conclusions References Tables Figures ◭ ◮ ◭ ◮ Back Close
Full Screen / Esc
Printer-friendly Version
Interactive Discussion
presented in Eq. (4).
NPV=
75
X
t=1
W0(1+r)t (1+i)t −
L P
t=1 Ct(1+r)
t
(1+i)t Lc
P
t=1 Qt
+
L
P
t=1
Ot(1+r) t
Qt
(1+i)t (4)
Where W0 is the willingness to pay for each kl of water. In Eq. (4), W0 which is the benefit of water supply is found from WTP survey presented in Sect. 4.3 and the cost of water supply is found from ANN analysis presented in Sect. 3.4. The variability of
5
the inputs are presented in Table 6. Such variability of input values have caused risk and uncertainty in NPV which have been discussed in Sects. 5.2 and 5.3 respectively.
5.2 NPV and risk analysis
The purpose of risk analysis is to estimate the probability that the project performances will fall below the design estimate (ADB, 1999). It further specifies that decision should
10
be taken at an early stage of analysis whether to include a risk analysis in the ap-praisal. Monte Carlo’s simulations (MCS) have been used in different types of CBA of water supply projects. For example, Whittington et al. (2004) applied MCS for CBA of a water supply project for the poor in Kathmandu, Nepal. Zhang (2009) used MCS for assessing the strategic risk of water supply network in Singapore. In the CBA guide of
15
Canada (Canada, 2007), MCS has been specifically recommended in the regulatory proposal. CBA guidelines for EU (Jasper, 2008) also made risk and sensitivity analysis mandatory in their reports. MCS performs risk analysis by building models of possible results by substituting a range of values based on probability distribution. It then cal-culates results over and over, each time using a different set of random values from
20
the probability functions. A MCS could involve thousands of recalculations before it is complete. MCS produces distributions of possible outcome values.
DWESD
3, 65–105, 2010Rapid evaluation of water supply project
feasibility
K. Dutta Roy et al.
Title Page
Abstract Introduction
Conclusions References
Tables Figures
◭ ◮
◭ ◮
Back Close
Full Screen / Esc
Printer-friendly Version
Interactive Discussion
the variability of the outcome. The estimated present value of costs for various combi-nations of input variables like land rent, distance from GRWW and serving population are estimated by ANN in Sect. 3.4 and the trend is presented in Fig. 4. Theσ of the present value of costs have been presented in Fig. 2. The mean andσhave been used as input for simulation of Eq. (4). The WTP estimates for drinking water supply have
5
been collected from various studies conducted in Kolkata. The WTP study presently conducted for this analysis has been used as the mean. Similar studies performed by other investigators as discussed in Sect. 4.3 have been used as ranges for a triangular distribution of WTP. The ranges for triangular probability distributions of other factors that are required for input in Eq. (4) have been also estimated. The inflation ranges has
10
been estimated from government records (RBI, 2009). The STPR ranges have been estimated from literature survey as presented in Sect. 3.3. The input value for MCS has been presented in Table 6. MCS of Eq. (4) has been conducted for estimations of mean andσof NPV.
The NPV values for a number of combinations of input variables namely land rent,
15
serving population and distance from GRWW have been presented in Appendix A. It can be used for rapid estimate of the NPV of a proposed booster pumping station in the GRWW network from three basic information like capacity, land rent and distance from the plant. Theσ of NPV values for typical cases have been presented in the data table in Fig. 5. Further investigations about the variability of NPV have been carried
20
out in the following article.
5.3 Uncertainty
The CBA guidelines generally specify sensitivity analysis for assessing uncertainty (ADB, 1999; Baffoe-Bonnie, 2006; Canada, 2007; Florio, 2006). The main task of sensitivity analysis is to identify critical parameter dependence on the solution and to
25
DWESD
3, 65–105, 2010Rapid evaluation of water supply project
feasibility
K. Dutta Roy et al.
Title Page
Abstract Introduction
Conclusions References
Tables Figures
◭ ◮
◭ ◮
Back Close
Full Screen / Esc
Printer-friendly Version
Interactive Discussion
rehabilitation uncertainty of a water supply network in France (INSA, 2005). OECD (2006) suggested sensitivity study of NPV in CBA.
Sensitivity analysis is essentially a “What if” analysis in an iterative process. Each variable of the Eq. (4) namely WTP, ANN derived cost, inflation and discount rates are changed to a possible value and the resultant values of NPV are noted. The process
5
is repeated many times. A set of data so generated provides an idea about the input which has the largest effect on the result i.e. the NPV. In the present case, toprank software of the Palisade system (DTS, 2009) has been used to conduct the sensitivity analysis. The results of the sensitivity analysis are presented in Fig. 6. A standard “Tornado graph” for sensitivity analysis is presented. The inflation and discount rate is
10
found to be much more significant than the WTP values. Individual sensitivity curves for WTP, discount rate and inflation have been also plotted in Fig. 6. It may be noted that only an increase of 15% of the inflation or discount rate would change NPV in the range of 80%. On the other hand, a change of 50% of the WTP value would affect the NPV less than 2%. The power series relations of discount rate or inflation over the
15
NPV for a period of 75 years have made these many times more sensitive than the WTP values.
5.4 Results and discussion
The table in Appendix A would show that the NPV of a booster pumping station in GRWW network can be rapidly estimated from three input variables namely land rent,
20
serving population and distance from the GRWW. The classical cost estimating meth-ods involving design, drawings and bill of materials may be replaced within the given assumptions by simple input variables. The chart in Appendix A may be directly utilized for estimating NPV of a proposed booster pumping station within the GRWW command area.
25
DWESD
3, 65–105, 2010Rapid evaluation of water supply project
feasibility
K. Dutta Roy et al.
Title Page
Abstract Introduction
Conclusions References
Tables Figures
◭ ◮
◭ ◮
Back Close
Full Screen / Esc
Printer-friendly Version
Interactive Discussion
comparisons between bubbles 1 and 8 would show that NPV has reduced from 2.08 to 1.83 i.e. about 10% for considerable changes in land rent and population. On the other hand, the NPV values decrease rapidly for increasing distance from GRWW. The bubbles 1 and 5 would show that NPV has reduced from 2.08 to 0.32 i.e. about 85% for a change in distance of 15 km. The Fig. 5 would indicate that the NPV tends towards
5
zero after a distance of about 20 km. It means that supply from GRWW is economical for a radius of about 20 km. Additional water treatment plants should be constructed to supply demands that are more than 20 km away from GRWW.
Theσof the NPV are estimated from simulation exercise. Some of the typical cases are presented in the data table in Fig. 5. It may be noted that theσis around 0.8 and the
10
resultant coefficient of variations are considerably high which has a detrimental impact on the usability of the NPV results. The issue is investigated further with the sensitivity analysis. It is found that the NPV value is weakly dependent on the WTP values. Therefore detail investigations for WTP values would not be cost effective. In this case, the data is dependent on the inflation and discount rate. Again, these two factors are
15
positively correlated because inflation itself is integrated to STPR. The inflation is thus the major source of uncertainty for the present methodology. The forecast of long term inflation rate is a complex issue in economics and is beyond the scope of this paper.
6 Conclusions
The CBA of a water supply project has almost become mandatory for budget approval.
20
On the other hand, baseline data for conducting such analysis are scarce in Kolkata. A rapid methodology suitable for GRWW network has been developed where minimal input data is required. The table in Appendix A can be used for preliminary screening of various alternatives before a CBA study. The methodology proposed here can be further tempered for ANN in GRWW supply areas if additional data become available
25
DWESD
3, 65–105, 2010Rapid evaluation of water supply project
feasibility
K. Dutta Roy et al.
Title Page
Abstract Introduction
Conclusions References
Tables Figures
◭ ◮
◭ ◮
Back Close
Full Screen / Esc
Printer-friendly Version
Interactive Discussion
the effort for a CBA study. It can be also used as a guide for fixing tariffstructure for water supply. The model is affected by the uncertainty associated with the long term inflation rate of the economy. Therefore the model needs to be calibrated after a few years for practical use.
References
5
Adeli, H.: Neural Networks in Civil Engineering: 1989–2000, Comput.-Aided Civ. Inf., 16, 126– 142, 2001.
Adeli, H. and Wu, M.: Regularization Neural Network for Construction Cost estimation, J. Con-str. Eng.-ASCE, 124, 1, 18–24, 1998.
Agudelo, J.: The Economic Valuation of Water Principles and Methods, Value of Water Re-10
search Rep. Series No. 5,
http://www.unesco-ihe.org/content/download/415/5091/file/Value
%20of%20Water%20Research%20Report%20Series%205%20The%20economic.pdf (last access: 13 January 2010), 2001.
American Water Works Association (AAWA): 1984 Water Utility Operating Data, Denver, CO, 15
1986.
(ADB) Asian Development Bank: Handbook for the Economic Analysis of Water Sup-ply Projects, http://www.adb.org/documents/handbooks/water supSup-ply projects/default.asp, 1999.
(ADB) Asian Development Bank: Project No: 29466, India: Kolkata Environmental Improve-20
ment Project (Supplementary Loan), 2006.
(ADB) Asian Development Bank: Project No: 29466, India: Kolkata Environmental Improve-ment Project Loan AgreeImprove-ment, 2007, http://www.adb.org/docuImprove-ments/legal-agreeImprove-ments/ind/ 29466/29466-ind-lbj.pdf, 2007.
Baffoe-Bonnie, B., Harle, T., Glenne, E., et al.: Framework For Operational Cost Benefit Analy-25
sis in Water Supply, TECHNEAU, contract number 018320, 2006.
Baumol, W.: On the Social Rate of Discount, The American Economic Review, 58, 4, 788–802, 1968.
Birta, L. and Arbez, G.: Modelling and Simulation Exploring Dynamic System Behaviour Springer-Verlag London, 2007.
DWESD
3, 65–105, 2010Rapid evaluation of water supply project
feasibility
K. Dutta Roy et al.
Title Page
Abstract Introduction
Conclusions References
Tables Figures
◭ ◮
◭ ◮
Back Close
Full Screen / Esc
Printer-friendly Version
Interactive Discussion Boscolo, M., Vincent, J., and Panayotou, T.: Discounting Costs And Benefits in Carbon
Seques-tration Projects, Environment Discussion Paper No. 41, Harvard Institute for International Development, 1998.
Boussabaine, H.: The use of artificial neural networks in construction, Construction Manage-ment and Economics, 14, 427–436, 1996.
5
Boussabaine, H. and Kaka, A.: A neural networks approach for cost flow forecasting, Construc-tion Management and Economics, 16, 471–479, 1998.
(Canada) President of the Treasury Board: Canadian Cost-Benefit Analysis Guide Regulatory Proposals, http://sciencepolicy.colorado.edu/students/envs 5120/CanadaCBA.pdf, 2007. Cavalieri, S., Maccarrone, P., and Pinto, R.: Parametric vs. neural network models for the 10
estimation of production costs: A case study in the automotive industry, Int. J. Prod. Econ., 91, 2, 165–177, 2004.
(CPEEHO) The Central Public Health and Environmental Engineering Organisation: Manual on Water Supply and Treatment, N.Delhi, India, 2008.
Chatterjee, N., Bhattacharya, N., and Halder, A.: Report on Socio-Economic profile of House-15
hold in Calcutta Metropolitan area: 1996–97, Kolkata Metropolitan Development Authority, 1997.
Creedy, J.: Discounting and the Social Time Preference Rate, University of Melbourne, Depart-ment of Economics, Research Paper No. 989, 2007.
(DTS) Decision Tools Suite: Palisade Corporation, Ithaka, New York, USA, http://www.palisade. 20
com/, 2009.
Fellin, W., Lessmann, H., Oberguggenberger, M., et al.: Analyzing Uncertainty in Civil Engi-neering, Springer, Berlin, 2005.
Florio, M., Finzi, U., Genco, M., et al.: Guide to cost-benefit analysis of investment projects, Evaluation Unit, DG Regional Policy, European Commission, 2006.
25
Guha, S.: Valuation of Clean Water Supply by Willingness to Pay Method in a Developing Nation: A Case Study in Calcutta, India, Journal of Young Investigators, 17, 4, http://www.jyi. org/research/re.php?id=1295, 2007.
Green, C.: Handbook of Water Economics Principles and Practice, John Wiley & Sons Ltd, UK, 2003.
30
Hanke, S. and Walker, R.: Beneit Cost Analysis Reconsidered: An Evaluation of the Mid State Project, 10, 5, 898–908, 1974.
DWESD
3, 65–105, 2010Rapid evaluation of water supply project
feasibility
K. Dutta Roy et al.
Title Page
Abstract Introduction
Conclusions References
Tables Figures
◭ ◮
◭ ◮
Back Close
Full Screen / Esc
Printer-friendly Version
Interactive Discussion 2003.
INSA-Lyon: Rehabilitation of water supply network in urban fields (CARE-WARP), 2005. Jain, A., Varshney, A., and Joshi, U.: Short-TermWater Demand Forecast Modelling at IIT
Kanpur Using Artificial Neural Networks, Water Resour. Manag., 15, 299–321, 2001. Jalan, J. and Somanathan E.: Awareness and the Demand for Environmental Quality II: Ex-5
perimental Evidence on the Importance of Being Informed, JEL Codes 112, O10, Q53, Q56, 2004.
Jaspers: Guidelines for Cost Benefit Analysis of Water And Wastewater Projects to be Sup-ported By The Cohesion Fund And The European Regional Development Fund in 2007-2013, http://discutii.mfinante.ro/static/10/Mfp/evaluare/Water WasteWater GuideFINAL.pdf, 10
2008.
Kaliba, A., Norman, D., and Chang, Y.: Willingness to Pay to Improve Domestic Water Sup-ply in Rural Areas of Central Tanzania: Implications for Policy, http://www.uaex.edu/akaliba/ Documents/p03-∼3.pdf, 2003.
Katz, T. and Sara, J.: UNDP – World Bank Water and Sanitation Program Making Rural 15
Water Supply Sustainable: Recommendations from a Global Study, http://www-wds. worldbank.org/external/default/main?pagePK=64193027&piPK=64187937&theSitePK=
523679&menuPK=64187510&searchMenuPK=64187283&siteName=WDS&entityID=
000009265 3981005112156, 1997.
(KMWSA) Kolkata Metropolitan Water and Sanitation Authority: Retrospect, http://www.kmwsa. 20
gov.in/html/retros.html, last access: 13 January 2010.
Kopp, R. J., Krupnick, A. J., and Toman, M.: Cost-Benefit Analysis and Regulatory Reform: An Assessment of the Science and the Art, Discussion Paper 97-19, Resources for the Future, Washington, DC USA, 1997.
Le ´on, C. Mart´ın, S., Elena, J. M., et al: EXPLORE–Hybrid Expert System for Water Networks 25
Management, J. Water Res. Pl.- ASCE, 126, 2, 65–74, 2000.
Llorente, M. and Zerah, M.: The urban water sector: Formal versus Informal Suppliers in India, Urban India, Vol. XXII, No. 1, National Institute of Urban Affairs, January–June 2003. McIntosh, A.: Asian Water Supplies Reaching the Urban Poor, Chapter 11, Asian Development
Bank, http://www.adb.org/documents/books/asian water supplies/, 2003. 30
Marglin, S.: The Social Rate of Discount and The Optimal Rate of Investment, Q. J. Econ., 77, 1, 95–111, 1963.
DWESD
3, 65–105, 2010Rapid evaluation of water supply project
feasibility
K. Dutta Roy et al.
Title Page
Abstract Introduction
Conclusions References
Tables Figures
◭ ◮
◭ ◮
Back Close
Full Screen / Esc
Printer-friendly Version
Interactive Discussion uk/economics/research/workingpapers/file28891.pdf, 1999.
Majumdar, C. and Gupta, G.: Willingness to pay and municipal water pricing in transition: a case study, Journal of Integrative Environmental Sciences, 6, 4, 1–12, 2009.
Mishan, E. and Quah, E.: Cost-benefit analysis, Allen & Unwin, UK, 1976.
Majumdar, C.: Water provision and taxation; a case study of kolkata, PhD Thesis, Jadavpur 5
university, Kolkata, 2008.
Moglia, M., Perez, P., and Pope, S.: Small town water governance in developing countries: the uncertainty curse, 18th World IMACS/MODSIM Congress, Cairns, Australia, http://mssanz. org.au/modsim09, 2009.
Murty, M. N., Dhavala, K. K., Ghosh, M., et al.: Social Cost-Benefit Analysis of Delhi Metro, 10
Institute of Economic Growth, Delhi University Enclave, N. Delhi, http://iegindia.org/workpap/ wp273.pdf, October 2006.
NBC, National Building Code of India: Bureau of Indian Standards, New Delhi, India, 1983. New York Times, 3 Oct 2006: http://www.nytimes.com/2006/10/03/nyregion/03water.html,
2006. 15
NeuroDimensions Inc.: Neural network software, http://www.nd.com/, 2009.
Nordhaus, W. and Boyer, J.: Requiem for Kyoto: An Economic Analysis of the Kyoto Protocol, Cowles Foundation, Yale University, 1999.
Oca de, M., Bateman, I. J., Tinch, R., et al.: Assessing the Willingness to Pay for Maintained and Improved Water Supplies in Mexico City, CSERGE Working Paper ECM 03-11, http: 20
//www.uea.ac.uk/env/cserge/pub/wp/ecm/ecm 2003 11.pdf, 2003.
(OECD) Organization for Economic Co-operation and Development: Cost-Benefit Analysis and the Environment: Recent Developments, ISBN 92-64-01004-1, 2006.
Page, C. and Page, M.: Durability of concrete and cement composites, Woodhead Publishing and Maney Publishing, CRC Press, USA, 2007.
25
(RBI) Reserve Bank of India Bulletin: Government of India, New Delhi, http://www.rbi.org.in/ scripts/BS ViewBulletin.aspx, 2009.
Richard, A. and Weyrick, R.: Linear Programming Use for Evaluating Water Resources and Cost and Benefit Allocation, J. Am. Water Resour. As., 9, 258–272, 2007.
Rostam, S.: The European Approach to design life, The Design Life of Structure, Edited Som-30
merville, Blackie, UK, 2006.
DWESD
3, 65–105, 2010Rapid evaluation of water supply project
feasibility
K. Dutta Roy et al.
Title Page
Abstract Introduction
Conclusions References
Tables Figures
◭ ◮
◭ ◮
Back Close
Full Screen / Esc
Printer-friendly Version
Interactive Discussion Ruet, J.: Water supply & sanitation as “urban commons” in Indian metropolis: how redefining
the State/Municipalities relationships should combine global and local de facto ‘commoners’, Centre de Sciences Humaines, N.Delhi, India, 2002.
Sen, A. K.: Isolation, Assurance and the Social Rate of Discount, Q. J. Econ., 81, 112–124, 1967.
5
Smith, A. and Mason, A.: Cost Estimation Predictive Modeling: Regression versus Neural Network, Accepted to The Engineering Economist November, http://www.eng.auburn.edu/
∼aesmith/publications/journal/tony.pdf, 1996.
Cost Estimation Predictive Modeling: Regression versus Neural Network Accepted to The En-gineering Economist, November 1996.
10
Singh, R., Franceys, R., Kumar, V., et al.: Water Supply Projects: A Case Study of Varanasi and Chandauli Districts, Journal of Institutions of Engineers, 84, 35–38, 2003.
Soheil, M.: Water and Sanitation Tariffs for the Poor Guidance notes, Water, Engineering and Development Centre, Loughborough University, 2004.
Stillman, J.: Design life and the new code, The design Life of Structures, edited by: Som-15
merville, G., Blackie, UK, 2004.
UNCED (United Nations Conference on Environment and Development): Agenda 21. Chapter 18, Protection on the quality and supply of freshwater resources, Vol. II, New York, United Nations, 1992.
(UTT) Urban Think Tank: Willingness to Charge for Water and Sanitation Services, 14th Meet, 20
Kolkata, 14–15 Nov 2002.
Vaidya, C.: Study on Willingness to Pay for water and sanitation services-case study of Baroda, Report submitted to HSMI (HUCO), New Delhi, 1995.
WEDC Conference 20th: Affordable Water Supply And Sanitation, Willingness to pay/use for water supply and sanitation, Colombo, Sri Lanka, 1994.
25
Weitzman, M.: Why the Far-Distant Future Should Be Discounted at Its Lowest Possible Rate, J. Environ. Econ. Manag., 36, 201–208, 1998.
Whittington, D., Lauria, D., Prabhu, V., et al.: An economic reappraisal of the Melamchi water supply project – Kathmandu, Nepal, Portuguese Economic Journal, 3, 157–178, 2004. Wu, Z., Walski, T. M., Mankoski, R., et al.: Optimal Capacity of Water Distribution Systems, 30
Proc. of 1st Annual Environmental and Water Resources Systems Analysis Symposium, 19–22 May, Roanoke, VA, USA, 2002.
DWESD
3, 65–105, 2010Rapid evaluation of water supply project
feasibility
K. Dutta Roy et al.
Title Page
Abstract Introduction
Conclusions References
Tables Figures
◭ ◮
◭ ◮
Back Close
Full Screen / Esc
Printer-friendly Version
Interactive Discussion and Willingness to Pay, Project Preparation Studies for Calcutta Water Supply, Sewerage
and Drainage Projects, World Bank Project No. P.O.50648, Kolkata, 2001.
Wu, Z., Walski, T., Naumic, G., et al.: Optimizing Water System Improvement For A Growing Community, International Conference of Computing and Control in the Water Industry, 5–7 Sep 2005, Exeter, UK, 2005.
5
Young, H.P., Okada, N., and Hashimoto, T.: Cost Allocation in Water Resources Development – A Case Study of Sweden, RR-80-32, International Institute For Applied Systems Analysis, Laxenburg, Austria, 1980.
Zerah, M.: Water Supply and Sanitation in Vijayawada: Analysis of households’ situation to-wards modes and cost of access, consumption and level of satisfaction, Centre for Economic 10
Studies in India, Report Number 2/2002, 2002.
Zhang, S.: Architecting Water Supply System – A Perspective from Value of Flexibility, Sec-ond International Symposium on Engineering Systems, MIT, Cambridge, USA, 15–17 June 2009.
Zurada, M.: An Introduction to Artificial Neural Systems, PWS Publishing Company, Mumbai, 15
DWESD
3, 65–105, 2010Rapid evaluation of water supply project
feasibility
K. Dutta Roy et al.
Title Page
Abstract Introduction
Conclusions References
Tables Figures
◭ ◮
◭ ◮
Back Close
Full Screen / Esc
Printer-friendly Version
Interactive Discussion
Table 1.Water supply network details.
Sl. No Booster Station Name
Tributary Population (000)
Present Tank Capacity (MG)
Present Supply Capacity (MGD)
Possible Expan sion (MG)
Possible Supply Increase (MGD)
DWESD
3, 65–105, 2010Rapid evaluation of water supply project
feasibility
K. Dutta Roy et al.
Title Page
Abstract Introduction
Conclusions References
Tables Figures
◭ ◮
◭ ◮
Back Close
Full Screen / Esc
Printer-friendly Version
Interactive Discussion
Table 2.Details of capital costs.
Installation Commencement Land Area Civil Cost Electro-Mech. Cost
(SqM) (INR Mil.) (INR Mil.)
GRWW Plant 1981 231 000 660 130
Garfa UGR 2003 6070 122 40
Bansdroni UGR 2004 4280 85 25
Pujali UGR 2007 4280 78 10
Kalighat UGR 2003 100 000 260 50
Ranikuthi UGR 2003 9000 125 40
Behala UGR 1007 12 000 71.5 21
Mahestala UGR 2003 10 000 70 15
Acra UGR 2010 12456 180 40
DWESD
3, 65–105, 2010Rapid evaluation of water supply project
feasibility
K. Dutta Roy et al.
Title Page
Abstract Introduction
Conclusions References
Tables Figures
◭ ◮
◭ ◮
Back Close
Full Screen / Esc
Printer-friendly Version
Interactive Discussion
Table 3.Typical details of operating costs.
Installation Land rent Power Per kl Chemical Per kl S.A.S Per kl Maintenance Per kl
(INR Mil) (INR) (INR) (INR) (INR)
GRWW Plant 28.13 0.8 0.12 0.23 0.12
Garfa UGR 1.84 0.032 0.059 0.011 0.21
Bansdroni UGR 1.04 0.031 0.059 0.019 0.21
Pujali UGR 0.417 0.031 0.059 0.019 0.21
Kalighat UGR 6.08 0.0302 0.058 0.009 0.21
Ranikuthi UGR 4.38 0.031 0.059 0.01 0.22
Behala UGR 6.57 0.030 0.058 0.009 0.21
Mahestala UGR 1.82 0.031 0 0.01 016
Acra UGR 5.77 0.029 0.057 0.01 021
DWESD
3, 65–105, 2010Rapid evaluation of water supply project
feasibility
K. Dutta Roy et al.
Title Page
Abstract Introduction
Conclusions References
Tables Figures
◭ ◮
◭ ◮
Back Close
Full Screen / Esc
Printer-friendly Version
Interactive Discussion
Table 4.Performance of ANN at various options.
Sl Model Descriptions Errors percentage
Akra Daspara
1 Regression model Traditional statistical model 64.27 7.7689
2 Multilayer Perception with two hidden layers
MLP is a widely used ANN for classification and regression
44.5 3.98
3 Support Vector Machine (SVM)
Classification issues when complex boundaries separate the data.
40.76 7.69
4 Feed back with two hidden layers
Feedback loops themselves and to other processing elements.
25.54 8.36
5 Modular (Feedforward) Several parallel MLP’s that combine at the output
11.41 2.78
6 Generalized Feed (GFF) with two hidden layers
MLP plus additional layer-to-layer forward connections
11.4 1.19
7 Generalized Feed (GFF) with one hidden layer
MLP plus additional layer-to-layer forward connections
11.84 0.31
DWESD
3, 65–105, 2010Rapid evaluation of water supply project
feasibility
K. Dutta Roy et al.
Title Page
Abstract Introduction
Conclusions References
Tables Figures
◭ ◮
◭ ◮
Back Close
Full Screen / Esc
Printer-friendly Version
Interactive Discussion
Table 5.Comparisons of WTP Studies for Water Supply in Kolkata.
Study Year Willingness to pay Comments
Ave INR/kl
INR/Mo/House
World bank 2001 – INR3.63
Roy et al. (2003) 2003 168.72 INR9.37 High range in simulation
Mazumdar and Gupta (2009) 2006 59.68 INR3.18 Low range in simulation
Guha (2007) 2007 156.35 INR11.70 Note 1
Present Study 2007 87.13 INR4.83 Mean in simulation
DWESD
3, 65–105, 2010Rapid evaluation of water supply project
feasibility
K. Dutta Roy et al.
Title Page
Abstract Introduction
Conclusions References
Tables Figures
◭ ◮
◭ ◮
Back Close
Full Screen / Esc
Printer-friendly Version
Interactive Discussion
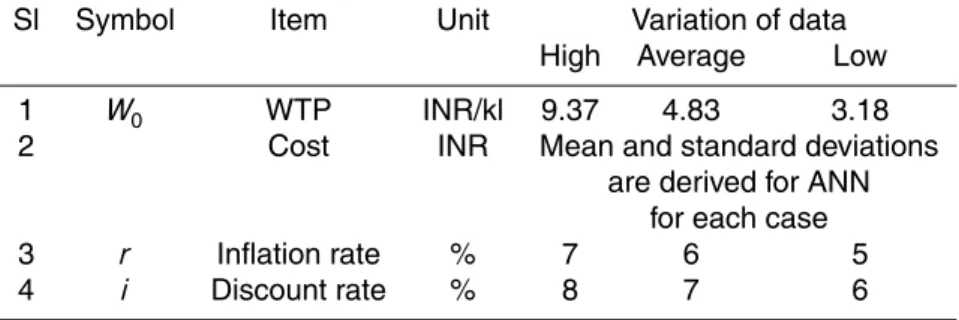
Table 6.Parameters for the simulation.
Sl Symbol Item Unit Variation of data
High Average Low
1 W0 WTP INR/kl 9.37 4.83 3.18
2 Cost INR Mean and standard deviations
are derived for ANN for each case
3 r Inflation rate % 7 6 5
DWESD
3, 65–105, 2010Rapid evaluation of water supply project
feasibility
K. Dutta Roy et al.
Title Page
Abstract Introduction
Conclusions References
Tables Figures
◭ ◮
◭ ◮
Back Close
Full Screen / Esc
Printer-friendly Version
Interactive Discussion
Table A1.
GRWW Distance Tributary Population Land Rent Supply ANN Predicted Supply Cost NPV mean (km) (INR) (kl/day) (INR/kl) (INR)
5 100 000 1 000 000 15 000 1.89 2.08 5 200 000 2 000 000 30 000 1.91 2.06 5 500 000 2 000 000 75 000 1.85 2.12 5 500 000 5 000 000 75 000 2.04 1.93 10 100 000 5 000 000 15 000 2.66 1.31 10 200 000 5 000 000 30 000 2.65 1.32 10 500 000 5 000 000 75 000 2.46 1.51 15 100 000 2 000 000 15 000 3.11 0.86 15 200 000 1 000 000 30 000 3.01 0.96 15 500 000 1 000 000 75 000 2.86 1.11 20 100 000 1 000 000 15 000 3.76 0.21 20 200 000 1 000 000 30 000 3.65 0.32 20 200 000 5 000 000 30 000 3.75 0.22 20 500 000 2 000 000 75 000 3.47 0.50 25 100 000 5 000 000 15 000 4.46 −0.48
25 200 000 2 000 000 30 000 4.32 −0.34
25 500 000 5 000 000 75 000 4.2 −0.22
30 100 000 1 000 000 15 000 5.14 −1.16
30 200 000 2 000 000 30 000 5.01 −1.03
DWESD
3, 65–105, 2010Rapid evaluation of water supply project
feasibility
K. Dutta Roy et al.
Title Page
Abstract Introduction
Conclusions References
Tables Figures
◭ ◮
◭ ◮
Back Close
Full Screen / Esc
Printer-friendly Version
Interactive Discussion