Sulpiride-Induced Hyperprolactinemia in Mature
Female Rats: Evidence for Alterations in The
Reproductive System, Pituitary and
Ovarian Hormones
6DUD0RVWDIDSRXU06F6DPDG=DUH3K'5DMDE$OL6DGUNKDQORX'9006F'96F
$EEDV$KPDGL'90'96F0D]GDN5D]L'903K'
'HSDUWPHQWRI%LRORJ\)DFXOW\RI%DVLF6FLHQFHV8UPLD8QLYHUVLW\8UPLD,UDQ 'HSDUWPHQWRI&RPSDUDWLYH+LVWRORJ\8UPLD8QLYHUVLW\8UPLD,UDQ 'HSDUWPHQWRI$QDWRP\)DFXOW\RI9HWHULQDU\0HGLFLQH8UPLD8QLYHUVLW\
8UPLD,UDQ
Abstract
%DFNJURXQG The prevalence of hyperprolactinemia following administration of conven-tional antipsychotic drugs requires further investigation. The current study is designed to
-ian follicular growth, gonadotropins, and ovar-ian hormones and to analyze the extent of potential problems in mammary glands.
0DWHULDOVDQG0HWKRGV
28 days.
5HVXOWV After 28 days, we dissected the rats’ ovarian tissues, uterine horns and mammary glands which were sent for histological analyses. We counted the num-bers of normal, atretic follicles and corpora lutea (CL). Serum levels of prolactin (PRL), estradiol, progesterone, follicle stimulating hormone (FSH) and luteinizing -cular atresia in different sizes associated with higher numbers of CL on the ova-ries. The mammary glands exhibited features of galactorrhea. There was remarkable
-metrium and peri-metrium thicknesses. The serum levels of PRL and progesterone significantly (p<0.05) increased, while the serum concentration of estradiol, LH
animals had unsuccessful attempts at mating and decreased pregnancy rates.
&RQFOXVLRQ
PRL level. In addition, an increased PRL level is largely dependent on the administered
Keywords: Sulpiride, Hyperprolactinemia, Follicular Growth, Atresia, Ovary
Citation: 0RVWDIDSRXU6=DUH66DGUNKDQORX5$$KPDGL$5D]L06XOSLULGHLQGXFHGK\SHUSURODFWLQHPLDLQPD
-WXUHIHPDOHUDWVHYLGHQFHIRUDOWHUDWLRQVLQWKHUHSURGXFWLYHV\VWHPSLWXLWDU\DQGRYDULDQKRUPRQHV,QW-)HUWLO6WHULO
5HFHLYHG2FW$FFHSWHG-XO
&RUUHVSRQGLQJ$GGUHVV32%R['HSDUWPHQWRI%LRORJ\ )DFXOW\RI%DVLF6FLHQFHV8UPLD8QLYHUVLW\8UPLD,UDQ
(PDLOV]DUH#XUPLDDFLU
5R\DQ,QVWLWXWH
Introduction
compound which selectively blocks postsynap-tic dopaminergic neurons. This compound
af-as an antipsychotic agent to treat schizophrenia. Similar to other medications of the same
clas-(1).
PRL is a polypeptide hormone secreted by the lactotroph cells of the anterior pituitary gland. Release of this hormone is pulsatory with ap-proximately 14 pulses per day and it displays significant daily rhythmic levels (2). The pri-mary physiologic role of PRL is to induce lac-tation and it interacts with other central nerv-ous system (CNS) and peripheral processes. Its secretion is influenced by both stimulatory and inhibitory endogenous and exogenous sub-stances (2, 3). Antipsychotic drugs are known to result in severe elevations in PRL levels (4-6). A remarkable majority of the patients with psychological problems are treated with con-ventional antipsychotic drugs such as risperi-done. These medications have been shown to significantly elevate serum PRL levels (7, 8). On the other hand, women of reproductive age are susceptible to medical disorders associated with hyperprolactinemia. It is well established that pathologically increased PRL secretion in-hibits follicular estradiol production (9), luteal phase defects, polycystic ovary syndrome (10), and severe follicular atresia(10, 11).
In addition to the mentioned disorders, the majority of hyperprolactinemia-induced clini-cal problems are attributed to the interference of PRL on the hypothalamic-pituitary-gonadal system. PRL suppresses gonadotropin-releasing hormone (GnRH) secretion from the hypothala-mus and directly interferes with the pituitary physiologic actions of the gonadotropin lute-inizing hormone (LH) and follicle stimulating hormone (FSH) on the gonads (12). On the other hand, follicular growth and granulosa cell physiologic function mainly depend on serum levels of FSH and LH. Therefore dysregula-tion of ovarian hormones in addidysregula-tion to their impaired correlation with the pituitary gland (feedback mechanisms) will lead to important
problems in fertilizing potential (13, 14).
Although conventional antipsychotic drugs are known to elevate PRL levels above the up-per limit of normal for both men and women, a reliable estimate for the dose-dependent effect of antipsychotic drug-induced follicular atresia is not readily available. Thus, the present study attempts to reconcile the dose-dependent effect
and histological structure of uterine horns in rats. Moreover, we have analyzed the mammary glands in order to illustrate hyperprolactinemia-induced histological changes.
Materials and Methods
Animals and medication administration methods
This experimental study was approved by-Urmia University. In this research, we used 40 mature female Wistar rats, 70 days of age that weighed 160 ± 20 g. The rats were pur-chased from the Animal Resources Center of the Faculty of Basic Sciences , Urmia Univer-sity, Urmia, Iran and were acclimatized in an environmentally controlled room
and 12 hours light/12 hours dark schedule). Food and water were given ad libi-tum. In this study all experiments conducted on animals were in accordance with the Urmia University Guidelines of the Ethical Commit-tee for research on laboratory animals. Fol-lowing a one week acclimation period, the animals were assigned to four groups (n=10
groups. The control group rats received food and water with no treatment. The control-sham group received daily intraperitoneally (IP) in-jections of 0.3 ml olive oil for 28 continual days. The test subgroups received either daily
28 continual days.
Histology and morphometry
were stained with hematoxylin-eosin (Merck Co, Germany). In the ovarian sections,
folli-<100, 101-200, 201-300, 301-400 and >400 μm. Follicular morphology was examined by a microscope with a ×40 objective lens (Olym-pus, Germany) magnification. Follicles that had a complete layer of flattened granulosa cells, oocytes with cytoplasm, and a normal nucleus were considered normal. Abnormal follicles were classified according to the presence of cy-toplasmic damage, a pyknotic nucleus, and com-bination of damaged nucleus and cytoplasm. Follicular number was estimated by counting the number of follicles in all slides (15). We also counted the corpus luteum (CL) number for each ovary. For histomorphometric analy-ses, the uterine horn endometrial epithelium, endometrium, myometrium and perimetrium thicknesses were evaluated by a morphometric lens (Olympus, Germany) with a ×40 objective lens. Ultimately the glands’ distribution and numbers per one mm2 were estimated.In
addi-tion, we assessed the diameters of the mammary gland lobules and histological features.
Serum sampling and hormonal analyses
Blood samples from corresponding animals were collected directly from the heart. Serum was centrifuged at 3000 g for 5 minutes and subjected to assessments for LH, FSH, proges-terone, estrogen (E2) and prolactin levels (PL).
Radioimmunoassay of PRL, LH and FSH in se-rum
We added a 100 μl aliquots of sera to the tubes which contained 100 μl labeled hormones with rabbit anti-sera in 0.01 M phosphate buffer (pH 7.6). Anti-rat PRL(Cisbio Bioassays, France)
μ
the mixture was subsequently centrifuged at 2000×g for 30 minutes and we used a gamma counter to measure the presence of radioactiv-ity in the pellets. The lower limit of sensitivradioactiv-ity for the rat PRL assay was 5.2 ng/tube, for LH it
was 1.3 ng/tube and for FSH it was 30 ng/tube. Intra-assay coefficient of variance for 10 times
PRL (5.9%). Calculated inter-assay coefficient variances for 10 times were 8.98% for FSH, 7.52% for LH and 5.9%for PRL.
Radioimmunoassay of serum estradiol and progesterone
Concentrations of serum estradiol were measured using CIS kits (Cisbio Bioassays, France) according to the methods given by the manufacturer. In brief, serum (300 μl) was ex-tracted with 3 ml ethy lether. The ether layer was evaporated under (N2) gas and the extract resuspended in 300 μl of 0.04 M phosphate
-tradiol (14000 cpm), each tube was incubated
room temperature. Goat anti-rabbit r-globulin (1 ml) was subsequently added and the mixture incubated for 15 minutes at room temperature. After centrifugation, the radioactivity in the re-sulting pellet was counted. The sensitivity was 1.8pg/tube. In order to evaluate serum level of progesterone we mixed serum (0.1 ml), ethyl-ether (1 ml) and propylene glycol (50 μ1). Af-ter the ether was evaporated under N2 gas, 0.5 ml phosphate buffer and 0.1 ml (20000 cpm) of iodo-progesterone were added to the tube. The mixture was incubated with 0.1 ml anti-serum raised in rabbits for 18 hours at room tem-perature. Then, 0.1 ml bovine serum gamma globulin and polyethylene glycol were added to the mixture followed by centrifugation for 10 minutes at 2000 g. We measured radioac-tivitylevels in the resulting pellet. The lower limit of sensitivity was 0.6 ng/ tube (16). The
(for 10 times) for estradiol and 4.8% (for 10 times) for progesterone. Calculated inter-assay
for 10 times) and progesterone (9.9% for 10 times).
Animal mating
we randomly chose 5 rats from each group. The chosen rats were adjoined with 1 mature normal male rat for 7 days. The vaginal plugs (white coagulum) were checked every day for 7 days and the vaginal smear process was conducted on cases with vaginal plugs in order to clarify the presence or absence of sperm. The day of sperm detection in smears was considered as day 0 of pregnancy and after 21-23 days (preg-nancy period in rats) the numbers of rats that were born were counted.
Statistical analysis
-perimental data were analyzed using analysis of
’s multiple range test (SPSS version 16.00, Chicago, IL, USA). Correlation
administered dosewas analyzed on an Indigo-2 O2 Work Station (Silicon Graphics, Mountain View, CA, USA) using Matlab (MathWorks Inc., Natick, MA, USA). P<0.05 was considered to be
statisti-Results
Total body weight gain
We observed no changes in total weight gain of
the end of the treatment period. Animals in high
(Fig 1A, B).
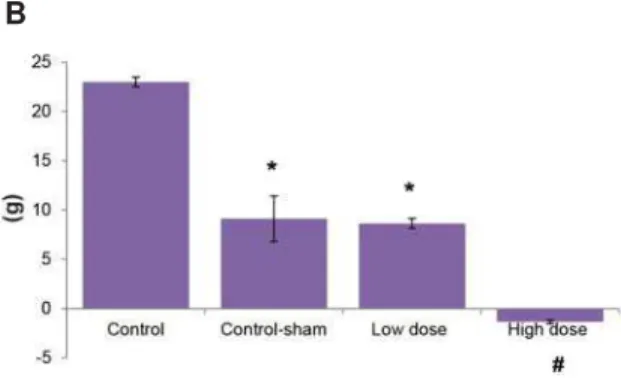
Fig 1: A. Total body weight changes in control, control-sham and test groups. A comparison between primary body
ZHLJKWJDLQ3%:*ZLWK¿QDOERG\ZHLJKWJDLQ)%:*
showed that F.BWG remarkably decreased in the high dose sulpiride (SPD) group. B. P.BWG ratio to F.BWG was
nega-WLYH LQ WKH KLJK GRVH 63'DGPLQLVWHUHG JURXS 6LJQL¿ -cant differences (p<0.05) between F.BWG versus P.BWG of the high dose SPD group and #; remarkable differences (p<0.05) between control-sham and low dose SPD groups with high dose SPD group (n=10 for each group). All data are presented as mean ± SD.
Ovarian follicular growth, atresia and corpus lu-teum (CL)
decreased in comparison to control and control-sham animals. Both left and right ovaries from the control and control-sham groups contained folli-cles in various stages of development that included primary, secondary and tertiary follicles of differ-ent sizes (<100 μm to >400 μm), whereas there was no large antral follicle (>400 μm) in the high
animals the cortex of the ovaries (left and right) were covered with small antral atretic follicles (<100-200 μm). Atresia was mostly present in fol-licles <100 μm and additionally observed in
201-μ
Comparing the rate of normal follicles between the control, control-sham and test groups revealed
This reduction was dose-dependent; animals that
normal follicles. The highest rate of normal fol-licles between the test groups was observed in the
are depicted in table 2. We observed that animals
numbers of CL compared to the control and control-sham groups (Fig 3).
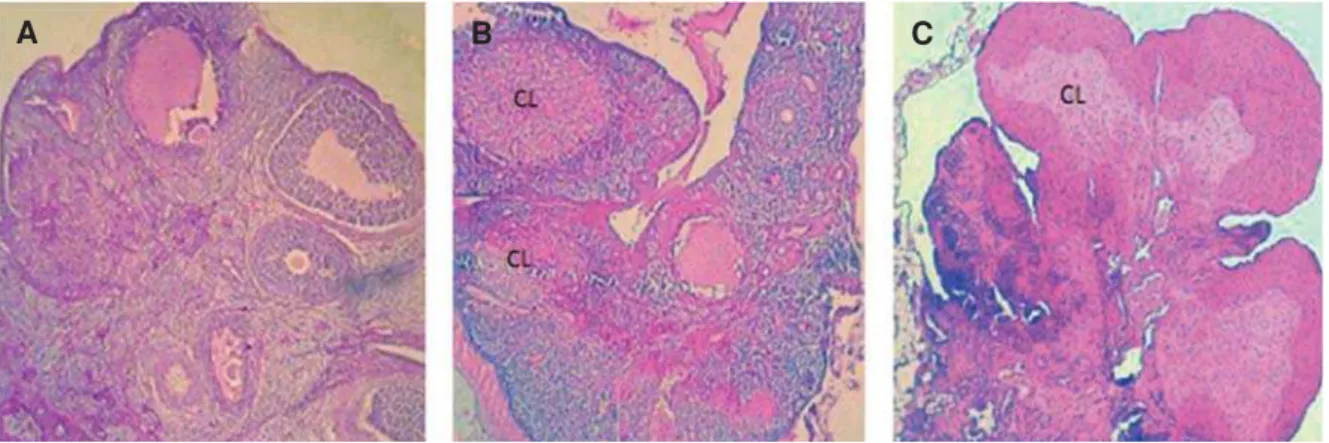
A
Fig 2: Cross-section from an ovary. A. Control group ovary showed different size follicles and one corpus luteum (CL) that remained from the previous cycle. B. Low dose sulpiride (SPD) group ovary showed sporadic CL and atretic follicles. C. High
GRVH63'JURXSQRWHODUJHDQGDFWLYH&/ZLWKRXWIROOLFXODUJURZWK+HPDWR[\OLQHRVLQVWDLQLQJîPDJQL¿FDWLRQ
Table 1: Mean numbers of atretic follicles on the right and left ovaries of different study groups. Sulpiride (SPD)
adminis-WUDWLRQVLJQL¿FDQWO\LQFUHDVHGIROOLFXODUDWUHVLDLQERWKWKHULJKWDQGOHIWRYDULHV
$WUHWLFIROOLFOHVRIULJKWRYDULHV
!P P
P P
P *URXSV
1.43 ± 0.50 3.17 ± 0.11
12.14 ± 1.80 7.57 ± 1.18
4.31 ± 1.10 &RQWURO
3.30 ± 0.05 3.78 ± 3.19
13.10 ± 1.10 8.14 ± 2.20
5.14 ± 1.19 &RQWUROVKDP
1.25 ± 0.89 1.25 ± 0.95*
3.50 ± 4.43* 10.25 ± 6.60*
15.75 ± 3.24 /RZGRVH63'
0.75 ± 0.50* 1.11 ± 0.98*
1.50 ± 0.38*#
23.25 ± 7.41*# 26.25 ± 2.08*#
+LJKGRVH63'
$WUHWLFIROOLFOHVRIOHIWRYDULHV
1.70 ± 0.60 2.80 ± 1.00
11.19 ± 2.26 6.25 ± 1.70
3.48 ± 2.80 &RQWURO
2.10 ± 0.75 14.12 ± 1.10
14.16 ± 1.13 9.14 ± 1.80
6.70 ± 0.05 &RQWUROVKDP
0.25 ± 0.02* 1.75 ± 0.62*
3.75 ± 1.61* 14.52 ± 4.79
16.50 ± 2.84* /RZGRVH63'
0.00 ± 0.00*#
0.00 ± 0.00*#
1.00 ± 0.70*#
20.00 ± 6.24*#
36.33 ± 3.15*#
+LJKGRVH63'
,QGLFDWHVLJQL¿FDQWGLIIHUHQFHVSEHWZHHQGDWDRI63'DGPLQLVWHUHGJURXSVZLWKFRQWURODQGFRQWUROVKDPJURXSV
and #; Remarkable differences (p<0.05) between low dose SPD group and high dose SPD group. All data are presented as mean ± SD.
Fig 3: Mean number of corpus luteum (CL) per ovary in different groups. Control and control-sham animals exhib-ited lower numbers of CLs which remained from previous cycles. Sulpiride (SPD)-dosed animals showed higher
num-EHUVRI&/VSHURYDU\6LJQL¿FDQWGLIIHUHQFHVS
between SPD-administered groups with control and control-sham animals (n=10 for each group). All data are presented as mean ± SD.
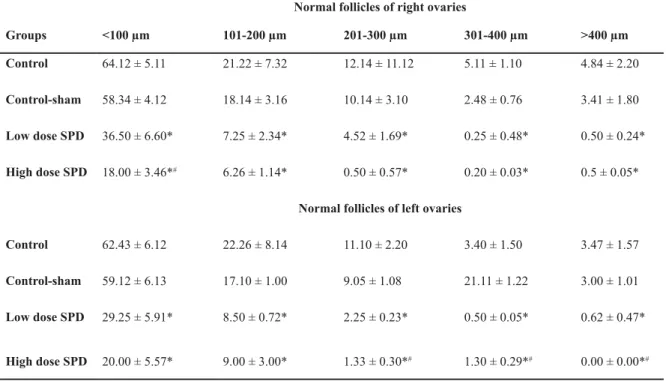
Table 2: Mean size of normal follicles on right and left ovaries in different groups. Sulpiride (SPD) administration
VLJQL¿FDQWO\LQFUHDVHGQRUPDOIROOLFOHVLQERWKULJKWDQGOHIWRYDULHV
1RUPDOIROOLFOHVRIULJKWRYDULHV
!P P
P P
P *URXSV
4.84 ± 2.20 5.11 ± 1.10
12.14 ± 11.12 21.22 ± 7.32
64.12 ± 5.11 &RQWURO
3.41 ± 1.80 2.48 ± 0.76
10.14 ± 3.10 18.14 ± 3.16
58.34 ± 4.12 &RQWUROVKDP
0.50 ± 0.24* 0.25 ± 0.48*
4.52 ± 1.69* 7.25 ± 2.34*
36.50 ± 6.60* /RZGRVH63'
0.5 ± 0.05* 0.20 ± 0.03*
0.50 ± 0.57* 6.26 ± 1.14*
18.00 ± 3.46*#
+LJKGRVH63'
1RUPDOIROOLFOHVRIOHIWRYDULHV
3.47 ± 1.57 3.40 ± 1.50
11.10 ± 2.20 22.26 ± 8.14
62.43 ± 6.12 &RQWURO
3.00 ± 1.01 21.11 ± 1.22
9.05 ± 1.08 17.10 ± 1.00
59.12 ± 6.13 &RQWUROVKDP
0.62 ± 0.47* 0.50 ± 0.05*
2.25 ± 0.23* 8.50 ± 0.72*
29.25 ± 5.91* /RZGRVH63'
0.00 ± 0.00*#
1.30 ± 0.29*#
1.33 ± 0.30*#
9.00 ± 3.00* 20.00 ± 5.57*
+LJKGRVH63'
6LJQL¿FDQWGLIIHUHQFHVSEHWZHHQGDWDRI63'DGPLQLVWHUHGJURXSVZLWKFRQWURODQGFRQWUROVKDPJURXSVDQG#;
Remarkable differences (p<0.05) between low dose SPD group with high dose SPD group. All data are presented as mean ± SD.
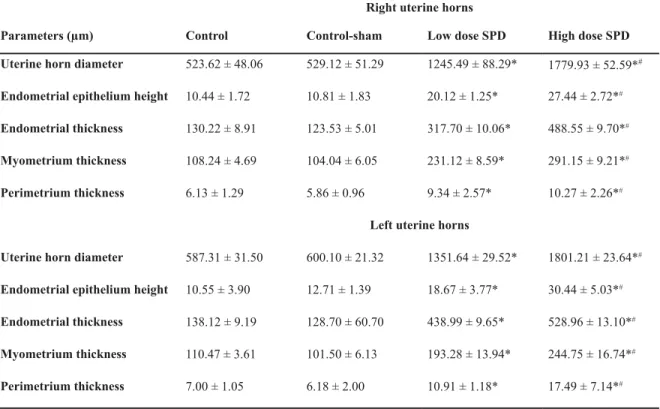
Uterine horn histomorphometry
Comparing the uterine horn endometrial epitheli-um height (left and right) between all groups showed
control and control-sham animals. This impairment
epithelium. Simultaneously the endometrial, myo-metrium and perimyo-metrium thicknesses in both side uterine hornswere remarkably (p<0.05) increased
-metrial glands per mm2 of the endometrium were
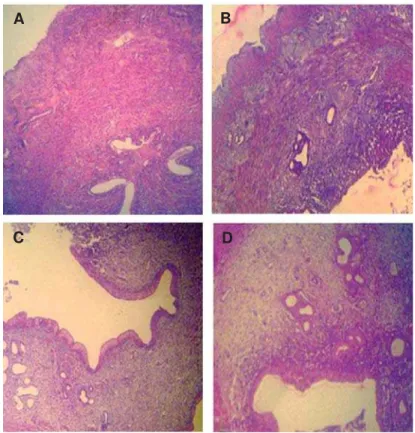
Fig 4: Cross-section from the uterine horn. There are no remarkable histological changes between control. A. And control-sh-am, B. Animals uterine horns. Normal endometrial thickness and gland distribution is seen in the uterine horns of both groups. C. Low dose sulpiride (SPD) group shows elevated endometrial thickness associated with increased glandular tissue. D. High
GRVH63'JURXSVKRZVVLJQL¿FDQWO\LQFUHDVHGHQGRPHWULDOWKLFNQHVVDQGJODQGGLVWULEXWLRQSHUPP2 of endometrium compared to the other groups. (Hematoxylin-eosin staining, ×PDJQL¿FDWLRQ
Fig 5: Mean distribution of glands per mm2 of uterine endometrium in different groups. Sulpiride (SPD) administration
in-FUHDVHGJODQGQXPEHUVLQWKHHQGRPHWULXP6LJQL¿FDQWGLIIHUHQFHVSEHWZHHQ63'DGPLQLVWHUHGJURXSVZLWKFRQWURO DQGFRQWUROVKDPDQLPDOVQ IRUHDFKJURXS7KHUHDUHQRVLJQL¿FDQWGLIIHUHQFHVS!EHWZHHQORZDQGKLJKGRVH
SPD-administered groups. All data are presented as mean ± SD.
A B
Mammary gland morphometry
Light microscopic analyses showed that the lac-tating alveolus diameter in glands and the distri-bution of lactiferous ducts remarkably (p<0.05)
-analyses showed that simultaneous with remarka-ble secretory alveoli and ductal development,there were fatty globules observed in the secretory and ’
control and control-sham animals had inactive lob-ules and secretory ducts. The data for histomor-phometric analyses are shown in table 4.
Serum levels of PRL, LH, FSH, estradiol and progesterone
Biochemical analyses showed that the serum lev
-Table 3: Histomorphometric data for uterine horns in different groups. Sulpiride (SPD) administration increased uterine horn diameter by elevating endometrial, myometrium and perimetrium thicknesses
5LJKWXWHULQHKRUQV +LJKGRVH63' /RZGRVH63' &RQWUROVKDP &RQWURO 3DUDPHWHUVP
1779.93 ± 52.59*# 1245.49 ± 88.29*
529.12 ± 51.29 523.62 ± 48.06
8WHULQHKRUQGLDPHWHU
27.44 ± 2.72*#
20.12 ± 1.25* 10.81 ± 1.83
10.44 ± 1.72 (QGRPHWULDOHSLWKHOLXPKHLJKW
488.55 ± 9.70*#
317.70 ± 10.06* 123.53 ± 5.01
130.22 ± 8.91 (QGRPHWULDOWKLFNQHVV
291.15 ± 9.21*#
231.12 ± 8.59* 104.04 ± 6.05
108.24 ± 4.69 0\RPHWULXPWKLFNQHVV
10.27 ± 2.26*#
9.34 ± 2.57* 5.86 ± 0.96
6.13 ± 1.29 3HULPHWULXPWKLFNQHVV
/HIWXWHULQHKRUQV
1801.21 ± 23.64*#
1351.64 ± 29.52* 600.10 ± 21.32
587.31 ± 31.50 8WHULQHKRUQGLDPHWHU
30.44 ± 5.03*#
18.67 ± 3.77* 12.71 ± 1.39
10.55 ± 3.90 (QGRPHWULDOHSLWKHOLXPKHLJKW
528.96 ± 13.10*#
438.99 ± 9.65* 128.70 ± 60.70
138.12 ± 9.19 (QGRPHWULDOWKLFNQHVV
244.75 ± 16.74*#
193.28 ± 13.94* 101.50 ± 6.13
110.47 ± 3.61 0\RPHWULXPWKLFNQHVV
17.49 ± 7.14*#
10.91 ± 1.18* 6.18 ± 2.00
7.00 ± 1.05 3HULPHWULXPWKLFNQHVV
6LJQL¿FDQWGLIIHUHQFHVSEHWZHHQGDWDRI63'DGPLQLVWHUHGJURXSVZLWKFRQWURODQGFRQWUROVKDPJURXSVDQG
Remarkable differences (p<0.05) between low dose SPD group with high dose SPD group. All data are presented as mean ± SD.
contrast, control and control-sham animals showed constant PRL levels. A comparison of LH and FSH
showed that serum LH and FSH levels remarkably (p<0.05) decreased in animals that received either
administration doses, we observed no statistically
the progesterone level remarkably increased in
Fig 6: Cross-section from mammary gland. Note inactive mammary glands in control. A. And control-sham, B. groups. De-veloped secretory alveoli and ducts are presented in low dose, C. and high dose, D. Sulpiride (SPD)-administered groups. The lactating alveolus diameter in the glands and the distribution of lactiferous ducts considerably increased in SPD-administered
DQLPDOV+HPDWR[\OLQHRVLQVWDLQLQJîPDJQL¿FDWLRQ
Table 4: Histomorphometric data for mammary gland lobules in different groups. Sulpiride (SPD) administration increased the lobular diameter, which was dose dependent
0DPPDU\JODQGV
+LJKGRVH63' /RZGRVH63'
&RQWURO&RQWUROVKDP 3DUDPHWHUVP
251.35±29.28*#
135.88±16.39* 48.42 ± 4.22
47.85 ± 3.13 /REXODUGLDPHWHU
*; Significant differences (p<0.05) between data of SPD-administered groups with control and control-sham groups and
#; Remarkable differences (p<0.05) between low dose SPD group with high dose SPD group. All data are presented as
mean ± SD.
A B
Fig 7: Mean serum levels of estradioland progesterone A. lute-inizing hormone (LH) andfollicle stimulating hormone (FSH) B. and prolactin (PRL) C. in different groups. Marked data
LQGLFDWHVLJQL¿FDQWGLIIHUHQFHVSEHWZHHQORZDQGKLJK
dose sulpiride (SPD) groups (n=10 for each group) with con-trol and concon-trol-sham groups (n=10 for each group). There are remarkable differences (p<0.05) between serum levels of pro-gesterone and PRL of low and high dose SPD groups. All data
DUHSUHVHQWHGDVPHDQ6'6LJQL¿FDQWSGLIIHU -ence between marked groups with each other and with control and control-sham groups.
Fig 8: The correlation between prolactin (PRL) levels with luteinizing hormone (LH). A. and between PRL and folli-cular stimulating hormone (FSH). B. in different groups (n=10 for each group). There are negative correlations be-tween the serum levels of PRL with LH (r2=0.974) and FSH (0.969).
Fertilizing indexes and neonates
Analysis of the fertilizing index in the control,
fertilizing index with no neonates. In contrast the control and control-sham animals showed positive fertilizing indexes with 31 and 19 neo-nates, respectively (Table 5).
A
B
C
A
Table 5: Fertilizing index (pregnant rats) and number of neonates after animals were adjoined. Sulpiride (SPD) administration lowered the fertilizing index to zero. There were no neonates observed in the SPD groups
+LJKGRVH63' /RZGRVH63'
&RQWUROVKDP &RQWURO
3DUDPHWHUVP
4 4
4 4
5DWVQ
0 0
75 100
)HUWLOL]LQJLQGH[
0 0
19 31
1HRQDWHVQ
6LJQL¿FDQWGLIIHUHQFHVSEHWZHHQGDWDRI63'DGPLQLVWHUHGJURXSVZLWKFRQWURODQGFRQWUROVKDPJURXSVDQG
Remarkable differences (p<0.05) between low dose SPD group with high dose SPD group. All data are presented as mean ± SD.
Discussion
-mia effect on the development and consecutive atresia of different sized follicles and investigated the histological alterations in uterine horns and mammary glands. The obtained results revealed
increased PRL level correlated with alterations in serum LH and FSH levels. The plasma levels of
-lar atresia in different sizes. The uterine horns had
mammary glands were manifested with galactor-rhea features.
It is well established that PRL secretion is regu-lated via secretion of dopamine in the tubero-
in-located on the surface of the pituitary lactotroph cells. Conventional antipsychotic drugs block the -sults in the loss of inhibitory effects of dopamine (17). The results from our biochemical analyses support the mentioned hypothesis; accordingly,
-actinemia but also induced hyperprol-actinemia is enhanced according to the dose administered.
It is well known that PL inhibits follicular estra-diol production (9, 13, 18). In rodents, estrogen is essential for follicular growth, differentiation and for preventing preantral and early antral follicle ap-optosis in rats (19). Histological observations have
demonstrated
remarkably increased atresia (different sizes); these ovaries had higher numbers of CL. On the other hand, according to the dose, the serum level of estro-gen decreased with simultaneous increase in
proges-Thus, increased PRL levels with a synergistic effect of progesterone resulted in remarkable follicular atre-sia. Of note, smaller size follicles at the high dose and
animals were remarkable for atresia which suggested
dependent on the administered dose. These impair-ments might not only attributeto a higher level of PRL butthey might attribute to CL resistance from previous cycles that in turn lead to severe follicular atresia, which did not allow estradiol secretion to
re-administered animals proved the above theory.
indicated, the increased level of PRL can largely affect gonadotropins. Our analyses have shown
-istered groups. In patients who have been treated with antipsychotic-drugs, reduced synthesis and secretion of the GnRH in the hypothalamus is able to decrease enough stimulation for LH and FSH secretion in the pituitary gland (20). Therefore,
resist-ance which was delivered from the previous cycle -tered animals. Inhibited follicular growth (marked
groups proved this theory. In order to evaluate the biological activity of CLs, we investigated the serum levels of progesterone. Observations dem-onstrated that the serum level of progesterone
re-considerably active. Additionally, because of in-creased levels of progesterone and absence of an appropriate feedback for androgens and estradiol secretion, in order to start a new cycle (21, 22), fol-licular growth depression occurred in the ovaries
Light microscopic observations demonstrated
glandular structure of the endometrium in both
considering the luteotrophic effect of PRL and the simultaneous increased progesterone level, we hypothesized that following an increased level of PRL and accomplishing this impairment with
higher concentration of progesterone, there was an increase in endometrial thickness and gland
distri-remarkably higher gland numbers per mm2 of
en-dometrium.
Mammary gland alveolar development, alveo-lar epithelium proliferation and/or differentiation largely depend on PRL hormone stimulation (20, 23). Histological analyses showed increased fatty globules in mammary glands and intra-lobular
These features have shown that the intensity of galactorrhea majorly depends on the PRL level
administered group. From the above mentioned -licular growth the ovulation ratio will decrease severely which in turn leads to a negative
fertiliz-proven by our results of the fertilizing indexes in the different groups. Accordingly animals in the
indexes and there were no neonates following ad-joining the animals with normal male rats (Fig 9).
%ORFNVK\SRWKDODPXVSLWXLWDU\ D[LV*Q5+
5HGXFHGHVWUDGLROOHYHO
6WRSSHGIROOLFXODUJURZWK
)6+
/+
/+
Estradiol
SPD administration
3LWXLWDU\JODQG
+\SRWKDODPXV
*Q5+
6WLPXODWHVRYXODWLRQ
)6+
Granulosa cell mitosis
&
)ROOLFXODUJURZWK
Conclusion
widely used as an antipsychotic drug, the rats
serum PRL levels that might be several-fold greater than the upper limit of normal.
Adminis -prolactinemia was associated with a disturbance in the levels of essential reproductive hormones, estradiol and progesterone. The PRL-associated disturbances in gonadotropins and reproductive
follicular growth and resulted in galactorrhea
fea-as a PRL-elevating antipsychotic drug, decrefea-ased the fertilizing index especially at the higher dose. All the above mentioned results were remarkably
Acknowledgements
We wish to thank Mr. Ali Karimi, staffmem-ber of the Histology Laboratory for his kind as-sistance with laboratory analyses. We express our appreciation to the Faculties of Biology and Veterinary Medicine, Urmia University, Urmia, Iran who supported the current research. The authors declare that there is no conflict of inter-est.
References
1. 3D\QH05+RZLH3:0F1HLOO\$6&RRSHU:0DUQLH0
.LGG/6XOSLULGHDQGWKHSRWHQWLDWLRQRISURJHVWR
-JHQ RQO\ FRQWUDFHSWLRQ %U 0HG -&OLQ 5HV (G
2. ,VKL]XND%4XLJOH\0(<HQ663LWXLWDU\KRUPRQH
UHOHDVHLQUHVSRQVHWRIRRGLQJHVWLRQHYLGHQFHIRU QHXURHQGRFULQHVLJQDOVIURPJXWWREUDLQ-&OLQ(Q
-GRFULQRO0HWDE
3. 0HOPHG67KH3LWXLWDU\&DPEULGJH0$%ODFNZHOO
6FLHQFH
4. :HVVHOPDQQ8:LQGJDVVHQ.*DODFWRUUKHDVXE
-MHFWLYH UHVSRQVH E\ VFKL]RSKUHQLF SDWLHQWV $FWD 3V\FKLDWU6FDQG
5. :HW]HO+:LHVQHU-+LHPNH&%HQNHUW2$FXWH
DQWDJRQLVPRIGRSDPLQH'OLNHUHFHSWRUVE\DPL
-VXOSULGH HIIHFWV RQ KRUPRQH VHFUHWLRQ LQ KHDOWK\ YROXQWHHUV-3V\FKLDWU5HV
6. :LQGJDVVHQ . :HVVHOPDQQ 8 6FKXO]H 0RQNLQJ
+*DODFWRUUKHDDQGK\SHUSURODFWLQHPLDLQVFKL]R
-SKUHQLFSDWLHQWVRQQHXUROHSWLFVIUHTXHQF\DQGHWL
-RORJ\1HXURSV\FKRELRORJ\
7. %UHLHU$0DOKRUWD$.6X733LQDOV'$(OPDQ,
$OGHU&0HWDO&OR]DSLQHDQGULVSHULGRQHLQFKURQLF VFKL]RSKUHQLD (IIHFWV RQ V\PSWRPDWRORJ\ SDUNLQ
-VRQLDQVLGHHIIHFWVDQGQHXURHQGRFULQHUHVSRQVH $P-3V\FKLDWU\
8. .LQRQ%-*LOPRUH-$/LX++DOEUHLFK803UHYD
-OHQFH RI K\SHUSURODFWLQHPLD LQ VFKL]RSKUHQLF SD
-WLHQWVWUHDWHGZLWKFRQYHQWLRQDODQWLSV\FKRWLFPHGL
-FDWLRQVRUULVSHULGRQH3V\FKRQHXURHQGRFULQRORJ\ 6XSSO
9. -RQDVVHQ -$ %DNHU 63 0F1HLOO\ $6 /RQJWHUP
K\SHUSURODFWLQDHPLD UHGXFHV EDVDO EXW QRW DQGUR
-JHQVWLPXODWHGRHVWUDGLROSURGXFWLRQLQVPDOODQWUDO IROOLFOHVRIWKHUDWRYDU\-(QGRFULQRO
357-362.
10. .DOLVRQ % :DUVKDZ 0/ *LERUL * &RQWUDVWLQJ HI
-IHFWV RI SURODFWLQ RQ OXWHDO DQG IROOLFXODU VWHURLGR
-JHQHVLV-(QGRFULQRO
11. 0DODUNH\ :% *RRGHQRZ 7- /DQHVH 55 'LXUQDO
YDULDWLRQ RI SURODFWLQ VHFUHWLRQ GLIIHUHQWLDWHV SLWXL
-WDU\WXPRUVIURPWKHSULPDU\HPSW\VHOODV\QGURPH $P-0HG
12. 'HOO 6- /D+RVWH *- :LGPDUN &% 6KDSLUR 50
3RWNLQ6*0DUVKDOO-)&KURQLFWUHDWPHQWZLWKFOR
-]DSLQHRUKDORSHULGROGLIIHUHQWLDOO\UHJXODWHVGRSD
-PLQHDQGVHURWRQLQUHFHSWRUVLQUDWEUDLQ6\QDSVH
13. 7VDL0RUULV&+*KRVK0+LUVKILHOG$1:LVH30
%URGLH$0,QKLELWLRQRIRYDULDQDURPDWDVHE\SUR
-ODFWLQLQYLYR%LRO5HSURG
14. 9LOODQXHYD/$0HQGH],$PSXHUR6/DUUHD)7KH
SURODFWLQ LQKLELWLRQ RI IROOLFOHVWLPXODWLQJ KRUPRQH LQGXFHGDURPDWDVHDFWLYLW\LQFXOWXUHGUDWJUDQXORVD FHOOVLVLQSDUWW\URVLQHNLQDVHDQGSURWHLQNLQDVH& GHSHQGHQW0RO+XP5HSURG
15. ,VUDHO\ 7 'DIQL + *UDQRW ' 1HYR 1 7VDIULUL $ Neeman M. Vascular remodeling and angiogenesis
LQHFWRSLFRYDULDQWUDQVSODQWV$FUXFLDOUROHRISHUL
-F\WHVDQGYDVFXODUVPRRWKPXVFOHFHOOVLQPDLQWH
-QDQFH RI RYDULDQ JUDIWV %LRO 5HSURG
2055-2064.
16. 7VXVKLPD61DND]DZD12JDZD-&RPSDFWUDGL
-RLPPXQRDVVD\RIVHUXPSURJHVWHURQHE\,OD
-EHOHGSURJHVWHURQH7KH:RUOGRI2EVWHW*\QHFRO
17. +DOEUHLFK 8 .LQRQ %- *LOPRUH -$ .DKQ /6 (O
-HYDWHGSURODFWLQOHYHOVLQSDWLHQWVZLWKVFKL]RSKUH
-QLDPHFKDQLVPVDQGUHODWHGDGYHUVHHIIHFWV3V\
-FKRQHXURHQGRFULQRORJ\6XSSO
18. 0DUNVWURP(6YHQVVRQ(FK6KDR56YDQEHUJ%
%LOOLJ + 6XUYLYDO IDFWRUV UHJXODWLQJ RYDULDQ DSRS
-WRVLVGHSHQGHQFHRQIROOLFOHGLIIHUHQWLDWLRQ5HSUR
-GXFWLRQ
19. %LOOLJ + )XUXWD , +VXHK$M (VWURJHQV LQKLELW DQG
DQGURJHQVHQKDQFHRYDULDQJUDQXORVDFHOODSRSWR
-VLV(QGRFULQRORJ\
20. :LHFN$+DGGDG30$QWLSV\FKRWLFLQGXFHGK\SHU
-SURODFWLQHPLD LQ ZRPHQ SDWKRSK\VLRORJ\ VHYHU
-LW\DQGFRQVHTXHQFHV%U-3V\FKLDWU\
199-204.
21. 3DKXMD'1'HOXFD+)6WLPXODWLRQRILQWHVWLQDOFDO
-FLXP WUDQVSRUW DQG ERQH FDO-FLXP PRELOL]DWLRQ E\ SURODFWLQLQYLWDPLQ'GHILFLHQWUDWV6FLHQFH
-ODWRUV RI DQJLRJHQHVLV 1HZV 3K\VLRO 6FL
23. &KHQ+::HLHU++HLQLJHU+-+XHEQHU5-7X
-PRULJHQHVLV LQ VWUDLQ ':- PLFH DQG LQGXFWLRQ E\