WHAT DIMENSIONS DISCRIMINATE USERS TO CONSIDER A PRESENTATION
WEBSITE TO BE CREDIBLE OR NOT CREDIBLE?
ŢUGULEA OANA
PHD LECTURER
, UNIV. “AL. I. CUZA”
-
IAŞI
e-mail:[email protected]
Abstract
The purpose of this research is to configure a credibility assessment function based on students’ perceptions on
Websites credibility’s dimensions evaluation. The hypothesis of the study is that there are certain credibility dimensions
that better discriminate between Internet users. The investigated target consists of students in the second and third year of study from a Faculty of Economics and Business Administration in Romania. The objectives are: (1) to identify the
presentation Websites’ credibility dimensions that better discriminate between students that consider a presentation Website to be credible or not credible; (2) to create a statistical discriminant function that predicts to which of the two groups one user belongs to: those who believe the site is credible and those who believe the site is not credible; (3) to identify dimensions that discriminate between the two groups for two cases – second year of study and third year of
study students. For the overall group, the most important dimension is “expertise”. “Ease of use” and “site etiquette”
are also important dimensions in discriminating between groups. For second year of study students, the most important
discriminator dimension is also “expertise”, followed by “ease of use”. Among the most important discriminating
dimensions for third year of study students are “site etiquette” and “ease of use”.
Keywords: credibility, discriminant analysis, dimension, construct, Website
JEL classification: M31, M39
1. Introduction
The new Business Age is driven by the Internet technology. This new business level is also named as „The New
Economy” in the specialty literature of the last two decades. This vast network of networks gives the possibility to
connect at any moment and any place to any kind of information. People (and customers as well) use the Internet in order to communicate, to have fun, to get information while companies use it in order to create efficient customer and partner relationships, to promote, to sell and/or to distribute products.
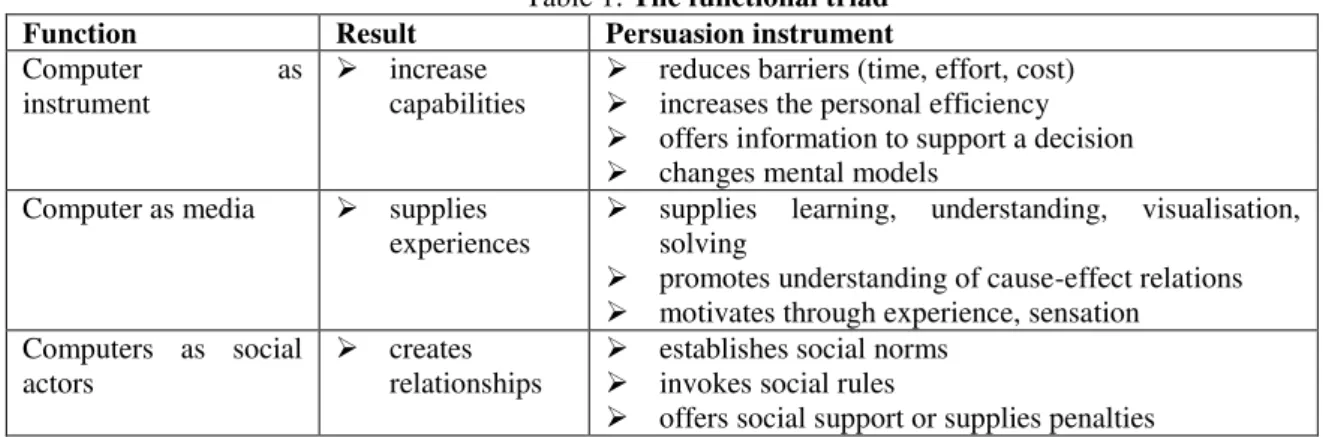
The functional triad explained by Fogg (2003), reveals that technology can change attitudes and behaviours; credible instruments, credible media and credible social actors result into increasing the power of persuasion [12].
Table 1: The functional triad
Function Result Persuasion instrument
Computer as instrument
increase capabilities
reduces barriers (time, effort, cost)
increases the personal efficiency
offers information to support a decision
changes mental models Computer as media supplies
experiences
supplies learning, understanding, visualisation, solving
promotes understanding of cause-effect relations
motivates through experience, sensation Computers as social
actors
creates relationships
establishes social norms
invokes social rules
offers social support or supplies penalties
(Source: Fogg, B. J. (2003). “Motivating, Influencing, and Persuading Users” in Jacko, J.A., Sears, A., The Human –
Computer Interaction Handbook, Lawrence Erlbaum Associated, New Jersey, 365)
Persuasion is integrated in the human experience activity; one of the most important fields to use persuasion is online and offline commerce [12].
There are various fields of persuasion, such as commerce, preventing health, personal finances, safety, personal management, conserving the environment, personal relationship, community implications, etc; examples for each of the fields of persuasion mentioned before could be persuading to buy certain products, to give up smoking, to create and adhere to a personal budget, to drive safe, to avoid postponing activities, to reuse the plastic bags, to keep contact with parents, to volunteer at community centre activities [12].
Researchers investigated the credibility construct of Websites in various contexts [6]-[10]-[15]-[23]. Each study supposed different types of Websites to be analyzed, various types of investigated targets and various types of
identifying the credibility’s dimensions. This aspect led to various dimensions of the construct of credibility of Websites, such as: real world feel, trustworthiness, expertise, honesty, confident, commercial implications, amateurism, good will, tailoring, accurate, sufficiency, profoundness, ease of use, decision, complete, etc.
The purpose of this research is to configure a credibility assessment function based on students’ perceptions on
Websites credibility’s dimensions evaluation. The hypothesis of the study is that there are certain credibility dimensions that better discriminate between Internet users. The investigated target consists of students in the second and third year of study from a Faculty of Economics and Business Administration in Romania. The objectives are: (1) to identify the
presentation Websites’ credibility dimensions that better discriminate between students that consider a presentation Website to be credible or not credible; (2) to create a statistical discriminant function that predicts to which of the two groups one user belongs to: those who believe the site is credible and those who believe the site is not credible; (3) to identify dimensions that discriminate between the two groups for two cases – second year of study and third year of study students. For the overall group, the most important dimension is “expertise”. “Ease of use”and “site etiquette”
are also important dimensions in discriminating between groups. For second year of study students, the most important dimension is also “expertise”, followed by “ease of use”. Among the most important discriminating dimensions for
third year of study students are “site etiquette”and “ease of use”.
2. Research method
The purpose of this research is to configure a credibility assessment function based on students’ perceptions on Websites credibility’s dimensions evaluation.
There were 206 investigated students from the Faculty of Economics and Business Administration, University
“Alexandru Ioan Cuza” of Iaşi, Romania, selected on a random bases from different specialisations in second and third year of study. First year of study students were not included in this research as they are not very familiar to online shopping and the online shopping information.
Data was collected using a quantitative survey. The instrument was a questionnaire fulfilled by each respondent while investigating a clothes presentation Website without any online acquisition options.
The instrument consisted of 11 items representing dimensions of presentation commercial Websites’ credibility [22]: (-) sincere communication; (-) ease of use; (-) real world feel; (-) company’s experience; (-) trustworthiness; (-) framing adverts; (-) expertise; (-) site etiquette; (-) site - user connection; (-) information support; (-) site length. At the end of the questionnaire there was one more item to assess the general overall credibility of the analysed Website.
In order to collect data, a 7 points scale was used for each item:
1 – criterion is not accomplished; 7 – criterion is very accomplished
The questionnaire consisted of the items in the list below:
1. The site makes me believe it sincerely, openly communicates, in detail 2. The site is easy to use
3. The company is real
4. The company has experience in its field of activity 5. I trust this site
6. Adverts are well framed
7. The company is an expert in its field
8. The site has a good image in the online environment 9. The site creates a good connection with the users 10. Information delivered on the site is well supported 11. The site is small
3. Results
Objective 1: identifying the presentation Websites’ credibility dimensions that better discriminate between students that consider a presentation Website to be credible or not credible
In order to identify the presentation Websites’ credibility’s dimensions that discriminate between users,
discriminant analysis was conducted. Before running the discriminant analysis, the answers corresponding to the last
item (“Howcredible is the overall site?”) were coded. The points 1-2-3 from the scale were coded with 1, considering users that evaluated the Website not to be credible. The points 5-6-7 from the scale were coded with 2, considering users that evaluated the Website to be credible. The point 4 from the scale was not coded. Users that evaluated the
Website to be neutral from the overall credibility point of view were not included in the analysis, as these users didn’t
have a position concerning the analysed Website.
Out of the 206 students, only 146 respondents were included in the discriminant analysis. 60 users had missing values for one or more of the independent variables included in the discriminant analysis, missing value for the
dependent variable or evaluated the Website’s overall credibility with the code 4 that was excluded from the analysis. Table 2: Analysis Case Processing Summary
Unweighted Cases N Percent
Valid 149 72,3
Excluded Missing or out-of-range group codes 49 23,8
At least one missing discriminating variable 3 1,5 Both missing or out-of-range group codes and at least
one missing discriminating variable 5 2,4
Total 57 27,7
Total 206 100,0
The Sig. corresponding to Wilk’s Lambda value indicates that the discriminant function can be considered to
significantly discriminate between the two groups.
Table 3: Wilks' Lambda
Test of Function(s) Wilks'
Lambda Chi-square df Sig.
1 ,326 158,731 11 ,000
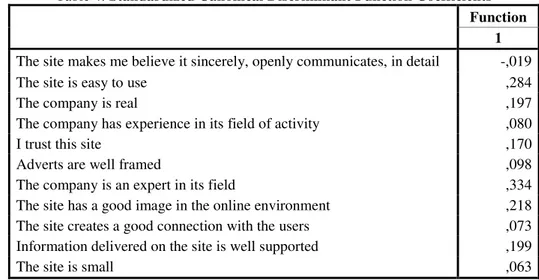
The dimensions that best discriminate between students are: (1) expertise, (2) ease of use and (3) site etiquette. The expertise dimension has the biggest value in the Standardised Canonical Discriminant Function Coefficients table. This value places this variable as the one that best discriminates between users.
Table 4: Standardized Canonical Discriminant Function Coefficients
Function 1
The site makes me believe it sincerely, openly communicates, in detail -,019
The site is easy to use ,284
The company is real ,197
The company has experience in its field of activity ,080
I trust this site ,170
Adverts are well framed ,098
The company is an expert in its field ,334 The site has a good image in the online environment ,218 The site creates a good connection with the users ,073 Information delivered on the site is well supported ,199
The site is small ,063
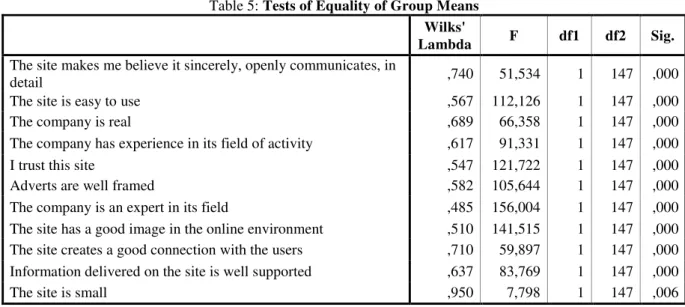
Objective 2: creating a statistical discriminant function that predicts to which of the two groups belongs one user: those who believe the site is credible and those who believe the site is not credible
Table 5: Tests of Equality of Group Means
Wilks'
Lambda F df1 df2 Sig.
The site makes me believe it sincerely, openly communicates, in
detail ,740 51,534 1 147 ,000
The site is easy to use ,567 112,126 1 147 ,000
The company is real ,689 66,358 1 147 ,000
The company has experience in its field of activity ,617 91,331 1 147 ,000
I trust this site ,547 121,722 1 147 ,000
Adverts are well framed ,582 105,644 1 147 ,000
The company is an expert in its field ,485 156,004 1 147 ,000 The site has a good image in the online environment ,510 141,515 1 147 ,000 The site creates a good connection with the users ,710 59,897 1 147 ,000 Information delivered on the site is well supported ,637 83,769 1 147 ,000
The site is small ,950 7,798 1 147 ,006
In the analysis presented above, the canonical discriminant function coefficients table presents the discriminant functions coefficients.
The function that predicts to which group a new user might fall into (those who believe the site to be credible or those who believe the site not to be credible) is listed below:
overall credibility = -4.697 -0.013 * sincere communication + 0.193 * ease of use + 0.136 * real world feel +
0.056 * company’s experience + 0.125 * trustworthiness + 0.063 * framing adverts + 0.260 * expertise + 0.164 * site
etiquette + 0.042 * site - user connection + 0.121 * information support + 0.034 * site length (1) Table 6: Canonical Discriminant Function Coefficients
Function 1
The site makes me believe it sincerely, openly communicates, in detail -,013
The site is easy to use ,193
The company is real ,136
The company has experience in its field of activity ,056
I trust this site ,125
Adverts are well framed ,063
The company is an expert in its field ,260 The site has a good image in the online environment ,164 The site creates a good connection with the users ,042 Information delivered on the site is well supported ,121
The site is small ,034
(Constant) -4,697
Unstandardized coefficients
As the percentage of original grouped cases correctly classified is higher than the cross-validated grouped cases classified, the function is valid.
Table 7: Classification Results(b,c)
Credibility recoded
Predicted Group Membership
Total
1,00 2,00
Original Count 1,00 60 4 64
2,00 8 77 85
Ungrouped
cases 24 25 49
2,00 9,4 90,6 100,0
Ungrouped
cases 49,0 51,0 100,0
Cross-validated(a) Count 1,00 55 9 64
2,00 10 75 85
% 1,00 85,9 14,1 100,0
2,00 11,8 88,2 100,0
a Cross validation is done only for those cases in the analysis. In cross validation, each case is classified by the functions derived from all cases other than that case.
b 91,9% of original grouped cases correctly classified. c 87,2% of cross-validated grouped cases correctly classified.
Objective 3: identifying dimensions that discriminate between the two groups for two cases – second year of study and third year of study students
Discriminant analysis was conducted after splitting the file in two sub-groups: second year of study students and third year of study students. The discriminant analysis was conducted for each of the subgroups.
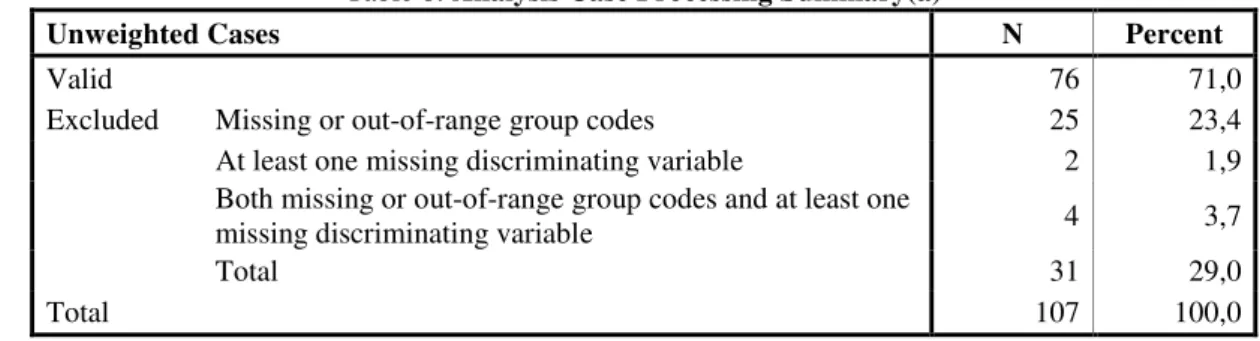
There were 76 students included in the second year of study students discriminant analysis. 31 second year of study respondents had missing values for one or more of the independent variables, missing values for the dependent variable or ranked the overall Website credibility level with 4 points.
Table 8: Analysis Case Processing Summary(a)
Unweighted Cases N Percent
Valid 76 71,0
Excluded Missing or out-of-range group codes 25 23,4
At least one missing discriminating variable 2 1,9 Both missing or out-of-range group codes and at least one
missing discriminating variable 4 3,7
Total 31 29,0
Total 107 100,0
a year_of_study = 2
The Sig. value corresponding to Wilk’s Lambda value indicates that the discriminant function can be considered to significantly discriminate between the two groups for the second year of study respondents.
Table 9: Wilks' Lambda(a)
Test of Function(s) Wilks'
Lambda Chi-square df Sig.
1 ,292 84,247 11 ,000
a year_of_study = 2
The dimension of expertise is the most important discriminator for second year of study students. The second important discriminator is company’s experience.
Table 10: Standardized Canonical Discriminant Function Coefficients(a)
Function 1
The site makes me believe it sincerely, openly communicates, in detail -,231
The site is easy to use ,237
The company is real ,271
The company has experience in its field of activity ,382
I trust this site ,059
Adverts are well framed -,071
The site is small -,062 a year_of_study = 2
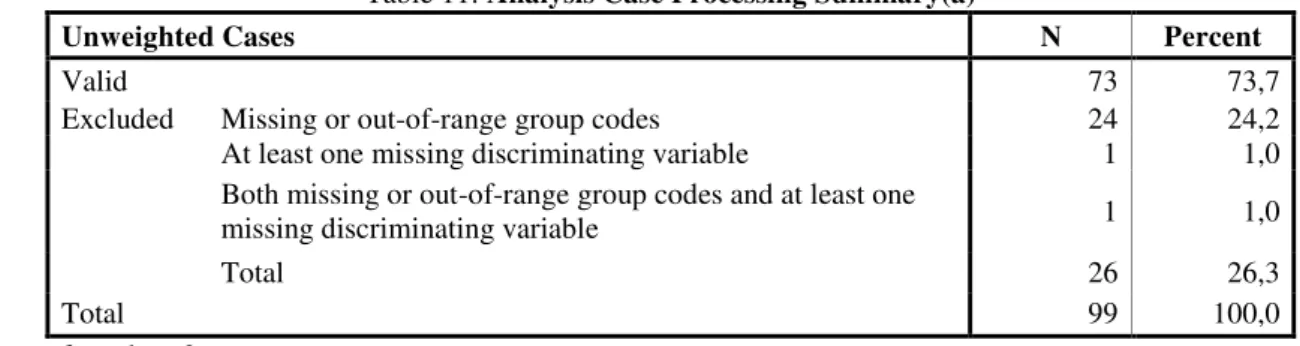
There were 73 students included in the third year of study students discriminant analysis. 26 third year of study respondents had missing values for one or more of the independent variables, missing values for the dependent variable or ranked the overall Website credibility level with 4 points.
Table 11: Analysis Case Processing Summary(a)
Unweighted Cases N Percent
Valid 73 73,7
Excluded Missing or out-of-range group codes 24 24,2
At least one missing discriminating variable 1 1,0 Both missing or out-of-range group codes and at least one
missing discriminating variable 1 1,0
Total 26 26,3
Total 99 100,0
a year_of_study = 3
The Sig. value corresponding to Wilk’s Lambda value indicates that the discriminant function can be considered to significantly discriminate between the two groups for the third year of study respondents.
Table 12: Wilks' Lambda(a)
Test of Function(s) Wilks'
Lambda Chi-square df Sig.
1 ,345 69,717 11 ,000
a year_of_study = 3
The dimension of site etiquette is the most important discriminator for third year of study students. The second important discriminator is ease of use.
Table 13: Standardized Canonical Discriminant Function Coefficients(a)
Function 1
The site makes me believe it sincerely, openly communicates, in detail ,090
The site is easy to use ,332
The company is real ,165
The company has experience in its field of activity -,279
I trust this site ,272
Adverts are well framed ,217
The company is an expert in its field ,050 The site has a good image in the online environment ,468 The site creates a good connection with the users -,097 Information delivered on the site is well supported ,262
The site is small ,049
a year_of_study = 3
4. Conclusions
The hypothesis was confirmed as there are certain credibility dimensions that better discriminate between Internet users.
For the overall group, the most important dimension is expertise. Ease of use and site etiquette are also important dimensions in discriminating between groups.
The contribution of this study is that it reveals important credibility dimensions of clothes presentation Websites that best discriminate between students, analysed from three perspectives: all students, second year of study students and third year of study students.
Research limits
One limitation is that the study considered students from one faculty only (Faculty of Economics and Business Administration of Iasi, Romania). A complete study should involve students from various types of faculties and various geographical areas. Also, the sample size might be a limitation. Although the number of respondents exceeds 5 respondents per each variable in each of the three discriminant analysis presented in this paper, a larger sample could bring out more revealing results.
Future research
As the results slightly differ between the two subgroups of respondents, a new research question can be
formulated: what factors change third year of study students’ perceptions in the online world, comparing to the second
year of study students?
Acknowledgements
This work was supported by the European Social Fund through Sectoral Operational Programme Human Resources Development 2007 –2013, project number POSDRU/159/1.5/S/134197, project title “Performance and Excellence in Doctoral and Postdoctoral Research in Economic Sciences Domain in Romania.
5. References
1Feleagă N., Malciu L.,Reformă după reformă: Contabilitatea din România în faŃa unei noi provocări, vol. I Eseuri si analiza standardelor IAS –IFRS, Editura Economică, Bucuresti, 2005;
2Hennie van Greuring - Standarde Intenaţionale de Raportare Financiară, Ghid practic, Ed.Irecson, Bucureşti, 2005;
[1] Ceobanu, C., Anton, O. (2008), Information Credibility in Marketing. A Psychological Perspective, Proceedings
of the Romanian Marketing Conference, COROMAR, Editura Universităţii „Al. I. Cuza”,Iaşi
[2] Ciobanu, O., Aspecte ale evaluarii credibilitatii site-urilor comerciale, Polirom, Iasi, 2011
[3] Ciobanu, O., Bobâlcă, C. (2011), Importance of credibility' s factors- an analysis on a particular category of web sites, Anale. Seria Stiinte Economice. Timisoara, Vol. XVII, Mirton Timisoara
[4] Chun Ho, K. L. (2006), Perceived Credibility, Loneliness, and Self-disclosure on Blogs, diseration thesis, Chinese University in Hong Kong, coordinator: Prof. Louis Leung
[5] Clark, D. B., Slotta, J. D. (2000), Evaluating Media-Enhancement and Source Authority on the Internet: The Knowledge Integration Environment. International Journal of Science Education, 22, 859–871.
[6] Eisend, M. (2006), Source Credibility Dimensions in Marketing Communication – A Generalized Solution. Journal of Empirical Generalisations in Marketing, 10(1), 1-33
[7] Flanagin, A.J., Metzger, M.J. (2000), Perceptions of Internet Information Credibility, Journal of Mass Communication Quarterly, 77(3), 515-540.
[8] Flanagin, A. J., Metzger, M. J. (2003), The Perceived Credibility of Personal Web Page Information as Influenced by the Sex of the Source, Computers in Human Behavior, 19, 683–701
[9] Fogg, B.J., Tseng, H. (1999), The Elements of Computer Credibility,Proceedings of ACM CHI 99 Conference on Human Factors in Computing Systems (New York: ACM Press, 1999): pp. 80-87 http://www.acm.org/pubs/articles/proceedings/chi/302979/p80-fogg/p80-fogg.pdf
[10] Fogg, B. J., Marshall, J., Laraki, O. Osipovich, A., Varma, C., Fang, N., Paul, J., Rangnekar, A., Shon, J., Swani, P., Treinen, M. (2001), What Makes Web Sites Credible? A Report on a Large Quantitative Study, CHI, Volume No. 3, Issue No. 1
[11] Fogg, B.J. (2002), Stanford Guidelines for Web Credibility, A Research Summary from the Stanford Persuasive Technology Lab. Stanford University. www.webcredibility.org/guidelines - april 2010
[12] Fogg, B. J. (2003), Motivating, Influencing, and Persuading Users in Jacko, J.A., Sears, A., The Human –
Computer Interaction Handbook, Lawrence Erlbaum Associated, New Jersey
[13] Fogg, B. J. (2003b), Prominence-Interpretation Theory: Explaining How People Assess Credibility Online, CHI, Ft. Lauderdale Florida, USA, ACM 1-58113-630-7/03/0004 http://credibility.stanford.edu/pit.html
[14] Garrison, B. (2003), The Perceived Credibility of Electronic Mail In Newspaper Newsgathering, paper presented to the Newspaper Division Conference, Association for Education in Journalism and Mass Communication, Kansas City, Missouri
[15] Hong, T. (2006), The Influence of Structural and Message Features on Web Site Credibility, Journal of the American Society for Information Science and Technology, 57, 114–127
[17] Hovland, C. I., Janis, I. L., Kelley, H. H., Communication and Persuasion, New Heaven, Conn.: Yale University Press, 1953
[18] Jacko, J.A., Sears, A., The Human – Computer Interaction Handbook, Lawrence Erlbaum Associated, New Jersey, 2003
[19] Jain, S. P., Posavac, S., S. (2001), Prepurchase Attribute Verifiability, Source Credibility, and Persuasion, Journal of Consumer Psychology, 11(3), 169–180
[20] Lehmann, D.R., Gupta, S., Steckel, J.H., Marketing Research. Addison Wesley Longman, 1998 [21] Malhotra, N.K.,, Marketing Research. An Applied Orientation. New Jersey, Prentice Hall, 1996
[22] Manolica, A., Ciobanu, O., Bobalca, C., Sasu, C. (2011), A Method to Asses Credibility of Commercial Web SItes. One level to Change Consumers' Attitude and Behaviour, Proceedings of the International Conference on Management of Technological Changes, Democritus University of Thrace, Alexandroupolis, Greece
[23] Morrison, P. J. (2005), Online source credibility: Experts and fellow users, COMM 65020, Kent State University [24] Rieh, S. Y., Danielson, D. R. (2007), Credibility: A Multidisciplinary Framework, in B. Cronin (Ed.), Annual
Review of Information Science and Technology (Vol. 41, pp. 307-364). Medford, NJ: Information Today
[25] Savolainen, R. (2007), Media credibility and cognitive authority. The case of seeking orienting information, Information Research, 12(3) paper 319
[26] Stanford J., Tauber, E. R., Fogg, B. J. & Marable, L. (2002), Experts vs. Online Consumers: A Comparative
Credibility Study of Health and Finance Web Sites,
http://www.consumerwebwatch.org/pdfs/expert-vs-online-consumers.pdf, april 2010
[27] Tseng, S., Fogg, B. J. (1999), Credibility and computing technology, Communications of the ACM, 42(5), 39-44 [28] Wasserman, T. (2006), Report: Consumers Don't Trust Blogs, Brandweek, 10644318, Vol. 47, Issue 32