Proteome Profile of Swine Testicular Cells Infected with
Porcine Transmissible Gastroenteritis Coronavirus
Ruili Ma1,2, Yanming Zhang1*, Haiquan Liu3, Pengbo Ning1
1College of Veterinary Medicine, Northwest Agriculture & Forestry University, Yangling, Shaanxi, China,2College of Life Sciences, Northwest Agriculture & Forestry University, Yangling, Shaanxi, China,3School of Computer Science and Engineering, Xi’an Technological University, Xi’an, Shaanxi, China
Abstract
The interactions occurring between a virus and a host cell during a viral infection are complex. The purpose of this paper was to analyze altered cellular protein levels in porcine transmissible gastroenteritis coronavirus (TGEV)-infected swine testicular (ST) cells in order to determine potential virus-host interactions. A proteomic approach using isobaric tags for relative and absolute quantitation (iTRAQ)-coupled two-dimensional liquid chromatography-tandem mass spectrometry identification was conducted on the TGEV-infected ST cells. The results showed that the 4-plex iTRAQ-based quantitative approach identified 4,112 proteins, 146 of which showed significant changes in expression 48 h after infection. At 64 h post infection, 219 of these proteins showed significant change, further indicating that a larger number of proteomic changes appear to occur during the later stages of infection. Gene ontology analysis of the altered proteins showed enrichment in multiple biological processes, including cell adhesion, response to stress, generation of precursor metabolites and energy, cell motility, protein complex assembly, growth, developmental maturation, immune system process, extracellular matrix organization, locomotion, cell-cell signaling, neurological system process, and cell junction organization. Changes in the expression levels of transforming growth factor beta 1 (TGF-b1), caspase-8, and heat shock protein 90 alpha (HSP90a) were also verified by western blot analysis. To our knowledge, this study is the first time the response profile of ST host cells following TGEV infection has been analyzed using iTRAQ technology, and our description of the late proteomic changes that are occurring after the time of vigorous viral production are novel. Therefore, this study provides a solid foundation for further investigation, and will likely help us to better understand the mechanisms of TGEV infection and pathogenesis.
Citation:Ma R, Zhang Y, Liu H, Ning P (2014) Proteome Profile of Swine Testicular Cells Infected with Porcine Transmissible Gastroenteritis Coronavirus. PLoS ONE 9(10): e110647. doi:10.1371/journal.pone.0110647
Editor:Volker Thiel, University of Berne, Switzerland
ReceivedApril 10, 2014;AcceptedSeptember 19, 2014;PublishedOctober 21, 2014
Copyright:ß2014 Ma et al. This is an open-access article distributed under the terms of the Creative Commons Attribution License, which permits unrestricted use, distribution, and reproduction in any medium, provided the original author and source are credited.
Data Availability:The authors confirm that all data underlying the findings are fully available without restriction. All relevant data are within the paper and its Supporting Information files.
Funding:This work was supported by the National Natural Science Foundation of China (No. 31172339). The funder had no role in study design, data collection and analysis, decision to publish, or preparation of the manuscript.
Competing Interests:The authors have declared that no competing interests exist. * Email: zhangym@nwsuaf.edu.cn
Introduction
Porcine transmissible gastroenteritis coronavirus (TGEV) is an animal coronavirus that causes severe gastroenteritis in young TGEV-seronegative pigs. Various breeds of pigs, regardless of age, are susceptible to TGEV; however, the mortality rate for piglets under 2 weeks of age is the highest, reaching almost 100%. Diseased pigs often present with vomiting, dehydration, and severe diarrhea. Further, the disease is known to affect pigs in many countries throughout the world and an outbreak can cause enormous losses in the pig industry [1,2]. The pathogen, TGEV, which belongs to theAlphacoronavirusgenus of theCoronavirinae subfamily within the familyCoronaviridae, is an enveloped, non-segmented, single-stranded positive-sense RNA virus [3,4]. The envelop, core, and nucleocapsid of the TGEV virion contain four major structural proteins: the nucleocapsid (N) protein, the membrane (M) glycoprotein, the small envelope (E) protein, and the spike (S) protein [5]. The tropism and pathogenicity of the virus are influenced by the S protein, which has four major antigenic sites, A, B, C, and D, with site A being the major inducer of antibody neutralization [3,5]. The M protein, which plays a cen-tral role in virus assembly by interacting with viral ribonucleoprotein
(RNP) and S glycoproteins [6], is embedded within the virus mem-brane and interacts with the nucleocapsid, forming the core of TGEV virion. In addition, the N-terminal domain of the M protein is essential for interferon alpha (IFN-a) induction [7], which is involved in the host’s innate immune response. The E protein, a transmembrane protein that acts as a minor structural component in TGEV and affects virus morphogenesis, is essential for virion assembly and release [8].
TGEV RNA, along with the N protein, is infectious and invades the organism through the digestive and respiratory tracts, resulting in infection of the small intestinal enterocytes, villous atrophy, and severe watery diarrhea. These changes in intestinal health are known to be important during the pathogenesis of TGEV infection [9]. Furthermore, corresponding to these pathologic changes observed in vivo, TGEV can also propagate and cause cytopathic effects (CPEs) in multiple types of cultured cells, such as swine testicular (ST) cells, PK-15 cells, and villous enterocytes. Notably, ST cells are more susceptible to TGEV, and higher levels of virus replication have been observed in this cell line [10,11].
The full RNA genome of TGEV is approximately 28.5 kb in length and has a 59-cap structure and a poly(A) tail at the 39end. The 9 open reading frame (ORF) genes included in the TGEV
genome are arranged in the following order 59-la- lb-S-3a-3b-E-M-N-7-39. The first gene at the 59end consists of two large ORFs, ORF la and ORF lb, which constitute the replicase gene, known for its RNA-dependent RNA-polymerase and helicase activities, as well as other enzymes, such as endoribonuclease, 39–59 exoribo-nuclease, 29-O-ribose methyltransferase, ribose ADP 1’’ phospha-tase, etc. [12]. ORF2, ORF4, ORF5, and ORF6 encode the S, E, M, and N proteins, respectively, while ORF3a, ORF3b, and ORF7 encode non-structural proteins [13]. Some investigators have suggested that ORF3 may be related to viral virulence and pathogenesis [12], while ORF7 may interact with host cell proteins and play a role in TGEV replication [14]. In fact, a recent study indicates that plasmid-transcribed small hairpin (sh) RNAs targeting the ORF7 gene of TGEV is capable of inhibiting virus replication and expression of the viral target gene in ST cells in vitro [15]. Although we have some knowledge concerning the translation and function of these viral proteins, the interactions that occur between these proteins and host cell proteins are not fully understood.
Importantly, recent advances in proteomic technology have allowed for more in depth investigation of virus-host interactions, and different techniques have been successfully applied to identify altered proteins in infected host cells and tissues. For example, Sun et al. [16] have identified 35 differentially expressed proteins in PK-15 cells infected with classical swine fever virus (CSFV) using two-dimensional polyacrylamide gel electrophoresis (2D PAGE) followed by matrix-assisted laser desorption-ionization time-of-flight tandem mass spectrometry (MALDI-TOF-MS/MS). In addition, two-dimensional fluorescence difference gel electropho-resis (2D-DIGE) and MS/MS proteomic approaches have been applied to characterize protein changes occurring in host cells in response to porcine circovirus type 2 (PCV2) infection [17]. The same methods have also been studied for many other pathogenic animal viruses, including porcine reproductive and respiratory syndrome virus (PRRSV) [18], coronavirus infectious bronchitis virus (IBV) [19], severe acute respiratory syndrome-associated coronavirus (SARS-CoV) [20], and TGEV [21]. However, these conventional approaches based on 2D gel electrophoresis are not suitable for detecting low abundance, hydrophobic, or very acidic/ basic proteins. On the other hand, the isobaric tags for relative and absolute quantitation (iTRAQ) technique, in association with liquid chromatograph (LC), is a more advanced method for proteomic research, and is capable of detecting a much larger number of proteins, even those with low abundance, in addition to identifying and quantifying the proteins simultaneously [22]. To this end, Lu et al. [23] previously used the iTRAQ method to identify 160 significantly altered proteins in pulmonary alveolar macrophages (PAMs) infected with PRRSV. Similarly, this method has been used to investigate influenza virus infection in primary human macrophages [24], human immunodeficiency virus 1 (HIV-1) infection in CD4+
T cells [25], and Epstein–Barr virus (EBV) infection in nasopharyngeal carcinoma cell line [26]. Here, we report the first differential proteomic analysis of TGEV-infected and uninfected ST cells using iTRAQ labeling followed by 2D-LC-MS and bioinformatic analyses. The proteo-mic data obtained in this study will help to enhance our understanding of the host response to TGEV infection, but also provide new insights on the mechanisms of disease onset.
Materials and Methods
Cell culture and viral replication
ST cells were obtained from the American Type Culture Collection (ATCC). The cells were cultured in high-glucose
Dulbecco’s modified Eagle’s medium (DMEM; GIBCO, UK) containing 1% L-glutamine and 10% fetal bovine serum (FBS) (Hyclone, Logan, UT) at 37uC in 5% CO2. Culture medium was
replaced two to three times per week. The TGEV TH-98 strain was isolated from a suburb of Harbin, Heilongjiang province, China. The virus was propagated in ST cells and preserved at2 70uC in our laboratory.
TGEV infection
The monolayer of confluent ST cells was dispersed with 0.25% trypsin and 0.02% ethylenediaminetetraacetic acid (EDTA) and seeded in 6-cm cell culture flasks. After a 24 h incubation period, the culture medium was removed and the ST cells were washed with phosphate buffered saline (PBS, pH 7.4). The cells were then infected with the TGEV TH-98 strain at a 50% tissue culture infectious dose (TCID50) of 16103.53 viruses per well, with
absorption for 2 h at 37uC. Maintenance medium (DMEM medium supplemented with 2% FBS) was then added to the cells. A mock group of ST cells that were not infected with TGEV was used as a negative control for each of the following experiments. Three replicates of virus-infected and mock-infected cultures with different passage numbers were prepared at each time point. The morphological changes were observed under the light microscope at 24, 40, 48, and 64 hours post infection (hpi).
Reverse transcription polymerase chain reaction (RT-PCR) and real time quantitative PCR (qRT-PCR)
To determine the extent of TGEV infection, conventional RT-PCR and qRT-RT-PCR assays were performed to detect the viral N gene. Monolayers of ST cells were infected with TGEV as described above. Cells were collected from 24 to 80 hpi at 8 h intervals, and the total RNA of the infected cells was extracted using Trizol (Invitrogen). RNA samples were reverse-transcribed using PrimeScript RT reagent Kit (Takara Bio, Dalian, China), according to the manufacturer’s instructions. The RT reaction was incubated at 37uC for 15 min followed by 85uC for 5 s. A mixture of oligo dT primers and random 6 mers was used in the RT step. The cDNA was stored at220uC until further use.
PCR was performed for the TGEV N gene in a 25ml reaction mixture containing 1ml of the cDNA, 0.5ml of each forward (F) and reverse (R) primer, 12.5ml of Premix Taq (Takara Bio, Dalian, China), and 10.5ml DEPC water, starting with a 5 min denaturation at 95 C followed by 32 cycles of 30 s denaturation at 95 C, 30 s annealing at 56 C, and 40 s extension at 72 C. A final extension step was carried out at 72 C for 10 min. RT-PCR products were resolved on a 15 g/L agarose gel. The following PCR primers were used in this study: TGEV N (F, 59 -GAGC-AGTGCCAAGCATTACCC-39 and R, 59-GACTTCTAT CT-GGTCGCCATCTTC-39) andb-actin (F, 59 -GCAAGGACCTC-TACGCCAA-39and R, 59-CTGGAAGGTGGACAGCGAG-39). The mRNA expression level of the TGEV N gene was quantified using a SYBR Green assay on a Bio-Rad iQ5 real time PCR detection system as described previously [27]. We used the same primers listed above for qRT-PCR. Reactions were carried out in 50ml volumes containing 0.5ml of 206SYBR Green I, 2ml of cDNA template, 1ml of each F and R primer, 25ml of 26PCR buffer, and 20.5ml DEPC water. The cycling conditions were 94uC for 4 min, followed by 35 cycles of 94uC for 20 s, 60uC for 30 s, 72uC for 30 s, and then a final extension of 10 min at 72uC. The relative gene expression was determined with the 2(2DDCt) method [28], and the tests were performed in triplicate.
Proteome Profile of ST Cells Infected with TGEV
Protein isolation, digestion, and labeling with iTRAQ reagents
Following ST cell infection, cells were collected at 48 and 64 hpi by centrifugation at 3,000 rpm for 5 min at 4uC, washed twice with PBS, and 1 mL of iTRAQ lysis solution (8 M urea, 1% (w/v) dithiothreitol (DTT)) containing protease inhibitor was added. Then, the cells were put in an ice bath and broken up by sonication. The solution was then mixed for 30 min at 4uC. The soluble protein fraction was harvested by centrifugation at 40,000 6gfor 30 min at 4uC and the debris was discarded. The protein concentration was determined with the Bradford protein assay (2-D Quant Kit, Bestbio, China). A 100mg aliquot of protein from each sample was reduced, alkylated, and trypsin-digested as described in the iTRAQ protocol (AB Sciex, American), followed by labeling with the 4-plex iTRAQ Reagents Multiplex Kit according to the manufacturer’s instructions (AB Sciex, Ameri-can). Two virus-free samples at 48 h and 64 h were labeled with iTRAQ tags 114 and 115, while two TGEV-infected samples at 48 h and 64 h were labeled with tags 116 and 117. The labeled digests were then pooled, dried using a vacuum freeze drier (Christ RVC 2225, Germany), and preserved at220uC for later use.
2D LC-MS/MS analysis
The combined peptide mixtures were separated by reversed phase high-performance liquid chromatography (HPLC) (Ekspert ultraLC 100, AB Sciex, USA) on a Durashell-C18 reverse phase column (4.6 mm6250 mm, 5mm 100 A˚ , Agela). The mobile phases used were composed of 20 mM ammonium formate (pH 10) in water (labeled mobile phase A) and 20 mM ammonium formate (pH 10) in acetonitrile(ACN) (mobile phase B). The flow rate was 0.8 mL/min, and the elutant was collected into 48 centrifuge tubes at each minute after the first 5 min. Each aliquot was then dried by vacuum freezing.
The peptides were then analyzed with a nanoflow reversed-phase liquid chromatography-tandem mass spectrometry (nano-RPLC-MS/MS) system (TripleTOF 5600, AB Sciex, USA). The above 48 tubes were merged into 10 components dissolved in 2% ACN and 0.1% formic acid (FA), then centrifuged at 12,0006g for 10 min. The supernatant (8ml) was used for loading at a rate of 2ml/min, with a separation rate of 0.3ml/min. The mobile phase A used in this analysis was composed of 2% ACN and 0.2% FA, while mobile phase B was composed of 98% ACN and 0.1% FA. The following MS parameters were utilized: source gas parameters (ion spray voltage: 2.3 kV, GS1:4, curtain gas: 30 or 35, DP: 100 or 80); TOF MS (m/z: 350–1250, accumulation time: 0.25 s); and product ion scan (IDA number: 30, m/z: 100–1500, accumulation time: 0.1 s, dynamic exclusion time: 25 s, rolling CE: enabled, adjust CE when using iTRAQ reagent: enabled, CES: 5).
Data analysis and bioinformatics
Protein identification and quantification were performed with the ProteinPilot software (version 4.0, AB Sciex) using the Paragon algorithm. Each MS/MS spectrum was searched against a database of Sus scrofa protein sequences (NCBI nr, released in March 2011, downloaded from ftp://ftp.ncbi.nih.gov/genomes/ Sus_scrofa/protein/). The following search parameters were used: iTRAQ 4-plex (peptide labeled), cysteine alkylation with methyl methanethiosulfonate(MMTS), trypsin digestion, biological mod-ifications allowed, a thorough search, a detected protein threshold of 95% confidence (unused Protscore $1.3), and a critical false discovery rate (FDR) of 1%. The peptide and protein selection criteria for relative quantitation were performed as described previously, whereby only peptides unique for a given protein were
considered [29]. In addition, proteins with an iTRAQ ratio higher than 20 or lower than 0.05 as well as proteins in reverse database were removed [30].
To assign enriched Gene Ontology (GO) terms to the identified proteins, the differentially expressed proteins identified from iTRAQ experiments and all of the 4,112 measured proteins were classified based on their GO annotations using QuickGO (http:// www.ebi.ac.uk/QuickGO/), with UniProt ID (http://www. uniprot.org/?tab=mapping) as the data source. GO enrichment analysis of the differentially regulated proteins was evaluated using all of the 4,112 quantified proteins as background with hypergeo-metric distribution [31]. Categories belonging to biological processes, molecular functions, and cellular components that were identified at a confidence level of 95% were included in the analysis. The protein-protein interaction network for a select group of proteins was analyzed using the STRING 9.1 database (http://string-db.org/). Network analysis was set at medium confidence (STRING score.0.4).
Western blot analysis
Following ST cell infection with TGEV, the culture medium was removed after incubating for 48 h and 64 h; then, the cells were washed with cold PBS and collected after centrifugation at 3,000 rpm for 10 min. Cells were then lysed in RIPA lysis buffer with protease inhibitors (Applygen Technologies Inc., China). Cellular debris was removed by centrifugation at 12,0006gfor 5 min at 4uC, and the protein concentration was measured by Coomassie blue G250 staining. An equal amount (20mg) of cell lysate from each sample was separated using 10% SDS-PAGE and then transferred to polyvinyl difluoride (PVDF) membranes (Millipore, Bedford, USA). The PVDF membranes were then blocked with 5% (w/v) de-fatted milk powder dissolved in tris buffered saline and tween 20 (TBST) buffer (150 mM NaCl, 50 mM Tris, 0.05% Tween 20) for 1 h at 37uC. After blocking, membranes were incubated with anti-glyceraldehyde 3-phosphate dehydrogenase (GAPDH) mouse monoclonal antibody (1:3000; Western Biotechnology, China), anti-heat shock protein 90 alpha (Hsp90a/HSP90AA1) antibody (1:300; Abcam, Cambridge, UK), caspase 8 antibody (1:300; Abcam, Cambridge, UK), or anti-transforming growth factor b 1 (TGF-b1/TGFB1) antibody (1:300; Abcam, Cambridge, UK) overnight at 4uC, followed by HRP-conjugated secondary antibody (1:5000; Western Biotech-nology, China) for 1.5 h at 37uC. The membranes were then washed four times in TBST buffer for 5 min each time. Protein band detection was performed using ECL reagents (Applygen Technologies Inc., China), and the band intensities were analyzed using Labworks 4.6 software.
Results
Confirmation of TGEV infection in ST Cells
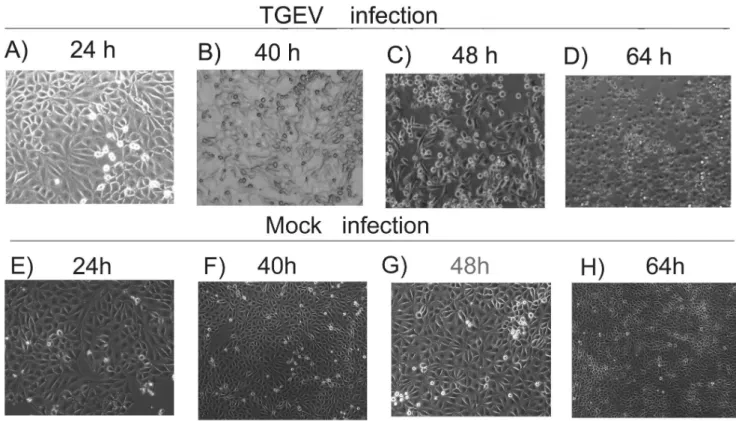
After introducing TGEV into the ST cells, we observed the induction of typical CPEs, including cell rounding, swelling, granular degeneration of the cytoplasm, cell detachment, and severely diseased cell morphology, from 40 to 64 h after inoculation (Figure 1 A–D) compared to the non-infected control cells (Figure 1 E–H). Virus infection at 48 and 64 h was also confirmed by RT-PCR detection of the viral N gene in the sample (Figure 2A).
Dynamic changes in viral gene expression in infected cells
To further identify the extent of TGEV infection, the mRNA expression levels of viral genes in infected cells were determined
Proteome Profile of ST Cells Infected with TGEV
using qRT-PCR. Comparative threshold (Ct) cycle values in three independent experiments were calculated and the results indicated that the average Ct value for the TGEV N gene ranged from 25.2 to 27.5. Correspondingly, the average Ct value observed for theb -actin control gene ranged from 19.6 to 21.0. The relative expression of TGEV N mRNA was calculated using the 2(–DDCT) method [28], and the change in expression at each time point is indicated in Figure 2B. These data show that, following infection, the viral mRNA levels increased gradually over time, and reached a peak at 48 hpi. Following this time point, the viral mRNA levels appear to decrease.
Protein identification by MS
In the infected ST cells, a total of 29,214 peptides and 4,364 proteins were detected (Table S1); however, only 4,112 proteins were quantified reliably (Table S2). Notably, the abnormal proteins, such as the proteins with iTRAQ ratio higher than 20 or lower than 0.05, which are not quantifiable [30], were removed and only proteins with reasonable ratios across all channels were investigated further. Figure 3A depicts the scatter plots for the log10 116/114 and log10 117/115 ratios in the iTRAQ
experi-ment. Linear regression analysis showed that correlation (R2
) was 0.58, with a p-value less than 0.05. These results suggest that the alterations in protein abundance due to virus infection were near-linear dependency between the two time points. In order to Figure 1. Morphological changes in TGEV-infected cells.ST cells were seeded into 6-cm culture plates, infected with TGEV, and the cytopathic effects (CPEs) were imaged at 24 (A), 40 (B), 48 (C), and 64 (D) hours following infection. Images of non-infected cells (mock infection) are shown for comparison at each time point (E, F, G, H).
doi:10.1371/journal.pone.0110647.g001
Figure 2. Validation of TGEV virus infection of ST cells.(A) RT-PCR validation of TGEV infection in ST cells at 48 hpi (I48) and 64 hpi (I64)
compared to the control at 48 h (C48) and 64 h (C64). A marker (M) was used to identify fragment size. (B) qRT-PCR analysis of changes in TGEV mRNA
expression levels in the ST cells over time. The changes in mRNA expression level at the various time points is indicated, and show that the expression level of TGEV increased gradually, reaching a peak at 48 h, then decreased dramatically. Values are the means of three repeated experiments. The error bars in the graphs represent the standard deviation.
doi:10.1371/journal.pone.0110647.g002
Proteome Profile of ST Cells Infected with TGEV
identify the proteins that were significantly different at each time point (infected/uninfected) or between the different time points, we analyzed the distribution of ratios for the identified proteins as shown in the Figure 3B. For the distribution range of the differentially expressed proteins identified at 48 hpi, shown in Figure 3C, a ratio higher than 3.35 or lower than 21.35 was defined as a statistically significant difference in protein expression. At 64 hpi, a ratio higher than 4.55 or lower than 22.15 was defined as a statistically significant difference in protein expression. According to analyses, the differentially expressed proteins identified were considered to show a significant upward or downward trend if their expression ratios were greater than 4.0 or less than 0.25 compared to the control group.
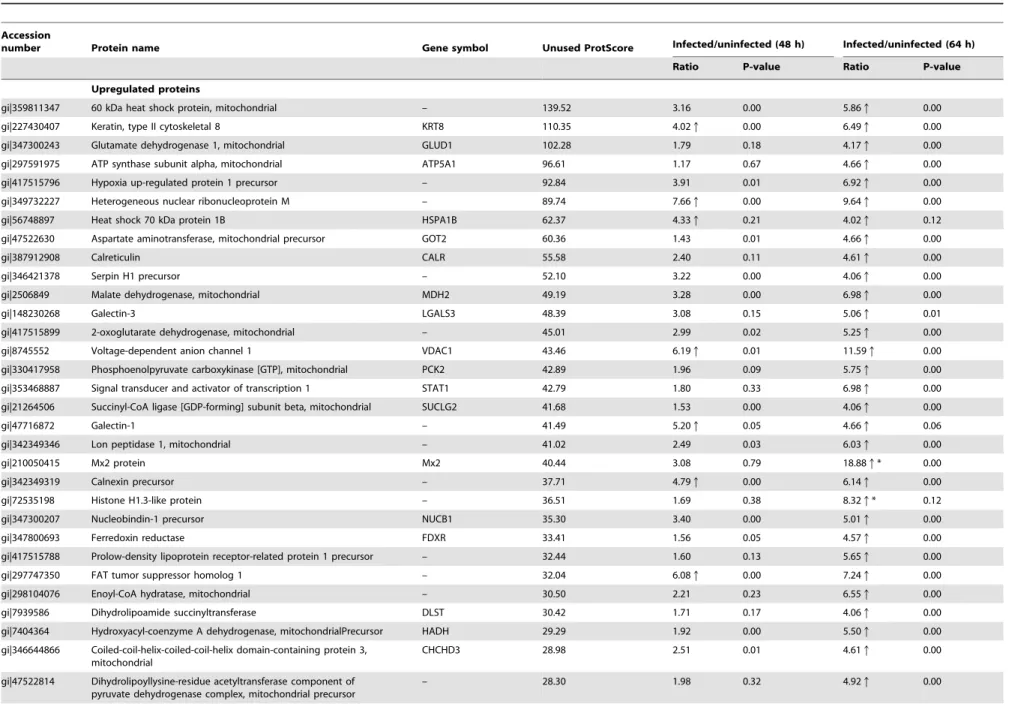
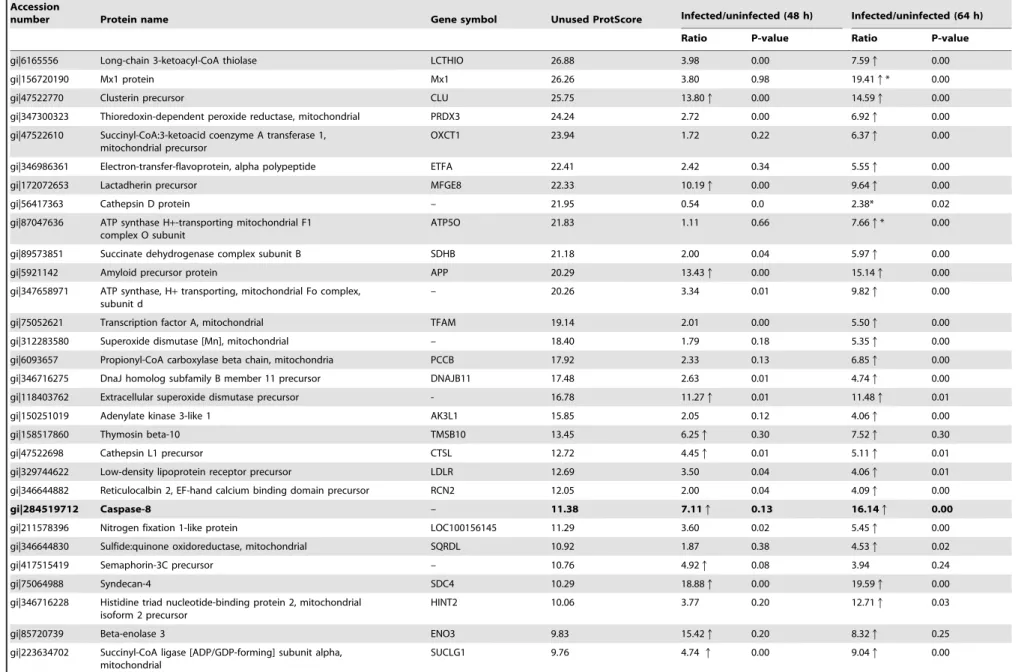
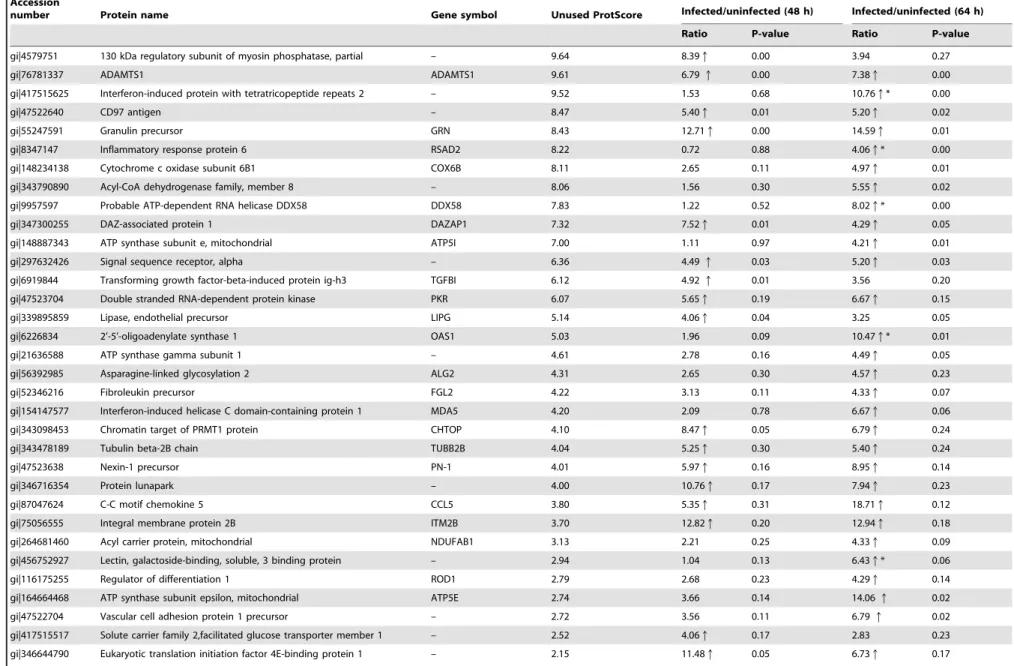
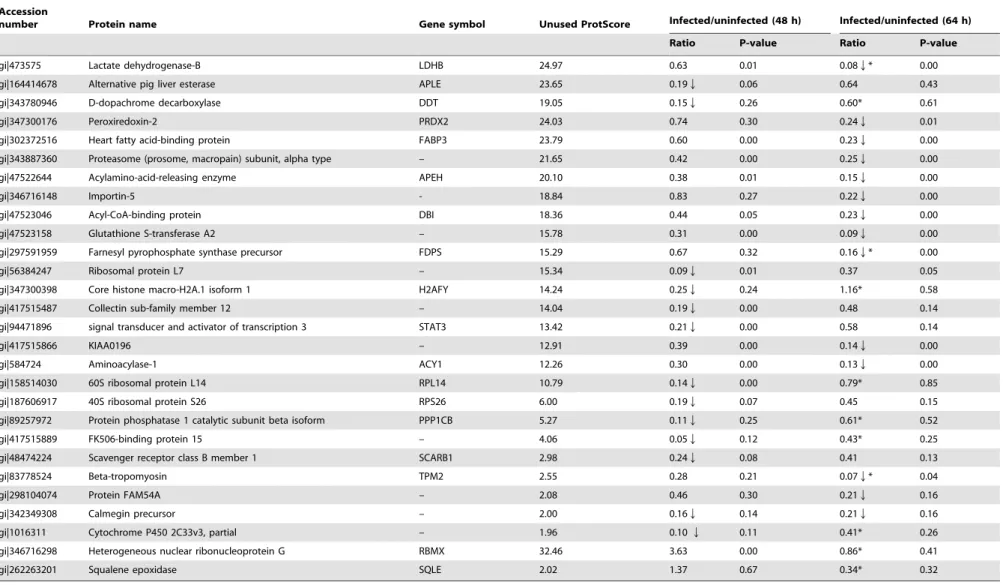
Using the criterion listed above, the expression of 146 proteins was significantly changed at 48 hpi (95 upregulated and 51 downregulated), while 219 proteins were significantly changed at 64 hpi (172 upregulated and 47 downregulated). Further, 72 proteins were identified to be significantly different between the two time points (54 upregulated and 18 downregulated), resulting in a total of 316 unique proteins being significantly altered during TGEV infection, including 162 predicted proteins (Table S3 and Table 1 (excluding the predicted proteins)). Because the current pig genome database is poorly annotated compared to the human genome database, there were numerous proteins that were unassigned or uncharacterized, resulting in a large number of
predicted proteins in our analysis. However, our ability to detect the unannotated proteins by MS demonstrates that they do existence in this species, and additional research concerning their function is warranted.
GO enrichment analysis
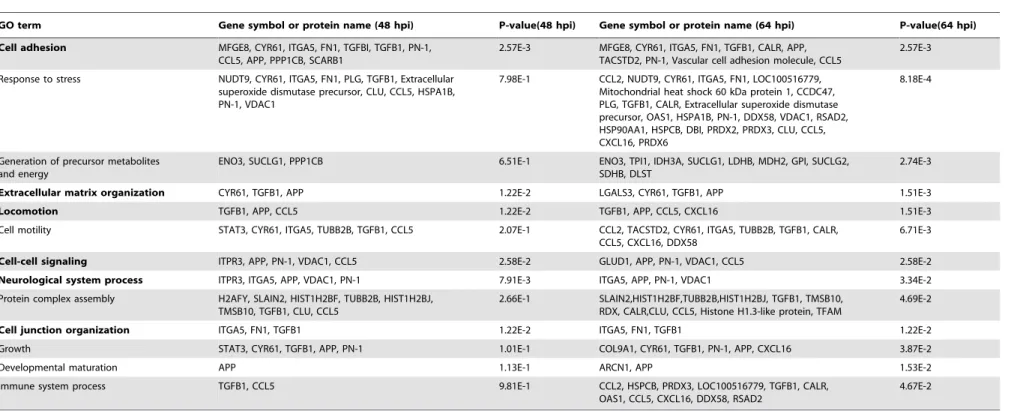
Biological process-based enrichment analysis of the differentially expressed proteins revealed that six common GO terms were significantly enriched in this set of proteins (p,0.05). Thus, it appears that in TGEV-infected ST cells at 48 and 64 hpi there are expression changes in proteins that are related to cell adhesion, neurological system processes, extracellular matrix organization, locomotion, cell junction organization, and cell-cell signaling. Moreover, at the later time point, 64 hpi, our GO term analysis also indicated that a significant number of the differentially expressed proteins were related to cellular stress (p = 8.18E-4), generation of precursor metabolites and energy (p = 2.74E-3), cell motility (p = 6.71E-3), protein complex assembly (p = 4.69E-2), growth (p = 3.87E-2), developmental maturation (p = 1.53E-2), and immune system processes (p = 4.67E-2) (Table 2).
To further investigate the localization pattern of these differentially expressed genes, a cellular component-based enrich-ment analysis was performed. At 48 hpi, we observed the significant enrichments in extracellular region (p = 1.29E-4), proteinaceous extracellular matrix (p = 1.62E-4), and extracellular Figure 3. Results of the iTRAQ ratios analysis.(A) A scatter plot showing the correlation between the log10infection/mock ratios at 48 hpi and
64 hpi for the 4,112 reliably quantified proteins in the iTRAQ experiment. Linear regression analysis shows that correlation (R2) was 0.58, with a p-value less than 0.05. (B) Histograms showing the distribution of protein ratios identified at 48 and 64 hpi. (C) The distribution range of differentially expressed proteins identified at 48 hpi. iTRAQ ratios higher than 3.3475 (p = 0.975) or lower than21.3475 (p = 0.025) were defined as statistically significant.
doi:10.1371/journal.pone.0110647.g003
Proteome Profile of ST Cells Infected with TGEV
Table 1.Differentially expressed proteins identified by iTRAQ analysis of ST cells infected with TGEV.
Accession
number Protein name Gene symbol Unused ProtScore Infected/uninfected (48 h) Infected/uninfected (64 h)
Ratio P-value Ratio P-value
Upregulated proteins
gi|359811347 60 kDa heat shock protein, mitochondrial – 139.52 3.16 0.00 5.86q 0.00
gi|227430407 Keratin, type II cytoskeletal 8 KRT8 110.35 4.02q 0.00 6.49q 0.00
gi|347300243 Glutamate dehydrogenase 1, mitochondrial GLUD1 102.28 1.79 0.18 4.17q 0.00
gi|297591975 ATP synthase subunit alpha, mitochondrial ATP5A1 96.61 1.17 0.67 4.66q 0.00
gi|417515796 Hypoxia up-regulated protein 1 precursor – 92.84 3.91 0.01 6.92q 0.00
gi|349732227 Heterogeneous nuclear ribonucleoprotein M – 89.74 7.66q 0.00 9.64q 0.00
gi|56748897 Heat shock 70 kDa protein 1B HSPA1B 62.37 4.33q 0.21 4.02q 0.12
gi|47522630 Aspartate aminotransferase, mitochondrial precursor GOT2 60.36 1.43 0.01 4.66q 0.00
gi|387912908 Calreticulin CALR 55.58 2.40 0.11 4.61q 0.00
gi|346421378 Serpin H1 precursor – 52.10 3.22 0.00 4.06q 0.00
gi|2506849 Malate dehydrogenase, mitochondrial MDH2 49.19 3.28 0.00 6.98q 0.00
gi|148230268 Galectin-3 LGALS3 48.39 3.08 0.15 5.06q 0.01
gi|417515899 2-oxoglutarate dehydrogenase, mitochondrial – 45.01 2.99 0.02 5.25q 0.00
gi|8745552 Voltage-dependent anion channel 1 VDAC1 43.46 6.19q 0.01 11.59q 0.00
gi|330417958 Phosphoenolpyruvate carboxykinase [GTP], mitochondrial PCK2 42.89 1.96 0.09 5.75q 0.00
gi|353468887 Signal transducer and activator of transcription 1 STAT1 42.79 1.80 0.33 6.98q 0.00
gi|21264506 Succinyl-CoA ligase [GDP-forming] subunit beta, mitochondrial SUCLG2 41.68 1.53 0.00 4.06q 0.00
gi|47716872 Galectin-1 – 41.49 5.20q 0.05 4.66q 0.06
gi|342349346 Lon peptidase 1, mitochondrial – 41.02 2.49 0.03 6.03q 0.00
gi|210050415 Mx2 protein Mx2 40.44 3.08 0.79 18.88q* 0.00
gi|342349319 Calnexin precursor – 37.71 4.79q 0.00 6.14q 0.00
gi|72535198 Histone H1.3-like protein – 36.51 1.69 0.38 8.32q* 0.12
gi|347300207 Nucleobindin-1 precursor NUCB1 35.30 3.40 0.00 5.01q 0.00
gi|347800693 Ferredoxin reductase FDXR 33.41 1.56 0.05 4.57q 0.00
gi|417515788 Prolow-density lipoprotein receptor-related protein 1 precursor – 32.44 1.60 0.13 5.65q 0.00
gi|297747350 FAT tumor suppressor homolog 1 – 32.04 6.08q 0.00 7.24q 0.00
gi|298104076 Enoyl-CoA hydratase, mitochondrial – 30.50 2.21 0.23 6.55q 0.00
gi|7939586 Dihydrolipoamide succinyltransferase DLST 30.42 1.71 0.17 4.06q 0.00
gi|7404364 Hydroxyacyl-coenzyme A dehydrogenase, mitochondrialPrecursor HADH 29.29 1.92 0.00 5.50q 0.00
gi|346644866 Coiled-coil-helix-coiled-coil-helix domain-containing protein 3, mitochondrial
CHCHD3 28.98 2.51 0.01 4.61q 0.00
gi|47522814 Dihydrolipoyllysine-residue acetyltransferase component of pyruvate dehydrogenase complex, mitochondrial precursor
– 28.30 1.98 0.32 4.92q 0.00
Proteome
Profile
of
ST
Cells
Infected
with
TGEV
PLOS
ONE
|
www.ploson
e.org
6
October
2014
|
Volume
9
|
Issue
10
|
Table 1.Cont.
Accession
number Protein name Gene symbol Unused ProtScore Infected/uninfected (48 h) Infected/uninfected (64 h)
Ratio P-value Ratio P-value
gi|6165556 Long-chain 3-ketoacyl-CoA thiolase LCTHIO 26.88 3.98 0.00 7.59q 0.00
gi|156720190 Mx1 protein Mx1 26.26 3.80 0.98 19.41q* 0.00
gi|47522770 Clusterin precursor CLU 25.75 13.80q 0.00 14.59q 0.00
gi|347300323 Thioredoxin-dependent peroxide reductase, mitochondrial PRDX3 24.24 2.72 0.00 6.92q 0.00
gi|47522610 Succinyl-CoA:3-ketoacid coenzyme A transferase 1, mitochondrial precursor
OXCT1 23.94 1.72 0.22 6.37q 0.00
gi|346986361 Electron-transfer-flavoprotein, alpha polypeptide ETFA 22.41 2.42 0.34 5.55q 0.00
gi|172072653 Lactadherin precursor MFGE8 22.33 10.19q 0.00 9.64q 0.00
gi|56417363 Cathepsin D protein – 21.95 0.54 0.0 2.38* 0.02
gi|87047636 ATP synthase H+-transporting mitochondrial F1 complex O subunit
ATP5O 21.83 1.11 0.66 7.66q* 0.00
gi|89573851 Succinate dehydrogenase complex subunit B SDHB 21.18 2.00 0.04 5.97q 0.00
gi|5921142 Amyloid precursor protein APP 20.29 13.43q 0.00 15.14q 0.00
gi|347658971 ATP synthase, H+transporting, mitochondrial Fo complex, subunit d
– 20.26 3.34 0.01 9.82q 0.00
gi|75052621 Transcription factor A, mitochondrial TFAM 19.14 2.01 0.00 5.50q 0.00
gi|312283580 Superoxide dismutase [Mn], mitochondrial – 18.40 1.79 0.18 5.35q 0.00
gi|6093657 Propionyl-CoA carboxylase beta chain, mitochondria PCCB 17.92 2.33 0.13 6.85q 0.00
gi|346716275 DnaJ homolog subfamily B member 11 precursor DNAJB11 17.48 2.63 0.01 4.74q 0.00
gi|118403762 Extracellular superoxide dismutase precursor - 16.78 11.27q 0.01 11.48q 0.01
gi|150251019 Adenylate kinase 3-like 1 AK3L1 15.85 2.05 0.12 4.06q 0.00
gi|158517860 Thymosin beta-10 TMSB10 13.45 6.25q 0.30 7.52q 0.30
gi|47522698 Cathepsin L1 precursor CTSL 12.72 4.45q 0.01 5.11q 0.01
gi|329744622 Low-density lipoprotein receptor precursor LDLR 12.69 3.50 0.04 4.06q 0.01
gi|346644882 Reticulocalbin 2, EF-hand calcium binding domain precursor RCN2 12.05 2.00 0.04 4.09q 0.00
gi|284519712 Caspase-8 – 11.38 7.11q 0.13 16.14q 0.00
gi|211578396 Nitrogen fixation 1-like protein LOC100156145 11.29 3.60 0.02 5.45q 0.00
gi|346644830 Sulfide:quinone oxidoreductase, mitochondrial SQRDL 10.92 1.87 0.38 4.53q 0.02
gi|417515419 Semaphorin-3C precursor – 10.76 4.92q 0.08 3.94 0.24
gi|75064988 Syndecan-4 SDC4 10.29 18.88q 0.00 19.59q 0.00
gi|346716228 Histidine triad nucleotide-binding protein 2, mitochondrial isoform 2 precursor
HINT2 10.06 3.77 0.20 12.71q 0.03
gi|85720739 Beta-enolase 3 ENO3 9.83 15.42q 0.20 8.32q 0.25
gi|223634702 Succinyl-CoA ligase [ADP/GDP-forming] subunit alpha, mitochondrial
SUCLG1 9.76 4.74q 0.00 9.04q 0.00
Proteome
Profile
of
ST
Cells
Infected
with
TGEV
PLOS
ONE
|
www.ploson
e.org
7
October
2014
|
Volume
9
|
Issue
10
|
Table 1.Cont.
Accession
number Protein name Gene symbol Unused ProtScore Infected/uninfected (48 h) Infected/uninfected (64 h)
Ratio P-value Ratio P-value
gi|4579751 130 kDa regulatory subunit of myosin phosphatase, partial – 9.64 8.39q 0.00 3.94 0.27
gi|76781337 ADAMTS1 ADAMTS1 9.61 6.79q 0.00 7.38q 0.00
gi|417515625 Interferon-induced protein with tetratricopeptide repeats 2 – 9.52 1.53 0.68 10.76q* 0.00
gi|47522640 CD97 antigen – 8.47 5.40q 0.01 5.20q 0.02
gi|55247591 Granulin precursor GRN 8.43 12.71q 0.00 14.59q 0.01
gi|8347147 Inflammatory response protein 6 RSAD2 8.22 0.72 0.88 4.06q* 0.00
gi|148234138 Cytochrome c oxidase subunit 6B1 COX6B 8.11 2.65 0.11 4.97q 0.01
gi|343790890 Acyl-CoA dehydrogenase family, member 8 – 8.06 1.56 0.30 5.55q 0.02
gi|9957597 Probable ATP-dependent RNA helicase DDX58 DDX58 7.83 1.22 0.52 8.02q* 0.00
gi|347300255 DAZ-associated protein 1 DAZAP1 7.32 7.52q 0.01 4.29q 0.05
gi|148887343 ATP synthase subunit e, mitochondrial ATP5I 7.00 1.11 0.97 4.21q 0.01
gi|297632426 Signal sequence receptor, alpha – 6.36 4.49q 0.03 5.20q 0.03
gi|6919844 Transforming growth factor-beta-induced protein ig-h3 TGFBI 6.12 4.92q 0.01 3.56 0.20
gi|47523704 Double stranded RNA-dependent protein kinase PKR 6.07 5.65q 0.19 6.67q 0.15
gi|339895859 Lipase, endothelial precursor LIPG 5.14 4.06q 0.04 3.25 0.05
gi|6226834 2’-5’-oligoadenylate synthase 1 OAS1 5.03 1.96 0.09 10.47q* 0.01
gi|21636588 ATP synthase gamma subunit 1 – 4.61 2.78 0.16 4.49q 0.05
gi|56392985 Asparagine-linked glycosylation 2 ALG2 4.31 2.65 0.30 4.57q 0.23
gi|52346216 Fibroleukin precursor FGL2 4.22 3.13 0.11 4.33q 0.07
gi|154147577 Interferon-induced helicase C domain-containing protein 1 MDA5 4.20 2.09 0.78 6.67q 0.06
gi|343098453 Chromatin target of PRMT1 protein CHTOP 4.10 8.47q 0.05 6.79q 0.24
gi|343478189 Tubulin beta-2B chain TUBB2B 4.04 5.25q 0.30 5.40q 0.24
gi|47523638 Nexin-1 precursor PN-1 4.01 5.97q 0.16 8.95q 0.14
gi|346716354 Protein lunapark – 4.00 10.76q 0.17 7.94q 0.23
gi|87047624 C-C motif chemokine 5 CCL5 3.80 5.35q 0.31 18.71q 0.12
gi|75056555 Integral membrane protein 2B ITM2B 3.70 12.82q 0.20 12.94q 0.18
gi|264681460 Acyl carrier protein, mitochondrial NDUFAB1 3.13 2.21 0.25 4.33q 0.09
gi|456752927 Lectin, galactoside-binding, soluble, 3 binding protein – 2.94 1.04 0.13 6.43q* 0.06
gi|116175255 Regulator of differentiation 1 ROD1 2.79 2.68 0.23 4.29q 0.14
gi|164664468 ATP synthase subunit epsilon, mitochondrial ATP5E 2.74 3.66 0.14 14.06q 0.02
gi|47522704 Vascular cell adhesion protein 1 precursor – 2.72 3.56 0.11 6.79q 0.02
gi|417515517 Solute carrier family 2,facilitated glucose transporter member 1 – 2.52 4.06q 0.17 2.83 0.23
gi|346644790 Eukaryotic translation initiation factor 4E-binding protein 1 – 2.15 11.48q 0.05 6.73q 0.17
Proteome
Profile
of
ST
Cells
Infected
with
TGEV
PLOS
ONE
|
www.ploson
e.org
8
October
2014
|
Volume
9
|
Issue
10
|
Table 1.Cont.
Accession
number Protein name Gene symbol Unused ProtScore Infected/uninfected (48 h) Infected/uninfected (64 h)
Ratio P-value Ratio P-value
gi|346644828 Nuclear ubiquitous casein and cyclin-dependent kinases substrate NUCKS1 2.01 5.70q 0.24 3.60 0.37
gi|35208827 Macrophage colony-stimulating factor 1 precursor MCSF alpha 2.01 6.37q 0.24 7.73q 0.21
gi|158726687 IGFBP-6 – 2.00 9.29q 0.11 9.20q 0.11
gi|146345485 Plasminogen PLG 2.00 7.94q 0.12 13.30q 0.10
gi|63809 Transforming growth factor beta-1 TGFB1 2.00 8.32q 0.31 13.43q 0.21
gi|239504564 Claudin-4 CLDN4 1.97 4.92q 0.27 8.63q 0.16
gi|75049861 C-X-C motif chemokine 16 CXCL16 1.96 3.02 0.22 4.92q 0.15
gi|158514029 ATP synthase lipid-binding protein, mitochondrial ATP5G1 1.45 1.38 0.49 5.81q* 0.34
gi|872313 Monocyte chemoattractant protein 1 CCL2 1.32 3.44 0.25 4.79q 0.19
gi|81295909 Mitochondrial aldehyde dehydrogenase 2 ALDH2 34.88 0.72 0.14 3.16* 0.00
gi|224593280 Tyrosine-protein phosphatase non-receptor type 1 PTPN1 12.65 0.33 0.01 1,37* 0.11
gi|83415439 MHC class I antigen PD1 7.05 0.45 0.43 3.13* 0.04
gi|148747492 Keratin, type II cytoskeletal 2 epidermal KRT2A 6.68 0.67 0.98 3.40* 0.10
gi|75054309 N-acetylgalactosamine-6-sulfatase GALNS 6.61 0.34 0.05 1.72* 0.11
gi|343791025 Lysosomal protective protein precursor – 5.84 0.81 0.80 3.25* 0.05
gi|262204920 Peroxisomal trans-2-enoyl-CoA reductase PECR 5.77 0.26 0.13 1.25* 0.32
gi|75063982 Alpha-crystallin B chain CRYAB 4.92 0.37 0.19 3.40* 0.07
gi|456753359 Mevalonate (diphospho) decarboxylase, partial – 4.01 0.26 0.44 1.41* 0.77
gi|343478257 Peptidase M20 domain containing 1 – 3.19 0.31 0.36 1.34* 0.69
gi|90024980 Peroxisomal enoyl coenzyme A hydratase 1 ECH1 17.09 0.79 0.88 3.37* 0.00
Downregulated proteins
gi|346986428 Heat shock 90kD protein 1, beta HSPCB 130.10 0.70 0.52 0.21Q 0.00
gi|48675927 Tropomyosin alpha-3 chain TPM3 91.83 0.53 0.01 0.20Q 0.00
gi|28948618 Chain A, structure of full-length annexin A1 in the presence of calcium
ANXA1 72.35 0.42 0.00 0.06Q* 0.00
gi|6016267 Heat shock protein HSP 90-alpha HSP90AA1 53.06 0.74 0.10 0.19Q* 0.00
gi|47523720 Glucose-6-phosphate isomerase GPI 50.00 0.54 0.00 0.18Q 0.00
gi|57527982 Radixin RDX 44.08 0.53 0.00 0.22Q 0.00
gi|51702768 Peptidyl-prolyl cis-trans isomerase A PPIA 41.51 0.75 0.35 0.24Q 0.00
gi|7650140 Gag-pol precursor – 40.78 0.23Q 0.00 0.82 0.04
gi|262263205 Triosephosphate isomerase 1 TPI1 37.70 0.47 0.02 0.13Q 0.00
gi|1927 Cardiac alpha tropomyosin TPM1 36.76 0.50 0.01 0.08Q* 0.00
gi|75074817 Peroxiredoxin-6 PRDX6 35.65 0.90 0.03 0.16Q* 0.00
gi|94962086 Aldo-keto reductase family 1 member C4 AKR1C4 34.49 0.12Q 0.00 0.37 0.00
Proteome
Profile
of
ST
Cells
Infected
with
TGEV
PLOS
ONE
|
www.ploson
e.org
9
October
2014
|
Volume
9
|
Issue
10
|
Table 1.Cont.
Accession
number Protein name Gene symbol Unused ProtScore Infected/uninfected (48 h) Infected/uninfected (64 h)
Ratio P-value Ratio P-value
gi|473575 Lactate dehydrogenase-B LDHB 24.97 0.63 0.01 0.08Q* 0.00
gi|164414678 Alternative pig liver esterase APLE 23.65 0.19Q 0.06 0.64 0.43
gi|343780946 D-dopachrome decarboxylase DDT 19.05 0.15Q 0.26 0.60* 0.61
gi|347300176 Peroxiredoxin-2 PRDX2 24.03 0.74 0.30 0.24Q 0.01
gi|302372516 Heart fatty acid-binding protein FABP3 23.79 0.60 0.00 0.23Q 0.00
gi|343887360 Proteasome (prosome, macropain) subunit, alpha type – 21.65 0.42 0.00 0.25Q 0.00
gi|47522644 Acylamino-acid-releasing enzyme APEH 20.10 0.38 0.01 0.15Q 0.00
gi|346716148 Importin-5 - 18.84 0.83 0.27 0.22Q 0.00
gi|47523046 Acyl-CoA-binding protein DBI 18.36 0.44 0.05 0.23Q 0.00
gi|47523158 Glutathione S-transferase A2 – 15.78 0.31 0.00 0.09Q 0.00
gi|297591959 Farnesyl pyrophosphate synthase precursor FDPS 15.29 0.67 0.32 0.16Q* 0.00
gi|56384247 Ribosomal protein L7 – 15.34 0.09Q 0.01 0.37 0.05
gi|347300398 Core histone macro-H2A.1 isoform 1 H2AFY 14.24 0.25Q 0.24 1.16* 0.58
gi|417515487 Collectin sub-family member 12 – 14.04 0.19Q 0.00 0.48 0.14
gi|94471896 signal transducer and activator of transcription 3 STAT3 13.42 0.21Q 0.00 0.58 0.14
gi|417515866 KIAA0196 – 12.91 0.39 0.00 0.14Q 0.00
gi|584724 Aminoacylase-1 ACY1 12.26 0.30 0.00 0.13Q 0.00
gi|158514030 60S ribosomal protein L14 RPL14 10.79 0.14Q 0.00 0.79* 0.85
gi|187606917 40S ribosomal protein S26 RPS26 6.00 0.19Q 0.07 0.45 0.15
gi|89257972 Protein phosphatase 1 catalytic subunit beta isoform PPP1CB 5.27 0.11Q 0.25 0.61* 0.52
gi|417515889 FK506-binding protein 15 – 4.06 0.05Q 0.12 0.43* 0.25
gi|48474224 Scavenger receptor class B member 1 SCARB1 2.98 0.24Q 0.08 0.41 0.13
gi|83778524 Beta-tropomyosin TPM2 2.55 0.28 0.21 0.07Q* 0.04
gi|298104074 Protein FAM54A – 2.08 0.46 0.30 0.21Q 0.16
gi|342349308 Calmegin precursor – 2.00 0.16Q 0.14 0.21Q 0.16
gi|1016311 Cytochrome P450 2C33v3, partial – 1.96 0.10Q 0.11 0.41* 0.26
gi|346716298 Heterogeneous nuclear ribonucleoprotein G RBMX 32.46 3.63 0.00 0.86* 0.41
gi|262263201 Squalene epoxidase SQLE 2.02 1.37 0.67 0.34* 0.32
Proteome
Profile
of
ST
Cells
Infected
with
TGEV
PLOS
ONE
|
www.ploson
e.org
10
October
2014
|
Volume
9
|
Issue
10
|
Table 2.Biological process-based GO term enrichment analysis.
GO term Gene symbol or protein name (48 hpi) P-value(48 hpi) Gene symbol or protein name (64 hpi) P-value(64 hpi)
Cell adhesion MFGE8, CYR61, ITGA5, FN1, TGFBI, TGFB1, PN-1, CCL5, APP, PPP1CB, SCARB1
2.57E-3 MFGE8, CYR61, ITGA5, FN1, TGFB1, CALR, APP, TACSTD2, PN-1, Vascular cell adhesion molecule, CCL5
2.57E-3
Response to stress NUDT9, CYR61, ITGA5, FN1, PLG, TGFB1, Extracellular superoxide dismutase precursor, CLU, CCL5, HSPA1B, PN-1, VDAC1
7.98E-1 CCL2, NUDT9, CYR61, ITGA5, FN1, LOC100516779, Mitochondrial heat shock 60 kDa protein 1, CCDC47, PLG, TGFB1, CALR, Extracellular superoxide dismutase precursor, OAS1, HSPA1B, PN-1, DDX58, VDAC1, RSAD2, HSP90AA1, HSPCB, DBI, PRDX2, PRDX3, CLU, CCL5, CXCL16, PRDX6
8.18E-4
Generation of precursor metabolites and energy
ENO3, SUCLG1, PPP1CB 6.51E-1 ENO3, TPI1, IDH3A, SUCLG1, LDHB, MDH2, GPI, SUCLG2, SDHB, DLST
2.74E-3
Extracellular matrix organization CYR61, TGFB1, APP 1.22E-2 LGALS3, CYR61, TGFB1, APP 1.51E-3
Locomotion TGFB1, APP, CCL5 1.22E-2 TGFB1, APP, CCL5, CXCL16 1.51E-3
Cell motility STAT3, CYR61, ITGA5, TUBB2B, TGFB1, CCL5 2.07E-1 CCL2, TACSTD2, CYR61, ITGA5, TUBB2B, TGFB1, CALR, CCL5, CXCL16, DDX58
6.71E-3
Cell-cell signaling ITPR3, APP, PN-1, VDAC1, CCL5 2.58E-2 GLUD1, APP, PN-1, VDAC1, CCL5 2.58E-2
Neurological system process ITPR3, ITGA5, APP, VDAC1, PN-1 7.91E-3 ITGA5, APP, PN-1, VDAC1 3.34E-2
Protein complex assembly H2AFY, SLAIN2, HIST1H2BF, TUBB2B, HIST1H2BJ, TMSB10, TGFB1, CLU, CCL5
2.66E-1 SLAIN2,HIST1H2BF,TUBB2B,HIST1H2BJ, TGFB1, TMSB10, RDX, CALR,CLU, CCL5, Histone H1.3-like protein, TFAM
4.69E-2
Cell junction organization ITGA5, FN1, TGFB1 1.22E-2 ITGA5, FN1, TGFB1 1.22E-2
Growth STAT3, CYR61, TGFB1, APP, PN-1 1.01E-1 COL9A1, CYR61, TGFB1, PN-1, APP, CXCL16 3.87E-2
Developmental maturation APP 1.13E-1 ARCN1, APP 1.53E-2
Immune system process TGFB1, CCL5 9.81E-1 CCL2, HSPCB, PRDX3, LOC100516779, TGFB1, CALR, OAS1, CCL5, CXCL16, DDX58, RSAD2
4.67E-2
Note: P-values were calculated in the hypergeometric test. Gene symbols were retrieved from UniProt. The significantly common processes affected are highlighted in bold. doi:10.1371/journal.pone.0110647.t002
Proteome
Profile
of
ST
Cells
Infected
with
TGEV
PLOS
ONE
|
www.ploson
e.org
11
October
2014
|
Volume
9
|
Issue
10
|
space (p = 1.52E-2) (Table S4). In addition, 37 differentially expressed proteins were also significantly enriched (p = 8.65E-3) in mitochondrion at 64 hpi (Table S5).
The final step of our GO enrichment analysis consisted of investigating the mechanistic role these genes play in the cell. To do so, we performed a molecular function-based enrichment analysis. This analysis showed that two GO terms, unfolded protein binding (p = 2.67E-2) and transmembrane transporter activity (p = 3.55E-2), were significantly enriched at 64 hpi (Table S5). Further GO analysis of the differentially expressed proteins between the two time points indicated that there were no significant enriched terms.
Protein–protein interaction analysis
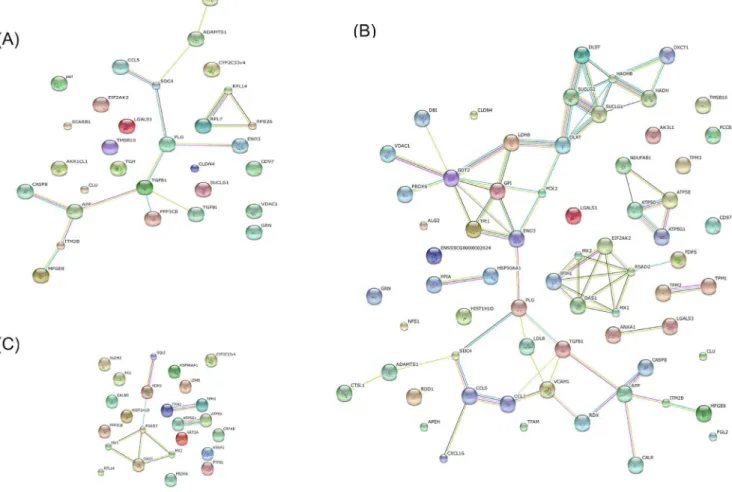
In order to understand the interactions between TGEV and host cell proteins, we further analyzed the differentially expressed proteins by searching the STRING 9.1 database (http://string-db. org/) for protein-protein interactions (Figure 4). In this STRING analysis, the interactions (edges) of the submitted proteins (nodes) were scored according to known and predicted protein-protein interactions. We created three protein network maps: one for proteins changed significantly at 48 hpi (30 nodes and 15 edges; Figure 4A), one for proteins changed significantly at 64 hpi (66
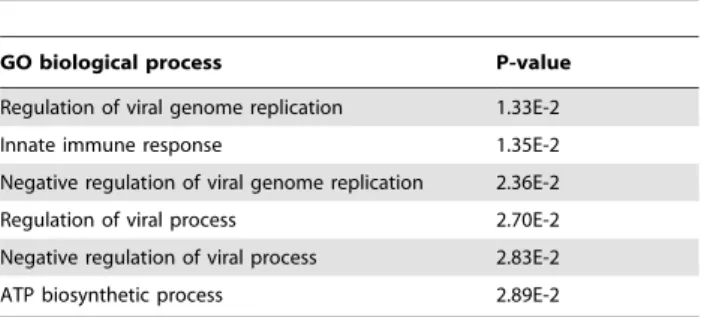
nodes and 70 edges; Figure 4B), and one for the proteins that were significantly changed when the viral infection was prolonged from 48 to 64 h (24 nodes and 9 edges; Figure 4C). Notably, the protein network constructed for the 64 hpi time point is clearly much more extensive than the two other networks, and these protein-protein interactions suggest the existence of reported functional linkages. GO enrichment analysis for the STRING protein network at 64 hpi showed that several biological processes were significantly affected (p,0.05 based on the FDR correction) in this network, including the regulation of viral genome replication, the innate immune response, negative regulation of viral genome replication, positive and negative regulation of viral processes, and ATP biosynthetic processes (Table 3). However, at 48 hpi, the most enriched biological process was related to cell recognition during phagocytosis(p = 8.02E-1). In Figure 4C, we have shown that the majority proteins in these protein networks, such as radical S-adenosyl methionine domain containing protein 2 (RSAD2), Mx dynamin-like GTPase 1 (Mx1), 29-59-oligoadenylate synthetase 1 (OAS1), Mx dynamin-like GTPase 2 (Mx2), are involved in the innate immune response. These data suggest that some entirely different host proteins, interactions, or processes, including the immune response, were perturbed at these times during TGEV infection.
Figure 4. Protein-protein interaction network created using the STRING database.(A) Network of the differentially expressed proteins at 48 hpi. The network includes 30 nodes (proteins) and 15 edges (interactions). (B) Network of differentially expressed proteins at 64 hpi. The network includes 66 nodes and 70 edges. (C) Network of differentially expressed proteins between the two time points. The network includes 24 nodes and 9 edges. Network analysis was set at medium confidence (STRING score = 0.4). Seven different colored lines were used to represent the types of evidence for the association: green, neighborhood evidence; red, gene fusion; blue, co-occurrence; black, co-expression; purple, experimental; light blue, database; yellow, text mining.
doi:10.1371/journal.pone.0110647.g004
Proteome Profile of ST Cells Infected with TGEV
Western blot confirmation of altered expression for three of the differentially expressed proteins
To further confirm the proteomic data for three of the proteins, western blot analysis was performed to investigate the changes in the expression of HSP90a, caspase 8, and TGF-b1. The proteins were selected based on three criteria: 1) the expression of the protein was increased or decreased during TGEV infection according to our proteomics data; 2) the protein is known to be relevant during viral infection; and 3) each protein analyzed needs to be involved in a special biological process as determined by our GO enrichment analysis [32]. HSP90a, caspase 8, and TGF-b1 all filled these criteria and their protein expression was analyzed via western blot analysis of the cell lysate. As shown in Figure 5, the expression of HSP90awas significantly downregulated in TGEV-infected cells at 64 hpi, while the expression of caspase-8 was upregulated from 48 to 64 hpi in these cells. The expression of TGF-b1 was also significantly induced in TGEV-infected cells following infection. Thus, these results confirm the altered expression observed in the proteomic data for these three representative proteins during TGEV infection.
Discussion
The interactions between a virus and a host cell during a viral infection are complex, involving numerous genes and signaling pathways. ST cells are known to be sensitive to TGEV, resulting in
increased viral multiplication and CPEs [15]. In order to better understand the interactions between the host proteome and TGEV, we adopted an iTRAQ quantitative proteomic approach to investigate the altered cellular proteins of the ST cells during TGEV infection in vitro. Compared with the 2-DE and 2D-DIGE methods often used, the 2D-LC-MS/MS method utilized here provides more quantitative and qualitative information about the proteins, and can also detect membrane proteins, hydrophobic proteins, higher molecular weight proteins, and low-abundance proteins, which are often missed by other methods. iTRAQ also has more advantages compared to isotope-coded affinity tags (ICAT) and stable isotope labeling by amino acids in cell culture (SILAC) methods, which both allow multiple labeling and quantitation of four to eight samples simultaneously with high sensitivity [22,33,34]. Further, the iTRAQ technique has been widely used for quantitative proteomics, including protein expression analysis and biomarker identification [23–26,35].
Prior to proteomic analysis, we determined which time points to investigate following infection by observing the morphological changes and analyzing viral gene expression dynamics in the TGEV infected cells. The results indicated that TGEV induced significant CPEs from 40 to 64 hpi in infected cells compared to the mock infected cells. At 40 hpi, less than 50% of the infected cells were morphologically altered, while at 48 hpi more than 80% infected cells showed rounding and granular degeneration. Further, the mRNA level of the viral N gene in ST cells continuously increased in the infected cells until 48 h, at which time we observed the highest viral replication level. At 64 hpi, the morphological effects observed were much more pronounced, characterized by even more cellular rounding and detachment. However, the mRNA levels of the viral N gene decreased rapidly from 48 to 64 h, a phenomenon we believe may be attributed to the host’s immune response or a decrease in infected cell viability as the TGEV infection progressed. Based on our qRT-PCR and CPE analyses, we choose to more deeply investigate the proteomic changes occurring in the TGEV-infected ST cells at 48 hpi and 64 hpi using a 4-plex iTRAQ analysis.
In our analysis, we observed a statistically significant change in the expression of 316 proteins during TGEV infection in vitro. This number includes protein changes that were unique for a specific time point as well as those shared at these different time conditions. For example, the expression level of HSP90a
expression was unchanged at 48 hpi, but decreased at 64 hpi, Table 3.List of the GO biological processes enriched for the
proteins present in the STRING protein network.
GO biological process P-value
Regulation of viral genome replication 1.33E-2
Innate immune response 1.35E-2
Negative regulation of viral genome replication 2.36E-2
Regulation of viral process 2.70E-2
Negative regulation of viral process 2.83E-2
ATP biosynthetic process 2.89E-2
Note: The significance of the GO biological process is derived from the network in Figure 4B and was determined using the FDR correction (p,0.05). doi:10.1371/journal.pone.0110647.t003
Figure 5. Western blot confirmation for three differentially expressed proteins (caspase-8, HSP90a, and TGF-b1).Following TGEV and mock infection of the ST cells, equal amounts of protein were separated by SDS-PAGE and transferred to PVDF membranes. The membranes were then probed with the specified antibody, and the identified bands were visualized. GAPDH was used as an internal control to normalize the quantitative data. The representative images shown are typical of two independent experiments. At 48 hpi (I48), integrated optical density (IOD)
analysis showed an upregulation of caspase-8 (1.27 fold) and TGF-b1 (3.08 fold), but HSP90awas almost unchanged (0.90 fold). At 64 hpi (I64), we
observed an upregulation in both caspase-8 (3.11 fold) and TGF-b1 (4.58 fold), but a 5.82 fold downregulation of HSP90a. The IOD was normalized against GAPDH.
doi:10.1371/journal.pone.0110647.g005
Proteome Profile of ST Cells Infected with TGEV
making this change unique for the latter time point. On the other hand, TGF-b1 was observed to increase at both of the time points, and was thus labeled a shared protein change. Moreover, the 316 altered proteins also includes proteins that changed from 48 hpi to 64 hpi, rather than one of these time points compared to non-infected cells. For example, mitochondrial aldehyde dehydroge-nase 2 (ALDH2) and MHC class I antigen (PD1) were not changed at 48 or 64 hpi compared to the control group, but increased at 64 hpi compared with 48 hpi. We also observed a larger proteomic shift at 64 hpi compared to the 48 hpi time point in the infected ST cells.
Further, some proteins previously reported to play a role in virus-induced host cell death, such as caspase-8, caspase-3, caspase-9, and porcine aminopeptidase-N (pAPN) [36–38], were also identified using this iTRAQ technique. These caspase proteins are known to be involved in TGEV-induced cell apoptosis processes, while pAPN is the cell receptor for TGEV. Our results indicate that TGEV infection caused significant upregulation of caspase-8 expression at two time points (approximately 7-fold at 48 hpi and 16-fold at 64 hpi) in the virus-infected ST cells, and this change was verified by western blotting analysis. However, the expression of caspase-3, caspase-9, and pAPN was not significantly altered, indicating that the pathways involving these genes are not altered or that other proteins are compensating for their lack of change. In this regard, we identified an additional 15 proteins involved in cell death pathways that had significantly altered expression levels (p = 4.46E-2) (Table S6), including melanoma differentiation associated protein-5 (MDA5), monocyte chemoat-tractant protein 1 (CCL2), thioredoxin- dependent peroxide reductase, mitochondrial (PRDX3), peroxiredoxin-2 (PRDX2), predicted protein CYR61 (CYR61), keratin, type II cytoskeletal 8 (KRT8), predicted bcl-2-like protein 13 (BCL2L13), predicted integrin alpha-5 isoform 1 (ITGA5), TGF-b1, amyloid beta A4 protein (APP), clusterin (CLU), C–C motif chemokine 5 (CCL5), heat shock 70 kDa protein 1B (HSPA1B), alpha-crystallin B chain (CRYAB), voltage-dependent anion-selective channel protein 1 (VDAC1), all of which, with the exception of PRDX2 and BCL2L13 were upregulated at one or two time points. Regulation of cell death is known to be important for replication and pathogenesis in various coronaviruses [39], and we believe that further research on these proteins will lead to a better understanding of cell death regulation during TGEV infection.
In order to determine what other processes, in addition to cell death, were affected by TGEV infection, we performed a GO enrichment analysis for the different temporal conditions. This analysis indicated that six biological processes were significantly affected at 48 and 64 hpi, and the differentially expressed proteins involved in these processes were almost the same. The large overlap between the two time points suggests that some of the same sets of host proteins or processes were disturbed at these times. However, it is also likely that some processes were affected solely at one time point or the other. At 48 hpi, serine/threonine-protein phosphatase PP1-beta-catalytic subunit (PPP1CB), scav-enger receptor class B member 1 (SCARB1), transforming growth factor-beta-induced protein ig-h3 (TGFBI), and predicted inositol 1,4,5-trisphosphate receptor type 3 (ITPR3) were uniquely altered, likely indicating changes in cell adhesion and/or cell-cell signaling processes. At 64 hpi, on the other hand, calreticulin (CALR), predicted tumor- associated calcium signal transducer 2-like (TACSTD2), vascular cell adhesion molecule, galectin-3 (LGALS3), glutamate dehydrogenase 1 (GLUD1), and C–X-C motif chemokine 16 (CXCL16) were uniquely changed, also indicating changes in cell adhesion and/or cell-cell signaling as well as extracellular matrix organization and locomotion. We
believe that these uniquely altered proteins reflect changes in specific/specialized processes at each time point that are tightly linked to the temporal changes observed in the host cell morphology and gene/protein expression after TGEV infection.
The most significantly enriched GO category related to the differentially expressed proteins was stress, which included 12 differentially expressed proteins at 48 hpi and 27 different proteins at 64 hpi. The increased number of proteins association with this GO term at 48 hpi likely highlights the initial upregulation of the cellular stress response, while the higher number at 64 hpi indicates that the stress response to TGEV infection is likely more fully induced at this later stage. HSPs, also known as stress proteins, are often involved in the cellular response to stress, influencing changes in the state or activity of the cell or organism. HSP90, which has two isoforms (HSP90aand HSP90b), is one of the most abundant molecular chaperones that is induced in response to cellular stress, and it functions to stabilize proteins involved in cell growth and anti-apoptotic signaling [40]. The expression of HSP90ahas been reported to play an important role in the replication of some viruses, such as Ebola virus (EBOV) [41], hepatitis C virus (HCV) [42], influenza virus [43], and Japanese encephalitis virus [44]. On the other hand, the reduction of HSP90bhas been reported to decrease the correct assembly of human enterovirus 71 viral particles [40]. In this study, HSP90a
and heat shock 90kD protein 1, beta (HSPCB/HSP90b) were significantly downregulated at 64 hpi in the TGEV-infected ST cells, but were unchanged at 48 hpi, indicating that they may play a similar role in TGEV infection. Interestingly, a member of the HSP70 protein family, heat shock 70 kDa protein 1B (HSPA1B), as well as mitochondrial 60 kDa heat shock protein (HSP60) were both upregulated in infected ST cells at 48 and/or 64 hpi. HSP60 is a mitochondrial chaperonin protein involved in protein folding and a number of extracellular immunomodulatory activities. Elevated expression of HSP60 is associated with a number of inflammatory disorders [45]. HSP70 plays an important role in multiple processes within cells, including protein translation, folding, intracellular trafficking, and degradation. A previous study has revealed that HSP70 is involved in all steps of the viral life cycle, including replication, and is highly specific in regards to viral response, differing from one cell to another for any given virus type [46]. For example, silencing HSP70 expression has been associated with an increase in viral protein levels, while an increase in HSP70 has been suspected to be the initial cellular response to protect against viral infection in rotavirus-infected cells [47]. Further, a recent study showed that HSP70 is an essential host factor for the replication of PRRSV as the silence of HSP70 significantly reduced PRRSV replication [48]. Our results provide new experimental evidence relating the expression of HSP90, HSP70, and HSP60 to TGEV infection, and we speculate that these proteins play a potential role in TGEV replication. Additional work is required to investigate the detailed role of these proteins during TGEV infection.
Furthermore, another significantly enriched GO process we observed that 11 significantly altered proteins was immune system processes. Most of these proteins were significantly upregulated at 64 hpi in response to the viral infection, while some were first upregulated at 48 hpi, including CCL5 and TGF-b1. Chemo-kines, such as CCL2, CCL5, and CXCL16, whose main function is macrophage recruitment and activation, are potentially involved in host-mediated immunopathology. A recent study showed that coronavirus infection of transgenic mice expressing CCL2 led to a dysregulated immune response without effective virus clearance and enhanced death [49]. In additional, TGEV-infection can induce the expression of proinflammatory genes, including CCL2,
Proteome Profile of ST Cells Infected with TGEV
CCL5, and probable ATP-dependent RNA helicase DDX58 (DDX58/RIG-1), in cell culture and in vivo in the absence of viral protein 7 [50]. In this study, we observed an upregulation of CCL2, CCL5, CXCL16, TGF-b1, and DDX58 expression.
TGF-b1 is a multifunctional cytokine, secreted from various cells, and, in immunology, it regulates cellular proliferation, differentiation, and other cellular functions for a variety of cell types, especially regulatory T cells [51]. Some research has indicated thatS ARS-CoV papain-like protease (PLpro) increases TGF-b1 mRNA expression and protein production in human promonocytes [52]. Further, Gomez-Laguna et al. [53] inferred that the upregulation of the TGF-b may impair the host immune response during PRRSV infection by limiting the overproduction of proinflamma-tory cytokines necessary to decrease PRRSV replication. In response to viral infection, DDX58 plays important roles in the recognition of RNA viruses in various cells, and has been identified as a candidate for a cytoplasmic viral dsRNA receptor [54]. Further, upregulation of this gene activates cells to produce type I interferons, which may increase the antiviral status of cells to protect against viral infection. In this regard, we found that interferon-inducible antiviral proteins, RSAD2, OAS1, were also upregulated in the period of late infection, suggesting that many of the proteins identified in this study are associated with inflamma-tion, IFN activainflamma-tion, and the innate immune response. Increased expression of these proteins may help the virus enter the cell as well as potentially enhance TGEV replication or the host response against the virus, during the late stages of infection.
In conclusion, we used the iTRAQ method to identify 316 significantly altered proteins in TGEV-infected ST cells. A larger number of protein expression changes occurred at 64 hpi compared to 48 hpi, indicating a larger shift in the proteome in the later stages of infection. GO analysis of these differentially expressed proteins indicated that a number of diverse biological processes are affected. In addition, many of the significant immune response related changes in protein expression we discovered are novel and, to our knowledge, have not been detected in previous proteome study. Results from this study complement the previous proteomics data obtained concerning the host response to a viral
infection, and further facilitates a better understanding of the pathogenic mechanisms of TGEV infection and molecular responses of host cells to this virus.
Supporting Information
Table S1 Total proteins (4,364) identified and quanti-fied by iTRAQ.
(XLSX)
Table S2 List of the 4,112 reliably quantified proteins selected from Table S1.
(XLSX)
Table S3 Differentially expressed proteins identified under different conditions.
(XLSX)
Table S4 GO enrichment analysis of differentially expressed proteins identified at 48 hpi.
(XLSX)
Table S5 GO enrichment analysis of differentially expressed proteins identified at 64 hpi.
(XLSX)
Table S6 GO enrichment of all the differentially expressed proteins.
(XLSX)
Acknowledgments
We thank Qiangqiang Zhao, Chen Lou, Wulong Liang, and Helin Li for their technical support, and Shuo Chen for his valuable advice.
Author Contributions
Conceived and designed the experiments: RM YZ. Performed the experiments: RM. Analyzed the data: RM HL. Contributed reagents/ materials/analysis tools: PN YZ. Contributed to the writing of the manuscript: RM. Drafted the work or revised it critically: RM YZ HL PN.
References
1. Jones T, Pritchard G, Paton D (1997) Transmissible gastroenteritis of pigs. Vet Rec 141: 427–428.
2. Wesley RD, Lager KM (2003) Increased litter survival rates, reduced clinical illness and better lactogenic immunity against TGEV in gilts that were primed as neonates with porcine respiratory coronavirus (PRCV). Vet Microbiol 95: 175– 186.
3. Kim L, Hayes J, Lewis P, Parwani AV, Chang KO, et al. (2000) Molecular characterization and pathogenesis of transmissible gastroenteritis coronavirus (TGEV) and porcine respiratory coronavirus (PRCV) field isolates co-circulating in a swine herd. Arch Virol 145: 1133–1147.
4. Vlasova AN, Halpin R, Wang S, Ghedin E, Spiro DJ, et al. (2011) Molecular characterization of a new species in the genus Alphacoronavirus associated with mink epizootic catarrhal gastroenteritis. J Gen Virol 92: 1369–1379. 5. Spaan W, Cavanagh D, Horzinek MC (1988) Coronaviruses: structure and
genome expression. J Gen Virol 69: 2939–2952.
6. Neuman BW, Kiss G, Kunding AH, Bhella D, Baksh MF, et al. (2011) A structural analysis of M protein in coronavirus assembly and morphology. J Struct Biol 174: 11–22.
7. Baudoux P, Carrat C, Besnardeau L, Charley B, Laude H (1998) Coronavirus pseudoparticles formed with recombinant M and E proteins induce alpha interferon synthesis by leukocytes. J Virol 72: 8636–8643.
8. Curtis KM, Yount B, Baric RS (2002) Heterologous gene expression from transmissible gastroenteritis virus replicon particles. J Virol 76: 1422–1434. 9. Weingartl HM, Derbyshire JB (1993) Binding of porcine transmissible
gastroenteritis virus by enterocytes from newborn and weaned piglets. Vet Microbiol 35: 23–32.
10. Weingartl HM, Derbyshire JB (1994) Evidence for a putative second receptor for porcine transmissible gastroenteritis virus on the villous enterocytes of newborn pigs. J Virol 68: 7253–7259.
11. Sirinarumitr T, Paul PS, Kluge JP, Halbur PG (1996) In situ hybridization technique for the detection of swine enteric and respiratory coronaviruses,
transmissible gastroenteritis virus (TGEV) and porcine respiratory coronavirus (PRCV), in formalin-fixed paraffin-embedded tissues. J Virol Methods 56: 149– 160.
12. Gala´n C, Sola I, Nogales A, Thomas B, Akoulitchev A, et al. (2009) Host cell proteins interacting with the 39end of TGEV coronavirus genome influence virus replication. Virology 391: 304–314.
13. Penzes Z, Gonzalez JM, Calvo E, Izeta A, Smerdou C, et al. (2001) Complete genome sequence of transmissible gastroenteritis coronavirus PUR46-MAD clone and evolution of the purdue virus cluster. Virus Genes 23: 105–118. 14. Ortego J, Sola I, Almaza´n F, Ceriani JE, Riquelme C, et al. (2003) Transmissible
gastroenteritis coronavirus gene 7 is not essential but influences in vivo virus replication and virulence. Virology 308: 13–22.
15. He L, Zhang YM, Dong LJ, Cheng M, Wang J, et al. (2012) In vitro inhibition of transmissible gastroenteritis coronavirus replication in swine testicular cells by short hairpin RNAs targeting the ORF 7 gene. Virol J 9: 176–184. 16. Sun J, Jiang Y, Shi Z, Yan Y, Guo H, et al. (2008) Proteomic alteration of PK-15
cells after infection by classical swine fever virus. J Proteome Res 7: 5263–5269. 17. Zhang X, Zhou J, Wu Y, Zheng X, Ma G, et al. (2009) Differential proteome analysis of host cells infected with porcine circovirus type 2. J Proteome Res 8: 5111–5119.
18. Yang Y, An T, Gong D, Li D, Peng J, et al. (2012) Identification of porcine serum proteins modified in response to HP-PRRSV HuN4 infection by two-dimensional differential gel electrophoresis. Vet Microbiol 158: 237–246. 19. Cao Z, Han Z, Shao Y, Liu X, Sun J, et al. (2012) Proteomics analysis of
differentially expressed proteins in chicken trachea and kidney after infection with the highly virulent and attenuated coronavirus infectious bronchitis virus in vivo. Proteome Sci 10: 24.
20. Jiang XS, Tang LY, Dai J, Zhou H, Li SJ, et al. (2005) Quantitative analysis of severe acute respiratory syndrome (SARS)-associated coronavirus-infected cells using proteomic approaches implications for cellular responses to virus infection. Mol Cell Proteomics 4: 902–913.
Proteome Profile of ST Cells Infected with TGEV