A Work Project, presented as part of the requirements for the Award of a Master’s Degree in
Economics from the NOVA – School of Business and Economics.
SHAME ON YOU
THE STIGMA OF SOCIAL WELFARE BENEFITS
MÓNICA BARREIROS
#3095
A Project carried out under the supervision of: Professor Susana Peralta
2
Shame on you
The Stigma of Social Welfare Benefits
1
*
Mónica Barreiros
Abstract
We examine the drivers of stigma of social protection benefits in Portugal by exploring how individual socio-economic characteristics relate to levels of personal stigma (thinking that social benefits are for people that are different than me) and to levels of stigmatization (believing that the society thinks less of individuals that receive social benefits). We conducted a survey on stigma perceptions targeting residents of the Metropolitan Area of Lisbon. We find that age, being employed, and being a political conservative tend to increase the likelihood of reporting personal stigma. On the other hand, having completed a college degree is expected to decrease the odds of reporting personal stigma. On the stigmatization side, evidence suggests that reporting personal stigma increases the likelihood of declaring stigmatization. These results unveil the influence of sociological context on stigma-related opinions.
Keywords:
Assistance, Entitlements, Means Testing, Safety Net, Social Welfare
Program, Welfare Provision.
JEL Classification Number:
I38
*I would like to express my immense gratitude to my advisor, Prof. Susana Peralta, for being an exceptional
3
1.
Introduction
In 2015 social protection benefits in Portugal accounted for 24.8 per cent of GDP, which corresponds to an equivalent annual expense of 4290 euros per individual.2 While some
advocate that this alleviates poverty and enhances equality of opportunities, others defend that social benefits spur laziness and idleness. This debate is usually resurrected in times of electoral campaigns, and has been frequently used as a social label across population
subgroups.
Benefit stigma has been a research subject across the full spectrum of social sciences;
however, we believe that the existing literature does not fully account the dimension of stigma of social benefits in Portugal. We aim to contribute to the extension of knowledge on this topic by exploring how individual socio-economic characteristics relate to levels of personal
stigma (thinking that social benefits are for people that are different than me) and to levels of stigmatization (believing that the society thinks less of individuals that receive social
benefits).
We conducted an extensive survey on the different measures of stigma, and we pursued two
different strategies. First, we divided responses into “high” and “low” stigma and ran probit regressions on the outcomes of interest. As robustness checks, we applied ordered probits, where we take full account of the several degrees of stigma reported by respondents. We also
employed alternative proxies of political orientation to check the magnitude of political views on stigma measures.
The paper is structured as follows. Section 2 provides a literature review on the stigma of
social benefits and the Portuguese social security system. Section 3 describes the survey
4
design and data collection, and section 4 reports the central econometric results. Section 5 culminates with a brief synthesis of the main conclusions.
2.
Literature Review
2.1. The take-up of social benefits
For this paper, take-up rates of social benefits are defined as the proportion of individuals or households that are receiving a public-provided social protection benefit among all those that
are eligible for it. An illustrative example of a take-up rate under one hundred per cent dates from 1970 in the US where only 69 percent of eligible families for Aid to Families with
Dependent Children seized the social benefit (Michel, 1980). Additional research highlights that 30 to 60 percent of eligible American households do not participate in means-tested government programs (Blank and Ruggles, 1996; Moffitt, 1983).
One may argue that low take-up of welfare benefits is not a relevant policy issue, as it testifies that some eligible households do not need welfare assistance. However, some authors have
pointed out that low-take up of social benefits are a matter of policy concern as it compromises social well-being and economic efficiency. First, if a social protection policy
fails to reach its target, it may compromise short- and long-run efficiency of welfare policies, such as poverty reduction or vertical mobility (Hernanz, Malherbet, Pellizzari, 2004). This matter is of peculiar concern given that persistent poverty rates were around 20 percent in
EU-26 in the 2008-2012 period (Vaalavuo, 2015), and 67,7 percent in Portugal from 1994 until 2001 (Ferreira, 2008). Secondly, the existence of non-negligible information and transaction
costs – i.e. asymmetry of information about eligibility requirements or time-burdening administrative rules - may spawn inequalities of access to welfare benefits (Hernanz et al., 2004). In short, low take-up rates of social protection benefits may pose efficiency and equity
5
Regarding supply-side ingredients for low take-up of welfare benefits, the possibility of applicants’ refusal due to governmental financial constraints, is pointed in the literature as the main formal supply-driven constraint to welfare take-up. However, eligibility and access
rights are usually mandated by the law in democratic societies, and hence governmental resources do not need to be included in the interpretation of take-up rates (Hernanz et al.,
2004).
In respect of demand-driven determinants of take-up, those can be sorted into four major categories, albeit not mutually exclusive. First, pecuniary determinants, which comprise total
amount and expected duration of benefits, were found to have a positive influence on program participation (Ashenfelter, 1983). Secondly, information costs are pinpointed as determinants
of take-up rates of welfare programs, and are frequently proxied by the distance between the welfare office and the address of the recipient. On the line of this, Warlick (1982) showed empirically that residents in small cities are less likely to receive social benefits, ceteris
paribus, and this has been perceived as evidence that costs of applying are positively
correlated with the distance between claimant’s address and social security facilities
(Hernanz, et al., 2004). Thirdly, uncertainty about application’s outcome and costs by cause of administrative process, such as delays and data gathering, are identified as take-up inhibitors (Storer and Van Audenrode, 1995). Halpern and Hausman (1986) estimated that,
under uncertainty, eligible households are less likely to apply to social assistance programs when they perceive the probability of successful application to be low. Lastly, social stigma,
the concept framed by Moffit (1983) as a ‘disutility arising from participation in a welfare
program per se’ has been acknowledged in the literature as a potential source of low levels of take-up. The same author noticed that recipients of social benefits frequently reported feelings
6
beneficiaries of social benefits (Crocker, Major, and Steele, 1998). Furthermore, low levels of
take-up of social assistance benefits by pensioners in Germany were found to be linked to the idea that welfare assistance is demeaning (Engels and Sellin, 2000).
2.2. The stigma of social benefits
Goffman (1963) formalized stigma as ‘an attribute which is deeply discrediting’ in a given
society. For this paper, stigma will be analysed on two components – personal stigma and stigmatization -, a conceptual framework empirically applied in recent literature on the topic
of social benefits (Baumberg, 2016). In this context, personal stigma can be described as the
individual’s own perception that being a recipient of welfare benefits implies a depreciation
of identity; stigmatization is the thought that society will devalue one’s identity because she
or he is receiving social assistance. As Baumberg (2016) points out, these two dimensions of
stigma are not mutually exclusive.
Although some authors advocate that stigma is non-binding in take up decisions (Spicker, 1984), others acknowledge that stigma implies an under-reporting behaviour as ‘the admission of stigma is itself stigmatising’ (Taylor-Gooby, 1976). According to Larsen (2008), 19 per cent of Danish and 34 per cent of Finnish long-term unemployed individual revealed
having perceived that ‘people looked down a little’ on them due to their recipient status.
Likewise, there seems to exist a cultural negative perception about means-tested benefit recipients in the US (Hochschild, 1996; Klugel and Smith, 1986).
The dominant explanation for the association of stigma and welfare claiming relates to social norms of reciprocity (Schlesinger and Stuber, 2006; Spicker, 1984; Pinker, 1979). Reciprocity
7
failure of gift repayment, and hence claiming social benefits evokes stigma (Baumberg, 2016). Moreover, the allocation of presents tends to be shaped by social rankings (Schwartz, 1967), and thus social transfers may shed light on social gaps across the social ladder. The
social devaluation resulting from failure to reciprocate welfare assistance constitutes an
illustration of Douglas and Isherwood’s (1979) pernicious reciprocity rule – the idea that those at the bottom of the social hierarchy are socially excluded as they are not able to repay social transfers.
Despite the above-mentioned, receiving social benefits does not mandate the existence of
stigma; indeed, the literature points to need and deservingness as exemption rationales. First, needy welfare recipients with no alternative sources of financial support, and whose situation
is not perceived as self-administered tend to be shielded from unfavourable judgements (Cook and Barret, 1992). Secondly, previous evidence reports the frequent fact that claimants deem themselves as worthy of social transfers while formulating that stigma pertains to alternative
undeserving recipients (Chase and Walker, 2013).
2.3. The Portuguese social security system
Portugal introduced its public social protection system in 1984, through the adoption of the social security framework law – Law no. 28/84, August 14th. This law warranted mechanisms for financial support in case of death, unemployment, inability to work, family-related
expenses, and poor living conditions.
The Portuguese social security system has been reformed since its inception, and currently
8
benefits, social pensions, and the guaranteed minimum income, among others.3 Secondly, the welfare system is an occupation-based social insurance scheme that is financed via labour market taxes, and grants social protection in cases of involuntary nonparticipation in the
labour market, such as inability to work, maternity and paternity leaves, and unemployment.4 At last, the complementary system comprises the public capitalization fund and
private-market financial initiatives, such as retirement savings plans, life insurances policies, and mutual funds.5 This last system is optional, earnings-related and aims to provide capital increases for beneficiaries.
Under the Article 2 of the Regulation (EC) No 458/2007 of 25/04/2007 on the European system of integrated social protection statistics (Eurostat, 2017), social protection benefits are
defined as ‘transfers, in cash or in kind, by social protection schemes to households and
individuals to relieve them of the burden of one or more of the defined risks or needs’.
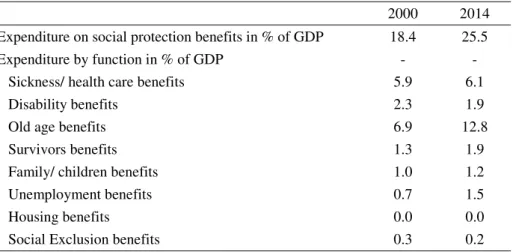
TABLE 1. Social protection expenditure in Portugal.
2000 2014 Expenditure on social protection benefits in % of GDP 18.4 25.5 Expenditure by function in % of GDP - - Sickness/ health care benefits 5.9 6.1 Disability benefits 2.3 1.9 Old age benefits 6.9 12.8 Survivors benefits 1.3 1.9 Family/ children benefits 1.0 1.2 Unemployment benefits 0.7 1.5 Housing benefits 0.0 0.0 Social Exclusion benefits 0.3 0.2
Source: Eurostat, Social Protection Database, 2017
Social protection benefits can be broken down between means-tested and non means-tested,
the former arising when eligibility is conditional on the level of income or wealth (European System of Integrated Social Protection Statistics, 2012). Table 2 provides information on the
relative size of means-tested benefits in 2014 for Portugal and EU-28.
3 The citizenship social protection system refers to Sistema de Proteção Social de Cidadania in Portuguese.
4The welfare system refers to Sistema Previdencial in Portuguese.
9 TABLE 2. Prevalence of means-testing in 2014.
Portugal EU-28
Means-tested benefits in % of total social protection benefits 2.1 3.1 Means-tested benefits by function in % of total social protection benefits - - Sickness/ health care benefits 0.0 0.1 Disability benefits 0.2 0.5 Old age benefits 0.6 0.5 Survivors benefits 0.0 0.1 Family/ children benefits 0.9 0.6 Unemployment benefits 0.2 0.3 Housing benefits 0.0 0.6 Social exclusion benefits 0.2 0.4
Source: Eurostat, Social Protection Database, 2017
Findings for Portugal conform with the hypothesis: i) old age and family/ children benefits
perform a social assistance role, and thus exhibit a greater prevalence of means-testing; and ii) survivors and sickness/ health care benefits act as a social insurance against adverse events, and hence display a lower predominance of means-testing.
Means-testing, lack of privacy and anonymity, and misperceptions about fraudulent claims were found to be relevant drivers of welfare stigma (Walker, 2005; Hernandez et al., 2004; The Behavioural Insights Team, 2016).
3.
Data
3.1. Survey design
For the purposes of this paper, we designed a survey on perceptions of welfare-related stigma, which we implemented through internet-online surveys and computer-assisted self-interviews between October 20th and October 29th of 2017 to individuals residing in the Metropolitan
Area of Lisbon.6 Moreover, previous experimental research suggests that interviewer-led survey modes report lower levels of social stigmatizing circumstances than self-administered
techniques, namely regarding depression and sexually-transmitted diseases (Villarroel et al. ,
6 Roberts (2007) mentions that coverage and availability of sample frames, financial costs, and fieldwork time
10
2008; Krumpal, 2013). Therefore, online self-administered questionnaires were the predominant mode of data collection. A total of 493 people started the questionnaire; 171 did not complete the entire survey, resulting in a final sample of 322 accomplished surveys, a
response rate of 65.3 per cent. Participants were offered no monetary nor in-kind compensation and the questionnaire was conducted in Portuguese.
The question design was built on previous quantitative survey studies on the stigma of social
benefits in the UK (Baumberg, 2016), and in the US (Schlesinger and Stuber, 2006).
Stigma-related questions are mostly evaluative, reflecting the respondent’s beliefs or feelings at the very moment of the questionnaire, and hence context effects may play a non-negligible role (Bradburn, Schwarz and Sudman, 1996, Schwarz and Strack, 2003). To mitigate the risks of
context effects, namely unwitting political quarrels or subliminal news coverage on the topic,
the survey included one exclusive wave and the data collection’s timespan pertained to 9
days. The final questionnaire underwent a pilot test of 20 observations were respondents
validated cognitive demands and the construct of interest.
The questionnaire began with a note on the academic nature of the survey, confidentiality
assurance and expected duration of completion. This aimed to provide some context to the respondent and mitigate data-protection-driven response biases.
Respondents were asked about demographic factors – age, gender, place of birth, nationality, marital status, household size, household composition, county of residence -, and social and economic variables – employment status, occupation, income level, educational attainment, and social protection benefit claims during the past year. This characterization of the
respondent was built on the 2015 questionnaire of EU-SILC (Statistics on Income and Living Conditions), run yearly by the Eurostat, and the full range of possible responses were
11
The first set of questions on stigma focused on measuring personal stigma, asking ‘How much
do you agree or disagree, that people should feel ashamed to claim…’, for six types of social protection benefits: old age and disability benefits, sickness/ healthcare benefits,
unemployment benefits, family benefits, education benefits, and social exclusion benefits. These categories do not exactly match the ones presented by Eurostat due to pilot test’s
findings that respondents are not aware of the conceptual specificities of Eurostat classifications on social protection.7 A more straightforward line-up of social protection benefits was adopted to ensure that respondents understood questions unambiguously and
provided meaningful answers. Respondents were asked to declare agreement on a 0-100 scale,
from 0 (‘strongly disagree’) to 100 (‘strongly agree’). The same strategy was followed to measure stigmatization, with respondents inquired on ‘How much do you think that people in general in Portugal would agree or disagree, that people should feel ashamed to claim…’. Benefit categories and response format matched the ones used in the examination of personal
stigma. These two question sets followed closely Baumberg’s (2016) survey, yet a 0-100 scale was adopted – instead of 0-10 scale – since evidence suggests that enlarged numerical scales with descriptions at the extremes tend to strengthen test-retest reliability and internal consistency among attitudinal variables (Weng, 2004, Alwin and Krosnick, 1991, Saris and Scherpenzeel, 1997, Cummins and Gullone, 2000).
The third set of questions aimed to grasp qualitative dimensions of stigmatization and personal stigma. Stigmatization was measured through the enquiry ‘How often have you listen to people saying that: i) ‘individuals that receive social benefits are the parasites of
society?’; ii) ‘individuals that receive social benefits do not want to work?’; and iii) ‘individuals that receive social benefits are criminals or marginals?’. The same set of questions was used for measuring personal stigma, with ‘how often have you listen to people
7 Eurostat classifications on social protection are sickness/ health care, disability, old age, survivors,
12
saying…’ replaced by ‘how often have you thought…’. The response scale for the described set of six questions was a 4-point Likert-type scale - never, once, a few times, many times -, which took into consideration the argument that respondents are forced to declare an
attitudinal preference when mid-point responses are absent (OECD, 2017).
A forth batch of questions inquired about the respondents’ perception of fraud, financial need, and take-up of social benefits. In detail, respondents were asked to provide an educated guess
on the number of individuals out of 100 beneficiaries that i) received the benefits despite not meeting eligibility requirements; and that ii) received social protection benefits despite not
being in financial need. Regarding perceptions of take-up, respondents were requested to number how many eligible individuals out of 100 they believe have seized the social benefits
that they were entitled to.
Additionally, respondents were asked an expectation-based question on the possible reasons for non take-up of social benefits in the hypothetical scenario where they were eligible for
social protection benefits and they needed it, but they decided not to take-up welfare assistance. This question was grounded on the rationale that expectation-based queries are
more specific and behavioural than evaluation-grounded ones (Morrone, Ranuzzi and Tontoranelli, 2009). The set of possible reasons for non take-up of social benefits included: i) personal shame – thinking that social benefits are not for people like me; ii) social shame –
13
On top of this, respondents that reported having received social benefits during the past year were asked a specific set of experience-based questions, which were grounded on prior research on stigmatizing behaviour, namely sexual stigma (Earnshaw and Logie 2015).
Respondents were interrogated the following line of questioning: i) ‘how often have you had to pretend that you do not receive social benefits to be accepted?’; ii) ‘how often have you lost a job or career opportunity for receiving social benefits?’; iii) how often have you been made fun of or called names for receiving social benefits?’; and iv) ‘how often have you lost friendships because you receive social benefits?’. The response scale for these questions was the previously used 4-point Likert-type scale - never, once, a few times, many times.
Finally, respondents were asked about their political orientation through the designation of
their favourite political party, among those presently represented at the Portuguese parliament. This question was complemented by a 0-100 scale agreement position on two ideological statements: first a sentence imported from the conservative Portuguese
Christian-democrat party saying that ‘the Man is exploited when he feels suffocated by the State’s
bureaucratic machine’; and secondly a quotation from a far-left Portuguese party stating that
‘Freedom is to live without precariousness’. 8Although this set of questions is part of the socio-economical characterization of the respondent, we placed it at the end of the questionnaire to diminish the likelihood of consistency bias. In other words, if respondents
stated in the beginning of the questionnaire their political orientation, they might be prone to adjust their stigma perceptions to ensure consistency between their beliefs and their political
identity. Even though political orientation may be coordinated with stigma perceptions, it is less worrying than the opposite situation, and hence political orientation-related questions were placed at the end of the questionnaire.
8 Christian-democrat party refers to Partido do Centro Democrático Social (CDS), and far-left party concerns
14
3.2.Descriptive statistics
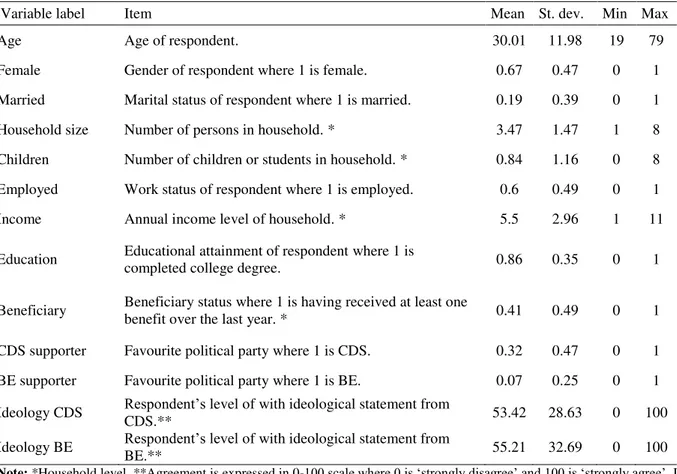
Table 3 provides summary statistics for the main demographic and socio-economic variables
of the sample, which may be useful for the interpretation of variable coefficients.
TABLE 3. Summary statistics for the main demographic and socio-economic variables
Variable label Item Mean St. dev. Min Max Age Age of respondent. 30.01 11.98 19 79 Female Gender of respondent where 1 is female. 0.67 0.47 0 1 Married Marital status of respondent where 1 is married. 0.19 0.39 0 1 Household size Number of persons in household. * 3.47 1.47 1 8 Children Number of children or students in household. * 0.84 1.16 0 8 Employed Work status of respondent where 1 is employed. 0.6 0.49 0 1 Income Annual income level of household. * 5.5 2.96 1 11 Education Educational attainment of respondent where 1 is completed college degree. 0.86 0.35 0 1
Beneficiary Beneficiary status where 1 is having received at least one benefit over the last year. * 0.41 0.49 0 1 CDS supporter Favourite political party where 1 is CDS. 0.32 0.47 0 1 BE supporter Favourite political party where 1 is BE. 0.07 0.25 0 1 Ideology CDS Respondent’sCDS.** level of with ideological statement from 53.42 28.63 0 100 Ideology BE Respondent’s levelBE.** of with ideological statement from 55.21 32.69 0 100
Note: *Household level. **Agreement is expressed in 0-100 scale where 0 is ‘strongly disagree’ and 100 is ‘strongly agree’. If
nothing is mentioned, unit of observation is individual. Benefit types: old age, sickness and health care, family, education, and social exclusion. Source: own computations using survey responses - sections A, B, and G of Exhibit 1 in Appendix. N=322.
Table 4 presents data on the main stigma variables captured by qualitative questions in the
survey. Reported statistics suggest that 19 per cent of respondents thinks that individuals should feel ashamed of receiving social benefits – either old age, sickness/health care, family,
education, or social exclusion’. This figure is outnumbered by 48 per cent of respondents that
15
TABLE 4. Summary statistics for the main stigma-related variables
Variable label Item Mean St. dev. Min Max Personal stigma Personal stigma of respondent where 1 is reporting that individuals should feel ashamed to claim at least one
type of benefit.
0.19 0.39 0 1
Stigmatization Stigmatization of respondent where 1 is reporting that society believes that individuals should feel ashamed to
claim at least one type of benefit. 0.48 0.5 0 1 Perceived fraud Respondent’s perception of% of total beneficiaries fraudulent beneficiaries in 0.32 0.23 0 1
Perceived material Respondent’s perception ofbeneficiaries in % of total beneficiaries non-financially deprived 0.34 0.23 0 1
Perceived take up Respondent’s perception on take-up 0.57 0.26 0 1
Note: Source: own computations using survey responses - sections C and E of Exhibit 1 in Appendix. Unit of observation:
individual. Benefit types: old age, sickness and health care, family, education, and social exclusion. N=322.
3.3. Personal stigma vs stigmatization
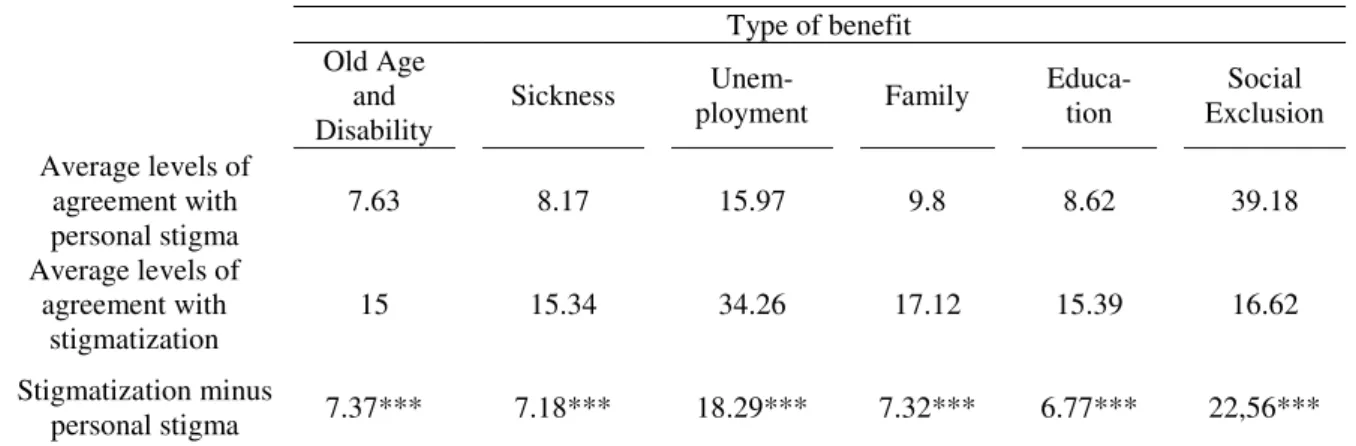
Overall, respondents tend to report higher levels of stigmatization than of personal stigma.
Table 5 presents the average levels of agreement with personal stigma and stigmatisation by
benefit on a 0-100 scale. There is statistical evidence that reported levels of agreement with stigmatization are greater than reported levels of agreement with personal stigma for all benefit items.
TABLE 5. Average reported levels of agreement with stigma and stigmatization by benefit
Type of benefit
Old Age and Disability
Sickness ployment Unem- Family Educa-tion Exclusion Social Average levels of
agreement with
personal stigma 7.63 8.17 15.97 9.8 8.62 39.18 Average levels of
agreement with
stigmatization 15 15.34 34.26 17.12 15.39 16.62 Stigmatization minus
personal stigma 7.37*** 7.18*** 18.29*** 7.32*** 6.77*** 22,56***
Note: Agreement is expressed in 0-100 scale where 0 is ‘strongly disagree’ and 100 is ‘strongly agree’. *Significant at 10%.
**Significant at 5%. ***Significant at 1%. Unit of observation: individual. Source: own computations using survey responses –
section C of Exhibit 1 in Appendix. N=322.
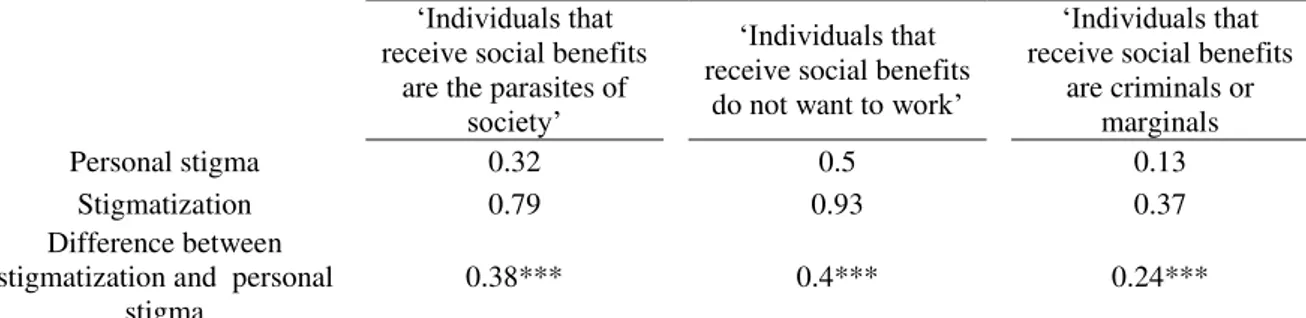
Table 6 shows data on the preponderance of individuals that report personal stigma and
16
that the share of individuals that report stigmatisation is greater than the share of individuals that report personal stigma for all qualitative question items.
TABLE 6. Respondents that reported personal stigma and stigmatization in % of total respondents.
‘Individuals that
receive social benefits are the parasites of
society’
‘Individuals that
receive social benefits do not want to work’
‘Individuals that
receive social benefits are criminals or
marginals Personal stigma 0.32 0.5 0.13
Stigmatization 0.79 0.93 0.37 Difference between
stigmatization and personal
stigma 0.38*** 0.4*** 0.24***
Note:*Significant at 10%. **Significant at 5%. ***Significant at 1%. Unit of observation: individual. Personal
stigma corresponds to having frequently thought that individuals meet the descriptions described in the columns; stigmatization corresponds to having frequently heard people saying statements equal to the ones presented in the columns. Frequently is defined as ‘few times’ or ‘many times’. Source: own computations using survey responses – section D of Exhibit 1 in Appendix. N=322.
3.4. Stigma and non take-up of social benefits
Respondents were asked about possible reasons for non take-up of social benefits under the hypothesis that: i) they were eligible for social benefits and they were in financial stress, and
ii) they decided not to take-up welfare assistance. Whereas respondents that are beneficiaries of social welfare are expected to base their questions on their past experiences,
non-beneficiaries are building their answer on a hypothetical basis. Table 7 depicts the share of
claimants and non-claimants that evocated each of the possible reasons for non take-up under these conditions.
TABLE 7. Respondents that reported each of the reasons for non take-up of social benefits in % of total respondents.
Personal shame shame Social Claims shame shame Any Information comprehen- sion
Time and
organiza-tion None Beneficiary 0.13 0.13 0.14 0.27 0.41 0.41 0.31 Non-beneficiary 0.1 0.13 0.04 0.2 0.39 0.32 0.37
Note: Unit of observation: individual. Respondents could list more than one reason. Source: own computations using survey responses – section E of Exhibit 1 in Appendix. N=322.
17
programme participation – time and organization-, where the most frequent listed reasons for non take-up by beneficiaries.
By inspecting reported reasons for non take-up from non-beneficiaries it is apparent that
results do not vastly differ from the previously reported from claimants. Exceptions to this general finding are the considerable shrinkage in the share of individuals that indicate time and organization as a reason for non take-up; the steep hike in the share of respondents that
mention claims shaming; and a slight increase in the share of individuals that identify at least one shame-related reason for absence of take up of social benefits. One possible explanation
for this situation relates with underestimation of the time and organizational burden implied in the take-up of social benefits by non-claimants, or with non-claimants’ misperception about the psychological hindrances associated with reporting personal facts to social security.
4.
Econometric Results
4.1. Determinants of personal stigma
To investigate on the determinants of personal stigma we regress the different proxies of personal stigma on a set of socio-economic variables. Proxies were constructed by the
transformation of the questions ‘how often have you thought that individuals that receive social benefits are ...” – see sections D of Exhibit 1 in Appendix - into binary variables where
18
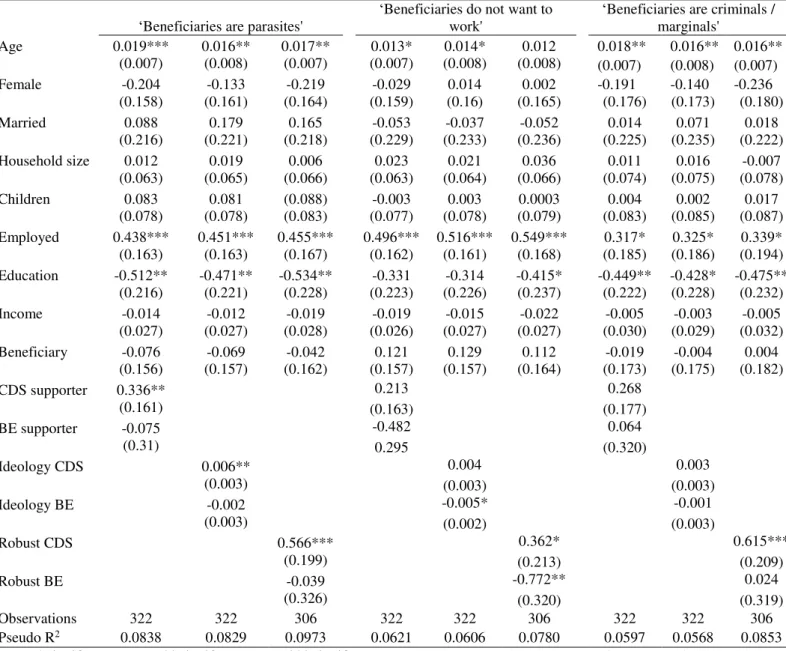
TABLE 8. Probit model on the determinants of personal stigma
‘Beneficiaries are parasites' ‘Beneficiaries do not want to work' ‘Beneficiaries are criminals / marginals' Age
0.019*** (0.007) 0.016** (0.008) 0.017** 0.013* (0.007) (0.007) (0.008) 0.014* (0.008) 0.012 0.018** (0.007) 0.016** 0.016** (0.008) (0.007) Female
-0.204 -0.133 -0.219 -0.029 0.014 0.002 -0.191 -0.140 -0.236 (0.158) (0.161) (0.164) (0.159) (0.16) (0.165) (0.176) (0.173) (0.180) Married
(0.216) 0.088 (0.221) 0.179 (0.218) 0.165 (0.229) -0.053 (0.233) -0.037 (0.236) -0.052 (0.225) 0.014 (0.235) 0.071 (0.222) 0.018 Household size
(0.063) 0.012 (0.065) 0.019 (0.066) 0.006 (0.063) 0.023 (0.064) 0.021 (0.066) 0.036 (0.074) 0.011 (0.075) 0.016 (0.078) -0.007 Children
(0.078) 0.083 (0.078) 0.081 (0.088) (0.083) (0.077) -0.003 (0.078) 0.003 (0.079) 0.0003 (0.083) 0.004 (0.085) 0.002 (0.087) 0.017 Employed
0.438*** 0.451*** 0.455*** 0.496*** 0.516*** 0.549*** 0.317* 0.325* 0.339* (0.163) (0.163) (0.167) (0.162) (0.161) (0.168) (0.185) (0.186) (0.194) Education
-0.512** (0.216) -0.471** (0.221) -0.534** (0.228) (0.223) -0.331 (0.226) -0.314 -0.415* (0.237) -0.449** -0.428* -0.475** (0.222) (0.228) (0.232) Income
(0.027) -0.014 (0.027) -0.012 (0.028) -0.019 (0.026) -0.019 (0.027) -0.015 (0.027) -0.022 (0.030) -0.005 (0.029) -0.003 (0.032) -0.005 Beneficiary
(0.156) -0.076 (0.157) -0.069 (0.162) -0.042 (0.157) 0.121 (0.157) 0.129 (0.164) 0.112 (0.173) -0.019 (0.175) -0.004 (0.182) 0.004 CDS supporter
0.336** 0.213 0.268 (0.161) (0.163) (0.177) BE supporter
-0.075
-0.482 0.064 (0.31) 0.295 (0.320) Ideology CDS
0.006**
0.004 0.003 (0.003) (0.003) (0.003) Ideology BE
-0.002
-0.005* -0.001 (0.003) (0.002) (0.003) Robust CDS
0.566*** 0.362* 0.615*** (0.199) (0.213) (0.209) Robust BE
-0.039
-0.772** 0.024 (0.326) (0.320) (0.319) Observations 322 322 306 322 322 306 322 322 306 Pseudo R2 0.0838 0.0829 0.0973 0.0621 0.0606 0.0780 0.0597 0.0568 0.0853
Note:*Significant at 10%. **Significant at 5%. ***Significant at 1%. ‘Robust CDS’ is equal to one if respondent is a CDS
supporter and reported positive agreement (>50) with the ideological statement of CDS. The same rationale applies to ‘Robust BE’.
White-Huber heteroskedasticity robust standard errors in parentheses. Source: own computations using survey responses – section A, B, D, and F of Exhibit 1 in Appendix.
Results in Table 8 suggest that respondents are more likely to report personal stigma as they age or if employed. Less robust findings acknowledge that having a college degree decreases
the likelihood of reporting personal stigma and that CDS supporters have increased odds of reporting personal stigma towards social welfare beneficiaries. Scarce evidence seems to
19
4.2. Determinants of stigmatization
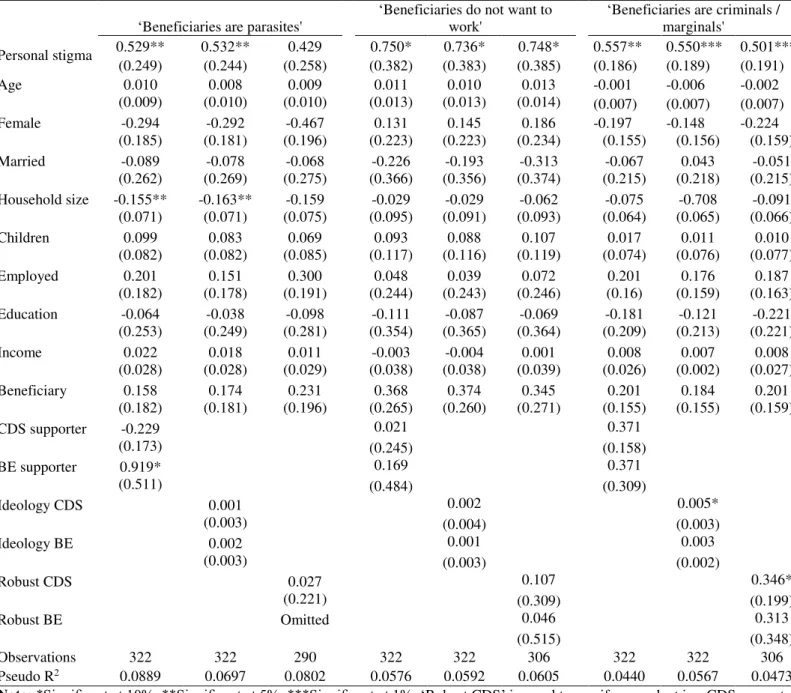
We regress the different proxies of stigmatization on a set of socio-economic variables to study the effect of each of them on stigmatization. Results are displayed in Table 9.
TABLE 9. Probit model on the determinants of stigmatization.
‘Beneficiaries are parasites' ‘Beneficiaries do not want to work' ‘Beneficiaries are criminals / marginals' Personal stigma 0.529** 0.532** 0.429 0.750* 0.736* 0.748* 0.557** 0.550*** 0.501***
(0.249) (0.244) (0.258) (0.382) (0.383) (0.385) (0.186) (0.189) (0.191) Age
(0.009) 0.010 (0.010) 0.008 (0.010) 0.009 (0.013) 0.011 (0.013) 0.010 (0.014) 0.013 (0.007) -0.001 (0.007) -0.006 -0.002 (0.007) Female
(0.185) -0.294 (0.181) -0.292 (0.196) -0.467 (0.223) 0.131 (0.223) 0.145 (0.234) 0.186 -0.197 (0.155) -0.148 (0.156) -0.224 (0.159) Married
(0.262) -0.089 (0.269) -0.078 (0.275) -0.068 (0.366) -0.226 (0.356) -0.193 (0.374) -0.313 (0.215) -0.067 (0.218) 0.043 (0.215) -0.051 Household size
-0.155** -0.163** -0.159 -0.029 -0.029 -0.062 -0.075 -0.708 -0.091 (0.071) (0.071) (0.075) (0.095) (0.091) (0.093) (0.064) (0.065) (0.066) Children
(0.082) 0.099 (0.082) 0.083 (0.085) 0.069 (0.117) 0.093 (0.116) 0.088 (0.119) 0.107 (0.074) 0.017 (0.076) 0.011 (0.077) 0.010 Employed
(0.182) 0.201 (0.178) 0.151 (0.191) 0.300 (0.244) 0.048 (0.243) 0.039 (0.246) 0.072 (0.16) 0.201 (0.159) 0.176 (0.163) 0.187 Education
(0.253) -0.064 (0.249) -0.038 (0.281) -0.098 (0.354) -0.111 (0.365) -0.087 (0.364) -0.069 (0.209) -0.181 (0.213) -0.121 (0.221) -0.221 Income
0.022 0.018 0.011 -0.003 -0.004 0.001 0.008 0.007 0.008 (0.028) (0.028) (0.029) (0.038) (0.038) (0.039) (0.026) (0.002) (0.027) Beneficiary
(0.182) 0.158 (0.181) 0.174 (0.196) 0.231 (0.265) 0.368 (0.260) 0.374 (0.271) 0.345 (0.155) 0.201 (0.155) 0.184 (0.159) 0.201 CDS supporter
-0.229
0.021 0.371 (0.173) (0.245) (0.158) BE supporter
0.919*
0.169 0.371 (0.511) (0.484) (0.309) Ideology CDS
0.001 0.002 0.005*
(0.003) (0.004) (0.003) Ideology BE
0.002
0.001 0.003 (0.003) (0.003) (0.002) Robust CDS
0.027
0.107 0.346* (0.221) (0.309) (0.199) Robust BE
Omitted
0.046 0.313 (0.515) (0.348) Observations 322 322 290 322 322 306 322 322 306 Pseudo R2 0.0889 0.0697 0.0802 0.0576 0.0592 0.0605 0.0440 0.0567 0.0473
Note:*Significant at 10%. **Significant at 5%. ***Significant at 1%. ‘Robust CDS’ is equal to one if respondent is a CDS supporter
and reported positive agreement (>50) with the ideological statement of CDS. The same rationale applies to ‘Robust BE’. White-Huber heteroskedasticity robust standard errors in parentheses. Source: own computations using survey responses – section A, B, C, D, and F of Exhibit 1 in Appendix.
20
4.3. Robustness
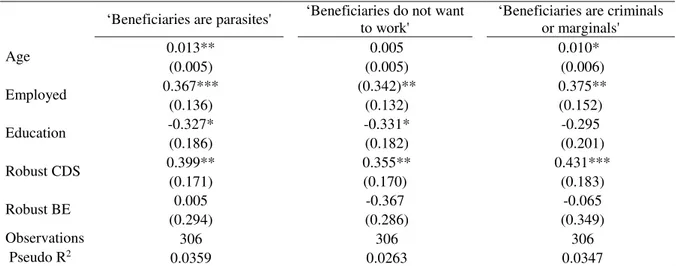
To cross-check the evidence suggested by the probit model on personal stigma presented in Table 7 we have run an ordered probit on the most significant covariates. It seems that
variables age, employed, education, and robust CDS have explanatory power regarding personal stigma. Results are exhibited in Table 10.
TABLE 10. Ordered probit on determinants of personal stigma.
‘Beneficiaries are parasites' ‘Beneficiaries do not want to work' ‘Beneficiaries are criminals or marginals' Age 0.013** 0.005 0.010*
(0.005) (0.005) (0.006) Employed 0.367*** (0.342)** 0.375**
(0.136) (0.132) (0.152) Education -0.327* -0.331* -0.295
(0.186) (0.182) (0.201) Robust CDS 0.399** 0.355** 0.431***
(0.171) (0.170) (0.183) Robust BE 0.005 -0.367 -0.065 (0.294) (0.286) (0.349) Observations 306 306 306 Pseudo R2 0.0359 0.0263 0.0347
Note:*Significant at 10%. **Significant at 5%. ***Significant at 1%. The table presents the model coefficients.
‘Robust CDS’ is equal to one if respondent is a CDS supporter and reported positive agreement (>50) with the
ideological statement of CDS. The same rationale applies to ‘Robust BE’. White-Huber heteroskedasticity robust standard errors in parentheses. Source: own computations using survey responses – section A, D, and F of Exhibit 1 in Appendix.
The same robustness procedure was followed for the drivers of stigmatization. We have run ordered probit model with the regressors personal stigma and household size – see Table 11.
Evidence suggests that individuals with personal stigma are more likely to report stigmatization, i.e. to declare that they have heard frequently stigmatizing comments.
TABLE 11. Ordered probit on determinants of stigmatization.
‘Beneficiaries are parasites' ‘Beneficiaries do not want to work' ‘Beneficiaries are criminals or marginals' Personal
stigma 0.569** (0.240) (0.005) 0.716* 0.575*** (0.183) Household
size (0.055) -0.141 (0.067) 0.005 (0.049) -0.066 Observations 322 322 322 Pseudo R2 0.0417 0.0258 0.0277
*Significant at 10%. **Significant at 5%. ***Significant at 1%. The table presents the model coefficients.
21
5. Concluding Remarks
Overall, respondents tend to report higher levels of stigmatization than of personal stigma, which may result from a conscious will or unconscious predisposition to socially desirable responding.
According to econometric results, individuals are more likely to report personal stigma as they get older or if employed, and the opposite is true if they have completed a college
degree. One possible underlying explanation relates to the fact that individuals may be more prone to believe in meritocracy and in self-determination if they are employed, and hence feel that recipients of social benefits are responsible for poverty or misfortune. Another possible
argument is that educational attainment – in this case, completion of a college degree-, may
broad the individual’s set of references, and thus make her less prone to stigma. Regarding the result that CDS supporters are more prone to report personal stigma, it can be argued that conservative parties tend to be more supportive of policies that reward individual movements across the social ladder, namely entrepreneurship, than of redistribution of income.
On what concerns stigmatization, our findings suggest that personal stigma is able to, in part, explain stigmatization. It seems that individuals tend to coordinate their beliefs about the
general-public opinion on stigma with their own personal views, which is reasonable.
We are aware that our analysis faces some relevant limitations. First, benefit stigma may be intrinsically linked to other social stigmas, such as poverty, single parenting, addictive
substances abuse, or ethnicity. Second, respondents were not provided with information on the monetary value of each social protection benefit, and hence it may happen that
respondents have different beliefs about the financial relevance of monetary allowances.
Finally, attitudinal measures such as personal stigma and stigmatization share an intrinsic
22
References
Alwin, D.F. and Krosnick, J.A. (1991), The reliability of survey attitude measurement: the influence of question and respondent attributes. Sociological Methods and Research, 20(1):139-181.
Ashenfelter, O. (1983). Determining participation in income-tested social programs. Journal of the American
Statistical Association, 78(383), 517-525.
Blank, R. and Ruggles, P. (1996). When do women use AFDC and food stamps? The dynamics of eligibility vs. participation. Journal of Human Resources, 24(1):54-87.
Baumberg, B. (2016). The stigma of claiming benefits: a quantitative study. Journal of Social Policy,
45(2):181-199.
Bradburn, N.M., Schwartz, N. and Sudman, S. (1996). Thinking about answers: the application of cognitive processes to survey methodology. San Francisco, Jossey-Bass.
Chase, E. and Walker, R. (2013), The co-construction of shame in the context of poverty: beyond a threat to the social bond. Sociology, 47(4).
Cook, F. and Barrett, E. (1992). Beliefs about recipient deservingness and program effectiveness as explanations of support. In Support for the American welfare state: views of congress and the public, 95-145. New York,
Columbia University Press.
Crocker, J., Major, B. and Steele, C. (1998). Social stigma. In Handbook of social psychology 4th ed., 2:504-553,
edited by D.T. Gilbert, S. T. Fiske, and G. Lindzey. Boston, McGraw-Hill.
Cummins, R. and Gullone, E. (2000), Why we should not use 5-point Likert scales: the case for subjective quality of life measurement. Proceedings of the Second International Conference on Quality of Life in Cities, Singapore.
Douglas, M. and Isherwood, B. (1979). The world of goods: towards an anthropology of consumption. London, Allen Lane.
Earnshaw, V. and Logie, C.H. (2015). Adapting and validating a scale to measure sexual stigma among lesbian, bisexual and queer women. PLoS ONE, 10(2).
Engels, D. and Sellin, C. (2000), Vorstudie zur Nicht-Inanspruchnahme zustehender Sozialhilfeleistungen. ISG Sozialforschung and Gesllschaftspolitik GmbH, June.
Eurostat (2017), Compendium of methodological clarifications – ESSPROS: European System of Integrated Social Protection Statistics, 2017 edition. Publications Office of the European Union, Luxembourg.
Eurostat (2017). Social Protection Database. Retrieved from: http://ec.europa.eu/eurostat/web/social-protection/data/database (Accessed on 29 December 2017).
Ferreira, L.V. (2008). Persistent poverty: Portugal and the southern European welfare regime. European
Societies, 10(1):49-71.
Goffman, E. (1963). Stigma: notes on the management of the spoiled identity. New York, Prentice-Hall. Halpern, J. and Hausman, J.A. (1986). Choice under uncertainty: a model of applications for the social security disability insurance program. Journal of Public Economics, 31(2):131-161.
Hernanz, V., Malherbet, F., and Pellizzari, M. (2004). Take-up of welfare benefits in OECD countries: a review of the evidence. Employment and Migration Working Papers no. 17. OECD Social. OECD Publishing, Paris. Hochschild, J. (1996). Facing up to the American dream. New Jersey, Princeton University Press.
Klugel, J. and Smith, E. (1986). Beliefs about inequality: American’s views of what is and ought to be. New
York, Aldine De Gruyter.
Komter, A. E. (1996). Reciprocity as a principle of exclusion: gift giving in the Netherlands. Sociology,
23
Krumpal, I. (2013). Determinant of social desirability in sensitive surveys: a literature review. Qual Quant,
47:2020-2047
Larsen, A. L. (2008). The institutional logic of welfare attitudes: how welfare regimes influence public support.
Comparative Political Studies, 41(2):145-168
Michel, R. (1980). Participation rates in the aid to families with dependent children program, Part I. Working Paper 1387-02. The Urban Institute.
Moffit, R. (1983). An Economic model of welfare stigma. The American Economic Review, 73(5):1023-1035.
Morrone, A., Ranuzzi, G. and Tontonarelli, N. (2009). How good is trust? Measuring trust and its role for the progress of societies, OECD Statistics Working Papers, no 2009/03, OECD Publishing, Paris.
OECD (2017), OECD Guidelines on Measuring Trust, OECD Publishing, Paris.
Pinker, R. (1979). Social theory and social policy. London, Heinemann Educational Books.
Roberts, C. (2007). Mixing modes of data collection in surveys: a methodological review. Economic and Social Research Council – National Centre for Research Methods, NCRM Methods Reviews Papers NCRM/008. Saris, W.E. and Scherpenzeel, A. (1997), The validity and reliability of survey questions – a meta-analysis of MTMM studies. Sociological Methods Research, 25(3)-341-383.
Schwartz, B. (1967). The social psychology of the gift. The American Journal of Sociology, 73(1):1-11.
Schwartz, N. and Strack, D. (2003). Reports on subjective well-being: judgemental processes and their methodological implications. In Well-being: the foundations of hedonic psychology, edited by D. Kahneman, E.
Diener and N. Schwartz. New York, Russel Sage Foundation.
Schlesinger, M. and Stuber, J. (2006). Sources of stigma for means-tested government programs. Social Science & Medicine, 63(4):933-945.
Storer, P. and Van Audenrode, M.A. (1995). Unemployment insurance take-up rates in Canada: facts, determinants, and implications. The Canadian Journal of Economics, 28(4):822-835.
Spicker, P. (1984). Stigma and social welfare: Croom Helm.
Taylor-Gooby, P. F. (1976). Rent benefits and tenants’ attitudes. The batley rent rebate and allowance study.
Journal of Social Policy, 5(1):33-48
The Behavioural Insights Team (2016). Poverty and decision-making: how behavioural science can improve opportunity in the UK, October 2016
Vaalavuo, M. (2015). Poverty dynamics in Europe: from what to why. Working Paper 3/2015, Directorate General of Employment, Social Affairs and Inclusion, European Commission. Publications Office of the European Union, Luxembourg.
Villarroel, M.A. et al. (2008), T-ACASI reduces bias in STD measurements: the national STD and behaviour measurement experiment. Sexually Transmittable Diseases, 35:449-506.
Warlick, J. L. (1982). Participation of the Aged in SSI. The Journal of Human Resources, 17(2):236-260
Walker, R. (2005). Social security and welfare: concepts and comparisons. Milton Keynes, Open University Press.
24
Appendix
Exhibit 1. Survey questionnaire – English version
Section A. Socio-economic characterization
Q1. What is your age? Answer: __________________________________ Q2. What is your gender? Answer:□Female □Male □I do not want to tell Q3. Were you born in Portugal? Answer: □Yes □No
Q4. Are you a Portuguese national? Answer: □Yes □No
Q5. What is your current marital status? Answer:□Single □Married □Widow □Divorced □Co-habitation Q6. How many individuals belong to your household?
Children (individuals less than 18) should be included.
Answer: __________________________________ Q7. How many children or students belong to your
household?
Answer: __________________________________
Q8. Please specify your county of residence: Answer:□Alcochete □Almada □Amadora □Barreiro □Cascais
□Lisboa □Loures □Mafra □Moita □Montijo □Odivelas
□Oeiras □Palmela □Seixal □Sesimbra □Setúbal □Sintra
□Vila Franca de Xira □Outro
Q9. Are you currently working? Answer:□Yes □No □I do not know □I do not want to answer If Yes is select in Q9 → Q11
Q11. Are you working full time or part time? Answer:□Full-time □Part-time □I do not know □I do not want to tell If Yes is select in Q9 → Q12
Q12. Are you self-employed? Answer:□Yes □No □I do not know □I do not want to tell If Yes is not selected in Q9 → Q13
Q13. Which of the following situations describes your current work status?
Answer:□Unemployed □Student / non-paid internship □Retired
□Permanently injured for work □Domestic □Volunteer □Other
□I do not know □I do not want to answer
Q14. Specify the annual income before taxes of your
household:
Answer:□0-5.000€ □5.001-10.000€ □10.001-13.500€
□13.501-19.000€ □19.001-27.500€ □27.501-32.500€
□32.501-40.000€ □40.001-50.000€ □50.001-100.000€
□100.001-250.000€ □mora than 250.001€
Q15. What is the highest level of formal education that
you have completed?
Answer: □Primary (1º Ciclo) □Preparatory (2ºCiclo)
□Middle school (3ºCiclo) □Secondary (12º ano)
□Post- secondary (curso técnico n/ especializado)
□Undergraduate □Master □PhD □Other □I do not know □I do not want to tell
Section B. Social protection benefits
Q16. Please mention if your household has received any
of these benefits during the last year:
Answer:
□Dependency complementary income (Complemento por dependência)
□Complementary income for elderly (Complemento solidário p/ idosos)
□Disability pension (Pensão de invalidez)
□Orphan’s pension (Pensão de orfandade)
□Survival pension (Pensão de sobrevivência)
□Old age pension (Pensão de velhice)
□Widow’s pension (Pensão de viuvez)
□Early retirement (Pré-reforma)
□Funeral allowance (Subsídio de funeral)
□None
□I do not know
□I do not want to tell
Q17. Has a member of your household received
unemployment benefits (or other kind of unemployment-targeted welfare allowances) during the last year?
Answer:
□Yes □No □I do not know □I do not want to tell
Q18. Please mention if your household has received any
of these family- and children-related benefits during the
Answer:
25
last year: □Pregnancy benefit (Abono pré-natal)
□Parenthood benefit (Subsídio de parentalidade)
□Child care benefit (Subsídio para assistência a filho)
□ Family assistance benefit (Subsídio para assistência a 3ª pessoa)
□Lifelong monthly benefit (Subsídio mensal vitalício)
□Other □None
□I do not know □I do not want to tell
Q19. Please mention if your household has received any
of these health care and sickness benefits during the last year:
Answer:
□Sickness benefit (Subsídio de doença)
□Insurance against accidents at work and occupational diseases (Seguro
de acidentes de trabalho)
□Other □None
□I do not know □I do not want to tell
Q20. Please mention if your household has received any
of these education-related benefits during the last year:
Answer:
□Scholarship (Bolsa de estudo)
□Other □None
□I do not know □I do not want to tell
Q21. Please mention if your household has received any
of these social exclusion benefits during the last year:
Answer:
□Income support allowance (Rendimento de Inserção Social)
□Other □None
□I do not know □I do not want to tell
Section C. Quantitative measures of stigma and stigmatization Q22. Mention your agreement in a 0-100 scale, being 0
‘strongly disagree’ and 100 ‘strongly agree’ with the following sentence: ‘In my opinion people should feel ashamed to receive…’
Answer:
□Old age and disability pensions: ____________________________
□Health care and sickness benefits: ___________________________
□Unemployment benefits: __________________________________
□Family / children benefits: _________________________________
□Education benefits: ______________________________________
□Social exclusion benefits: _________________________________
Q23. Mention your agreement in a 0-100 scale, being 0
‘strongly disagree’ and 100 ‘strongly agree’ with the following sentence: ‘In Portugal, the general public believes that people should feel ashamed to receive…’
Answer:
□Old age and disability pensions: ____________________________
□Health care and sickness benefits: ___________________________
□Unemployment benefits: __________________________________
□Family / children benefits: _________________________________
□Education benefits: ______________________________________
□Social exclusion benefits: _________________________________
Section D. Qualitative measures of stigma and stigmatization Q24. How often have you listen in the last year to people
saying that individuals that receive social benefits are the parasites of society?
Answer:
□Never □Once or twice
□Few times □Many times
Q25. How often have you listen in the last year people to
saying that individuals that receive social benefits do not want to work?
Answer:
□Never □Once or twice
□Few times □Many times
Q26. How often have you listen in the last year people to
saying that individuals that receive social benefits are criminals or marginals?
Answer:
□Never □Once or twice
□Few times □Many times
Q27. How often have you thought in the last year that
individuals that receive social benefits are the parasites of society?
Answer:
□Never □Once or twice
□Few times □Many times
Q28. How often have you thought in the last year people
that individuals that receive social benefits do not want to work?
Answer:
□Never □Once or twice
□Few times □Many times
Q29. How often have you thought in the last year people
that individuals that receive social benefits are criminals or marginals?
Answer:
□Never □Once or twice
26
Section E. Perceptions of fraud, economic deprivation, and take-up
Regarding the previously described social protection benefits:
Q30. Among 100 beneficiaries, how many do you believe that are not entitled for social protection benefits?
Answer: ____________________________________________
Q31. Among 100 beneficiaries, how many do you
believe that are not economically-deprived?
Answer: ____________________________________________ Q32. Among 100 entitled individuals, how many do you
believe that receive social benefits? Answer: ____________________________________________
Section F. Reasons for non-take of social benefits
Suppose that you are entitled for social benefits and that you are economically-deprived.
Q33. Under this hypothesis, which of the following
reasons could lead you to non-take up the social benefits?
You may list as many reasons as you deem convenient.
Answer:
□Personal shame –thinking that social benefits are not for people like
me.
□Social shame –fear that others think less of me or judge me because I
receive welfare assistance.
□Claims shame –feeling uncomfortable about disclosing personal
information or feeling diminished by social security workers.
□Information comprehension - difficulties in understanding information
about programme requirements.
□Time and organization –complexity and time burden of the steps
required to participate in welfare programmes.
□None
Section G. Enacted stigma (this section was only presented to respondents that reported being recipients of social benefits) Q34. How often have you had to pretend that you do not
receive social benefits to be accepted?
Answer:
□Never □Once or twice
□Few times □Many times
Q35. How often have you lost a job or career
opportunity for receiving social benefits?
Answer:
□Never □Once or twice
□Few times □Many times
Q36. How often have you been made fun of or called
names for receiving social benefits?
Answer:
□Never □Once or twice
□Few times □Many times
Q37. How often have you lost friendships because you
receive social benefits?
Answer:
□Never □Once or twice
□Few times □Many times
Section G. Political orientation
Q38. Which of the political parties currently represented
in the Portuguese Parliament do you identify the most with?
Answer:
□BE □PEV
□CDS-PP □PS
□PCP □PSD □Other
Q39. Mention your agreement in a 0-100 scale, being 0
‘strongly disagree’ and 100 ‘strongly agree’ with the following sentence: ‘the Man is exploited when he feels
suffocated by the State’s bureaucratic machine’
Answer: ____________________________________________
Q39. Mention your agreement in a 0-100 scale, being 0
‘strongly disagree’ and 100 ‘strongly agree’ with the following sentence: ‘Freedom is to live without
precariousness’
27
Annex
Exhibit 2. Respondents that reported each of the items in section G (enacted stigma) in % of total respondents.
Never
Once or Twice
A few or many times
How often have you had to pretend that you do not
receive social benefits to be accepted? 92.78%
1.48% 5,74%
How often have you lost a job or career opportunity for
receiving social benefits? 98.41%
0.79% 0.8%
How often have you been made fun of or called names
for receiving social benefits? 96.92%
- 3.08%