Carlos Pestana Barros & Nicolas Peypoch
A Comparative Analysis of Productivity Change in Italian and Portuguese Airports
WP 006/2007/DE _________________________________________________________
Susana Santos
Using a SAM-based model to measure the
distributional impacts of government policies
WP 31/2009/DE/UECE _________________________________________________________
Department of Economics
W
ORKINGP
APERSISSN Nº 0874-4548
School of Economics and Management
I nt e rna t iona l I nput -Out put Assoc ia t ion
Work ing Pa pe rs in I nput -Out put Ec onom ic s
WPI OX 0 9 -0 1 0
Susa na Sa nt os
Using a SAM-based model to measure the
distributional Impacts of government
Work ing Pa pe rs in I nput -Out put Ec onom ic s
The Working Papers in Input-Output Economics (WPIOX) archive has been set up under the auspices of the International Input-Output Association. The series aims at disseminating research output amongst those interested in input-output, both academicians and practitioners. The archive contains working papers in input-output economics as defined in its broadest sense. That is, studies that use data collections that are in the format of (or are somehow related to) input-output tables and/or employ input-input-output type of techniques as tools of analysis.
Edit ors
Erik Dietzenbacher Bent Thage
Faculty of Economics and Business Statistics Denmark
University of Groningen Sejrøgade 11
PO Box 800 2100 Copenhagen Ø
9700 AV Groningen Denmark
The Netherlands
Code : WPI OX 0 9 -0 1 0
Aut hor: Susana Santos
T it le :
Using a SAM-based model to measure the distributional Impacts of government policies
Abst ra c t :
A Social Accounting Matrix (SAM) will be proposed as a working instrument for studying the (macro-)impacts of government policy on the distribution of income.
A numerical version of the SAM, constructed from the System of National Accounts (SNA), will serve as the basis for the construction of an algebraic version of the same matrix for Portugal.
To this end, a computable (numerically solvable) general (economy-wide) equilibrium (macroeconomic balance) approach will be adopted.
A SAM-based model will be constructed, in which each cell is defined with a linear equation or system of equations, whose components are all the known and quantified transactions of the SNA, using parameters deduced from the numerical SAM that served as the basis for this model.
A scenario will be defined and analysed from an experiment carried out in relation to the distributional impact of a reduction in the direct tax rate paid by households.
K e yw ords: Social accounting matrix (SAM); System of national accounts (SNA); Computable general equilibrium model; Portugal.
Arc hive s:Social Accounting Matrices
Corre sponde nc e a ddre sse s:
Susana Santos, ISEG (School of Economics and Management)/TULisboa - Technical University of Lisbon; UECE – Research Unit on Complexity and Economics
Rua Miguel Lupi, 20, 1249-078 Lisboa, Portugal
USING A SAM-BASED MODEL TO MEASURE THE DISTRIBUTIONAL IMPACTS
OF GOVERNMENT POLICIES
BY SUSANA SANTOS∗
ISEG (School of Economics and Management)/TULisboa – Technical University of Lisbon;
UECE – Research Unit on Complexity and Economics and DE – Department of Economics
Abstract
A Social Accounting Matrix (SAM) will be proposed as a working instrument for studying
the (macro-)impacts of government policy on the distribution of income.
A numerical version of the SAM, constructed from the System of National Accounts (SNA),
will serve as the basis for the construction of an algebraic version of the same matrix for
Portugal.
To this end, a computable (numerically solvable) general (economy-wide) equilibrium
(macroeconomic balance) approach will be adopted.
A SAM-based model will be constructed, in which each cell is defined with a linear equation
or system of equations, whose components are all the known and quantified transactions of
the SNA, using parameters deduced from the numerical SAM that served as the basis for this
model.
A scenario will be defined and analysed from an experiment carried out in relation to the
distributional impact of a reduction in the direct tax rate paid by households.
∗
Rua Miguel Lupi, 20, 1249-078 Lisboa, Portugal ([email protected])
1. INTRODUCTION
The main purpose of this paper is to study the impacts of government policy on the
distribution of income, paying close attention to the corresponding response of the different
macroeconomic aggregates and balances.
Because of this aim, the author was obliged to work with data that were more than a
decade out of date, since 1995 was the only year for which there existed workable data.
However, the task to be carried out in this study is nonetheless an experiment that has never
previously been undertaken for Portugal, while, furthermore, it seeks to demonstrate the
importance and potentialities of the working instrument used.
The Social Accounting Matrix (SAM) is the working instrument, i.e. a square matrix in
which, by convention, the entries made in rows represent resources, incomes, receipts or
changes in liabilities and net worth, whilst the entries made in columns represent uses,
outlays, expenditures or changes in assets. Therefore, for each row there is a corresponding
column, with the totals of each of these (row and column) being equal. These figures will
include both production and trade, as well as institutional accounts, which are subdivided into
yet other accounts.
A numerical version of the SAM, constructed from the System of National Accounts
(SNA), will serve as the basis for the construction of an algebraic version of the same matrix.
This methodological choice was linked to the fact that, underlying the SAM, there are
interrelated subsystems that, in the numerical version of the matrix, provide an analytical
picture of the circular flow or the general equilibrium interactions of the market economy,
when studied during a particular accounting period. On the other hand, in the algebraic
version of the SAM, it is possible to measure and quantify the economy-wide effects of
changes in the particular nominal flows represented by the numerical version (injections into
and leakages from the system), which might be the result of policy measures.
Section 2 provides the presentation of the numerical version of the SAM, constructed in
perfect consonance with the System of National Accounts (SNA) through a top-down
approach.
In turn, Section 3 presents an algebraic version of the above-mentioned SAM, within a
static short-term framework, adopting a computable (numerically solvable) general
(economy-wide) equilibrium (macroeconomic balance) approach.
Like the numerical version, this algebraic version of the SAM, which will also be
referred to as a SAM-based model, is constructed in perfect consonance with the SNA, with
are all the known and quantified transactions of that system. This model will be calibrated
using parameters and exogenous variables calculated from the database, i.e. the numerical
version of the SAM, presented in Section 2.
Section 4 defines and analyses a scenario arising from an experiment carried out into
the distributional impact caused by a reduction in the direct tax rate paid by households. For
this purpose, some parameters and the exogenous variables used to calibrate the model will
be subjected to a shock, the SAM-based model will then be processed and the impacts will be
studied by considering the relative differences between the aggregates, balances and
indicators presented in Section 3, both after and before the experiment.
Section 5 ends the paper with some concluding remarks designed to emphasise the
importance of the SAM as a working instrument.
2. THE NUMERICAL VERSION OF THE SAM
Both the purpose of this paper and the available information dictated the classification
adopted for the accounts of the numerical and, consequently, the algebraic versions of the
SAM. Thus, in the case of the domestic economy, “Production and Trade” was divided into
factors of production, activities and products, and “Institutions” into current, capital and
financial accounts. Besides these accounts, we also have an aggregate account for the “rest of
the world”.
The criterion used by the author for ordering the accounts was the one underlying the
basic SAM represented in Table 1.
Nowadays, the SNA in general and the Portuguese National Accounts in particular
provide several (mutually exclusive) possibilities for the disaggregation of products and
activities, but only a few possibilities for the institutional accounts, and even fewer
possibilities for the factors of production.
The SNA that has been used in Portugal since 1995 has been the European System of
National and Regional Accounts in the European Community of 1995 – ESA 95 (Eurostat,
1996), which is based on the 1993 version of the International United Nations System of
National Accounts – SNA 93, prepared by the Inter-Secretariat Working Group and
published by the United Nations Statistical Office (ISWG, 1993).
Table 2 shows the Portuguese SAM that could be constructed from the SNA for the
particular purpose described in the introduction, and which will be broken down even further,
Table 1. Portuguese basic SAM (Social Accounting Matrix) for 1995 (in millions of euros)
Outlays
(expenditures)
Incomes
(receipts)
Production and Trade Institutions Rest of the World (RW) (7) TOTAL Factors (1) Activities (2) Products (3) Current A. (4) Capital A. (5) Financial A. (6) P rodu ction an d T rad e
Factors (1) 0
Gross Added Value, at factor cost
(70 725)
0 0 0 0
Compensation of Factors from
the RW (3 243)
Aggregate Factors Income
(73 968)
Activities (2) 0 0 Production
(154 394) 0 0 0 0
Production Value (154 394)
Products (3) 0
Intermediate Consumption (84 102) Trade and Transport Margins (0) Final Consumption (64 898) Gross Capital Formation (19 623)
0 Exports (24 433) Aggregate Demand (193 056) In stitu tion s Current A. (4) Gross National Income, at factor cost
(70 542)
Net taxes on production
(-346)
Net taxes on products (10 283 )
Current Transfers
(42 145) 0 0
Current Transfers from the RW (3 960) Aggregate Income (126 583) Capital A.
(5) 0 0 0
Gross Saving (17 291) Capital Transfers (4930) Net borrowing (40) Capital Transfers from the RW (2 320) Investment Funds (24 582) Financial A.
(6) 0 0 0 0 0
Financial Transactions
(35 030)
Financial Transactions from the RW
(9 257)
Total financial transactions
(44 287)
Rest of the World (RW) (7)
Compensation of Factors to the RW
(3 426)
Net taxes on production
(-87)
Imports + net taxes on
products (28 127 + 252)
Current Transfers to the RW
(2 249)
Capital Transfers to the RW
(29) Financial Transactions to the RW (9 217) Transactions Value to the
RW (43 213) TOTAL Aggregate Factors Income (73 968) Total Costs (154 394) Aggregate Supply (193 056) Aggregate Income (126 583) Aggregate Investment (24 582) Total financial transactions (44 287) Transactions Value from the
RW (43 213)
Table 2. Portuguese macro-SAM (Social Accounting Matrix) for 1995 (in millions of euros)
Table 2 (continued). Portuguese macro-SAM (Social Accounting Matrix) for 1995 (in millions of euros)
This macro-SAM was constructed from blocks of sub-matrices or sets of sub-matrices,
whose transactions have common characteristics. These blocks can be specified by
identifying the transactions involved in the National Accounts, a task that is undertaken in
Section 3. A systematised description of the sources of information and the method of
calculation used is provided by Santos in “SAMs and SNA: An Application” (2005) and
“Constructing a Database for Economic Modelling from the SNA: a SAM for Portugal”
(2006). The first of these also includes a description of the SAM cell contents, although this
relates to a SAM calculated for 1999.
As can be seen from its totals, Table 2, which represents the so-called macro-SAM, is a
possible disaggregation of Table 1, which in turn represents the so-called basic SAM (the
completely aggregated macro-SAM).
If we look at the world around us, it is easy to agree with the statement that “the
determinants of the distribution of income and the mechanisms by which it changes represent
one of the most difficult theoretical and empirical problems facing the science of economics”
(Dervis et al., 1982). If it were an easy task, then certainly the world today would be a fairer
place.
Working on the empirical side, the author believes that “SAMs provide an invaluable
statistical framework for the analysis of the mapping between the different kinds of
distributions one may want to consider” (Dervis et al., 1982).
Perhaps in a rather simplistic way, but at least to begin with, the author accepts that the
study of income distribution in a society involves the study of how the national pie is divided
up and how it can then be sliced. The first aspect can be analysed from one or more snapshots
of the economy, provided by a suitably disaggregated SAM, and the second from the
modelling of that same SAM. Therefore, of crucial importance here is the way in which the
primary and secondary distribution of income, as well as the use that is made of it, are dealt
with. The factors of production account and the current account of the institutions are the
accounts that cover such issues.
“In the SAM, the institution entitled ‘households’ really represents all the people in
society” (Dervis et al., 1982). It therefore needs to be disaggregated. On the other hand, the
distribution of the (primary) incomes that accrue as a result of involvement in either the
processes of production or the ownership of assets among institutions (and activities) is
The question thus arises “how should these disaggregations be performed?” This will
not be discussed here, however, because our dependence on the available data is total. Even
so, despite the fact that the information is not up-to-date, it is nonetheless sufficient for us to
be able to at least study some aspects of the distribution of income.
The workable data made available to the author for studying and modelling income
distribution in Portugal consisted of an incomplete disaggregated National Accounting Matrix
(NAM) and a previous (provisional) version for 1995, constructed as a result of the
collaboration of the Portuguese Statistical Institute (Instituto Nacional de Estatística) in the
work undertaken by the Leadership Group on Social Accounting Matrices, under the
coordination of Statistics Netherlands (LEG, 2003).
In that NAM, labour was broken down into six types, according to the gender and
education level of workers, and households were broken down into four types, according to
their main source of income. Such disaggregation was performed using specific data sources,
such as household budget surveys, the labour force survey and administrative data
(employment records, income tax and social security files, etc.).
Thus, in this paper, the factors of production will be disaggregated into two main
groups: labour (or employees) and own assets; the latter being further disaggregated into
labour (employers and own-account workers) and capital. In turn, households were
disaggregated into four types according to their main source of income.
Thus, one of the many advantages of the SAM approach could be referred to here. To
use the words of Pyatt (1991), by “reducing the social accounts to the essential”, the SAM
approach “provides a useful starting point for understanding the assumptions and
manipulations that have been built into the secondary source material which is typically
employed by the majority of analysts”.
This top-down approach made it possible to compile a numerical version of the SAM
with 34 rows and 34 columns, which has the particularity of being balanced and perfectly
consonant with the national accounts when aggregated at the level of 26 rows and columns –
the case of the macro-SAM represented by Table 2. However the disaggregation into 34 rows
and columns was also performed from credible sources, with its differences from the
aggregated level (26 x 26) not being very significant, generally speaking.
The non-adjusted submatrices were adjusted one by one, using the RAS (Richard A.
Stone) method, and the balanced SAM was obtained, as represented in Table 3 – the
numerical version, or the database, of the algebraic version, or the model, to be defined and
Table 3. Portuguese SAM (Social Accounting Matrix) for 1995 (in millions of euros)
Table 3 (continued). Portuguese SAM (Social Accounting Matrix) for 1995 (in millions of euros)
Table 3 (continued). Portuguese SAM (Social Accounting Matrix) for 1995 (in millions of euros)
3. THE ALGEBRAIC VERSION OF THE SAM
3.1. FRAMEWORK AND ASSUMPTIONS
The starting idea will be the one outlined in the article “Macroeconomic Modelling
Based on Social-Accounting Principles” and expressed in the following words:
“A dictum usually attributed to Lord Keynes posits that every economic model has a
corresponding accounting framework. For macroeconomic models, this accounting
framework must be complete in the sense that every receipt must be offset by a
corresponding expenditure. One consequence is that all the transactions in a model can be
expressed within a SAM framework. The values assumed by all the different types of
transactions can therefore be set out as the elements of a SAM” (Drud et al., 1986: 112).
Therefore, a static model will be defined and conceived as a starting point for both a
comparative static and dynamic approach. At the same time, since it will not be possible to
calculate and work with price and volume indexes, a fixed-price model will be designed.
Linear equations will be worked with, thereby avoiding elasticities, marginal propensities and
other parameters that should be estimated from an empirical base, which is not available.
Thus, the main concern will be to capture (very simply at first) all the national
accounting transactions considered in the numerical version of the SAM (the database for this
model), and, after its calibration, to conduct an experiment and define a scenario that
highlights the aspects that the author intends to study.
The process of calibration will involve determining the parameters and exogenous
variables that are to be specified, so that, after processing the model, the basic SAM
(presented in Section 2) is exactly replicated. The software used to process the model was the
General Algebraic Modelling System (GAMS), and the quantification of the whole process
took into consideration all the available information, involving the values calculated using the
information contained in that same basic SAM, further supplemented by additional data.
These values will be assumed as valid for the scenario showing “the distributional impact
caused by a reduction in the direct tax rate paid by households”, which are to be outlined in
Section 4, except for those which will be subject to shock.
Since the purpose of this model is to study income distribution, some common
specifications for the model will not be considered. These specifications include the ones that
are also constructed within a general equilibrium framework, usually to study trade issues,
such as the distinction between domestically produced and imported products, while external
For the purposes of simplification, it will also be assumed that all domestically
produced output is market output, and therefore any output produced for own final use and
other non-market output will be considered as non-existent.
On the other hand, it will be assumed that there is sufficient production capability
available in the economy to enable domestic output to respond to aggregate demand. Such a
response will be considered exclusive, since (for the time being) imports are exogenous.
Many fixed parameters will be adopted and some variables will be calculated from
exogenous parameters and other variables, in order to enable future experiments to be carried
out with their respective changes.
This model is considered to be a step forward in comparison with the ones that the
author has previously worked with, and, at the same time, a (necessary) stage along a path
that she would like to pursue in SAM modelling. From her own experience, the author feels
that SAM modelling does have a convenient path. Thus, on the one hand, when working on
SAM modelling or with SAM-based models, some knowledge of SAM construction is
considered to be a necessary, although not a sufficient, condition. On the other hand,
underlying SAM modelling is a process of gradual maturation, which should begin with the
construction and decomposition of accounting and fixed-price multipliers and the conducting
of experiments with them. That is what the author has done, based essentially on the works of
Pyatt, 1988; Pyatt and Roe, 1977; and Pyatt and Round, 1985. For an illustration of this work,
see Santos, 1999; 2001; 2003; 2003a; 2004; 2004a; 2005a; and 2007.
This paper represents the materialisation of the first step after multipliers.
As this model is supported by a SAM database, constructed in perfect consonance with
the national accounts, its specifications will either obey or be derived from the SNA.
By convention, the parameters will be stated in lower case and the variables in upper
case (at least the first letter of these). Endogenous variables will be written in normal letters,
whereas exogenous variables, as well as the parameters, will be written in italics. The indices
of each variable and parameter (the sets in the Appendix) – identified in lower-case subscripts
– describe the SAM accounts, the first index representing the row and the second one the
column, being separated by commas. The symbols used in the description of the model will
be listed alphabetically and without any indices, according to their type (endogenous or
exogenous variables and parameters) in the Appendix.
The entire model will be worked upon in gross terms, so that the consumption of fixed
3.2. THE BLOCKS OF THE SAM
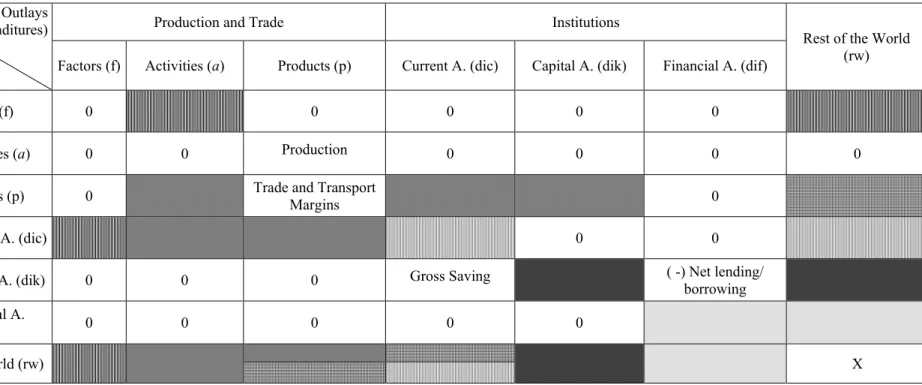
The SAM blocks, identified in Table 4, are sub-matrices or sets of sub-matrices (as
seen in the Basic SAM – Table 1) with common characteristics. The specification of these
blocks will be carried out below and involves, on the one hand, identifying the transactions of
the National Accounts that are considered in the calculation of the same in the numerical
SAM and, on the other hand, defining the equation, or system of equations, to be considered
Table 4. Basic SAM by blocks
Outlays (expenditures)
Incomes (receipts)
Production and Trade Institutions
Rest of the World (rw) Factors (f) Activities (a) Products (p) Current A. (dic) Capital A. (dik) Financial A. (dif)
Pr
odu
ction
an
d
Trade
Factors (f) 0 0 0 0 0
Activities (a) 0 0 Production 0 0 0 0
Products (p) 0 Trade and Transport
Margins 0
In
stitu
tion
s Current A. (dic) 0 0
Capital A. (dik) 0 0 0 Gross Saving ( -) Net lending/ borrowing
Financial A.
(dif) 0 0 0 0 0
Rest of the World (rw) X
Blocks with more than one sub-matrix:
Compensation of the factors of production Current Transfers
Domestic Trade Capital Transfers
External Trade Financial Transactions
a) Compensation of factors of production consists of the income of the institutional
sectors originating from the compensation of the services provided through their real and
financial assets to the activities of production and to the rest of the world, namely
compensation of employees (transaction D1 of the National Accounts) and compensation of
own-account assets, including the compensation of employers and/or own-account workers,
and of capital, namely property income (transaction D4, balances B2g and B3g of the
National Accounts).
GAVa = βa*VPa (3.1)
GAVfle,a = d1sfle,a*GAVa (3.2)
D1a = ΣfleGAVfle,a (3.3)
GAVfle = ΣaGAVfle,a (3.4)
GAVfoal,a = b3s foal,a*GAVa (3.5)
B3ga = ΣfoalGAVfoal,a (3.6)
GAVfoal = ΣaGAVfoal,a (3.7)
GAVfoak,a = b2gpfoak,a*(D1a + B3ga) (3.8)
B2ga = ΣfoakGAVfoak,a (3.9)
GAVfoak = ΣaGAVfoak,a (3.10)
CFRfle,rw = D1RWfle
CFRfoak,rw = D4RW
GNIfle = GAVfle+CFRfle,rw-CFSrw,fle (3.11)
GNIdic,fle= cedic,fle*GNIfle (3.12)
GNIfoal = GAVfoal (3.13)
GNIdic,foal= coadic,foal*GNIfoal (3.14)
GNIfoak = GAVfoak+CFRfoak,rw-CFSrw,foak (3.15)
GNIdic,foak= skdic,foak*GNIfoak (3.16)
GNIdic = ΣfleGNIdic,fle+ΣfoalGNIdic,foal+GNIdic,foak (3.17)
GNI = ΣdicGNIdic (3.18)
CFSrw,fle = clrrw,fle*GAVfle (3.19)
CFSrw,foak = D4PRW
b) Production represents the output of goods and services (transaction P1 of the
National Accounts).
VPp = ADp-TMTp-NTPp-IMp (3.20)
VPa =ΣpVPa,p (3.22)
c) External Trade considers the transactions in goods and services from non-residents
to residents, or imports (transaction P7 of the National Accounts – IMrw,p), and from residents
to non-residents, or exports (transaction P6 of the National Accounts – EXp,rw)
d) Net indirect taxes or net taxes on production and imports
d.1) Net Taxes on Production represents the (other) taxes on production
(transaction D29 of the National Accounts) minus the (other) subsidies to production
(transaction D39 of the National Accounts).
NTAdic,a = ntagdic,a*NTAAa (3.23)
NTArw,a = ntarwrw,a*NTAAa (3.24)
NTAdic = ΣaNTAdic,a (3.25)
NTAa = ΣdicNTAdic,a (3.26)
NTArw = ΣaNTArw,a (3.27)
NTA = ΣdicNTAdic+NTArw (3.28)
d.2) Net Taxes on Products represents the taxes on products (transaction D21 of
the National Accounts) minus the subsidies on products (transaction D31 of the National
Accounts).
NTPp = tpp*DTp (3.29)
NTPdic,p = ntpgdic,p*NTPp (3.30)
NTPrw,p = ntprwrw,p*NTPp (3.31)
NTPdic = ΣpNTPdic,p (3.32)
NTPrw = ΣpNTPrw,p (3.33)
NTP = ΣdicNTPdic +NTPrw (3.34)
e) Trade and Transport Margins are realised on goods purchased for resale and are a
part of the production of wholesale trade services, retail trade services and the repair services
of motor vehicles, motorcycles and personal and household goods. They amount to zero,
since they are negative in relation to the three above-mentioned activities (because the
corresponding value has already been recorded in the production sub-matrix), but are positive
and have the same amount in relation to all the other ones.
TMp,p = tmp,p*DTp (3.35)
TMcp,p = tmcp,p*DTp (3.36)
f) Domestic Trade is represented by the value of domestically transacted products,
either domestically produced or imported.
DTmpp = VICp + FCp + GCFp (3.38)
DTp = DTmpp - TMTp - NTPp (3.39)
f.1) Intermediate Consumption consists of the value of the goods and services
consumed as inputs by a process of production, excluding those fixed assets whose
consumption is recorded as consumption of fixed capital (transaction P2 of the National
Accounts).
VICa = γa*VPa (3.40)
VICp,a =icpp,a*VICa (3.41)
VICp = ΣaVICp,a (3.42)
VIC = ΣpΣaVICp,a (3.43)
f.2) Final Consumption consists of the expenditure incurred by resident
institutional units on those goods or services that are used for the direct satisfaction of
individual needs or wants or of the collective needs of members of the community
(transaction P3 of the National Accounts).
FCdic = apcdic* DIdic (3.44)
FCp,dic = fcsp,dic*FCdic (3.45)
FCrw,dic = fcsrwrw,dic*FCdic (3.46)
f.3) Gross Capital Formation includes: gross fixed capital formation (transaction
P51 of the National Accounts), changes in inventories (transaction P52), and acquisitions
minus disposals of valuables (transaction P53).
GCFp,dik = gfcfp,dik*P51dik + P52p*chinvp,dik + advp,dik*P53dik (3.47)
GCFdik = Σp GCFp,dik (3.48)
P52p = chinvcp*ASp (3.49)
P53dik = advcdik*Sdik (3.50)
g) Current Transfers includes: current taxes on income, wealth, etc. (transaction D5
of the National Accounts); social contributions (transaction D61); social benefits in cash
(transaction D62); other current transfers (transaction D7); adjustment made for the change in
the net equity of households in pension fund reserves (transaction D8).
CTdic,dic= d5sdic,dic*D5dic + d61sdic,dic*D61dic +d62sdic,dic*D62Pdic +
+ d7dic,dic*D7Pdic +D8dic,dic (3.51)
CTrw,dic = d62rwsrw,dic *D62Pdic +d7rwsrw,dic *D7Pdic (3.52)
CTRdic = Σdic CTdic,dic (row sum) (3.54)
CTPdic = Σdic CTdic,dic (column sum) (3.55)
D5dic = tidic*AIdic (3.56)
D61dic = scdic*GNIdic (3.57)
h) Capital Transfers includes: capital taxes (transaction D91 of the National
Accounts), investment grants (transaction D92); other capital transfers (transaction D99) and
acquisitions less disposals of non-financial non-produced assets (transaction K2).
KTdik,dik = d91dik,dik *D91Pdik +D92Rdik*d92dik,dik + D99Rdik*d99dik,dik (3.58)
KTrw,dik = D92Prw,dik+ D99Prw,dik + K2 rw,dik (3.59)
KTdik,rw = D92Rdik *d92rwdik,rw + D99Rdik*d99rwdik,rw (3.60)
D91Pdik = tkdik * D99Rdik (3.61)
D92Rdik = cgfcf dik*P51dik (3.62)
KTRdik = ΣdikKTdik,dik (row sum) (3.63)
KTPdik = ΣdikKTdik,dik (column sum) (3.64)
i) Gross Saving measures the portion of aggregate income that is not used for final
consumption expenditure and current transfers to Portuguese institutions or to the rest of the
world.
Sdic = (1-apcdic)*DIdic (3.65)
Sdik,dic = sidik,dic*Sdic (3.66)
Sdik = ΣdikSdik,dic (3.67)
j) Financial Transactions represent the transactions in financial assets and liabilities
between institutional units, and between these and the rest of the world. They are classified as
monetary gold and special drawing rights; currency and deposits; securities other than shares;
loans; shares and other equity; insurance technical reserves; and other accounts
receivable/payable (F1-7 of the National Accounts).
FTRWdif,rw = FTrw,dif + NLBdif (3.68)
k) Closure - Net borrowing/lending
The net lending (+) or borrowing (-) of the total economy is the sum of the net lending
or borrowing of the institutional sectors. It represents the net resources that the total economy
makes available to the rest of the world (if it is positive) or receives from the rest of the world
(if it is negative). The net lending (+) or borrowing (-) of the total economy is equal (but with
an opposite mathematical sign) to the net borrowing (-) or lending (+) of the rest of the world.
Here, those amounts that fall short of (+) or exceed (-) the investment funds used to
financial transactions either from (in the case of net borrowing) or to (in the case of net
lending) the rest of the world. This is why the mathematical signs defined in the first
paragraph of this item have been exchanged.
NLBdik,dif = AINVdik – (Sdik +KTRdik+KTdik,rw) (3.69)
NLBdif = Σdik NLBdik,dif (3.70)
3.3. MACROECONOMIC AGGREGATES AND BALANCES
Gross domestic product at market prices:
GDP = Σa GAVa + NTP+ NTA (3.71)
Gross national income (at market prices):
GNIMP = GNI+ Σdic NTPdic+ Σdic NTAdic (3.72)
Gross disposable income:
DI = Σdic DIdic (3.73)
DIdic = GNIdic+ NTAdic+ NTPdic + CTRdic + CTdicrw – CTPdic– CTrwdic (3.74)
Gross saving:
S = Σdic Sdic (3.75)
Net lending/borrowing (of the economy): NLBdif
The main items in the budget of all institutions, namely of the government, can be
calculated from the respective accounts. Thus, the total budget balance is the respective net
lending/borrowing – NLBdik,dif.; the current budget balance is the respective gross saving –
Sdik; and the capital budget balance is the difference between the first and the second.
The main items of the balance of payments can also be calculated from the rest of the
world account. However, this will not be done here, because the relations with the rest of the
world were not considered relevant within the framework of this paper (see Santos, 2006).
3.4. STRUCTURAL INDICATORS OF THE DISTRIBUTION AND USE OF INCOME
Since that the distributional relationships across production sectors or activities and
social groups are determined by macro behaviour, which, in turn, is determined by the
behaviour of individuals within and on behalf of institutions, this means that if we are to
study the distributional impact of exogenous shocks resulting from any policy, as proposed in
the Introduction (Section 1) and exemplified in Section 4, it is important to have some
indicators that, in addition to the macroeconomic aggregates and balances, synthesise that
impact as much as possible. Therefore, two aspects will be considered: the distribution of
Due to a lack of information about the total number of persons by groups of
households, only the structures of the distribution and use of income will be considered here
– leaving the identification of inequality to be dealt with at a subsequent stage.
A. Distribution of generated income
A.1. Among factors of production and activities
The functional distribution of income can be studied here through an analysis of the
division of gross added value at factor cost (excluding indirect taxes) between labour and
capital, disaggregated by activity. It is also important to distinguish between types of labour
(Dervis et al., 1982) – in this case by the level of education of workers.
Digavfle,a= (D1a / GAVa)*100 (3.76)
Digavfoal,a= (B3ga / GAVa)*100 (3.77)
Digavfoak,a= (B2ga / GAVa)*100 (3.78)
Digavfle = (Σa D1a / Σa GAVa)*100 (3.79)
Digavfoal = (Σa B3ga / Σa GAVa)*100 (3.80)
Digavfoak = (Σa B2ga / Σa GAVa)*100 (3.81)
Digavflefle,a= (GAVfle,a/ D1a)*100 (3.82)
Digavfoalfoal,a= (GAVfoal,a / B3ga)*100 (3.83)
Digavflefle = (GAVfle / Σa D1a)*100 (3.84)
Digavfoalfoal = (GAVfoal / Σa B3ga)*100 (3.85)
A.2. Among institutions and socioeconomic groups, within households
By excluding from the gross added value at factor cost generated in the domestic
economy the compensation of the factors of production sent to the rest of the world, and by
including the compensation of the factors of production received from the rest of the world
(in accordance with equation (3.17)), the gross national income is obtained and its
institutional distribution can be studied.
Dignidic = (GNIdic / GNI) *100 (3.86)
B. Distribution and use of disposable income among institutions and socioeconomic
groups, within households.
By excluding from gross national income the current transfers paid to other institutions
and to the rest of the world, and by including the current transfers received from the other
institutions and from the rest of the world and, in the case of the government, the net indirect
taxes (in accordance with equation (4.4)), the institutional distribution of gross disposable
final consumption and saving, although non-financial and financial corporations do not have
any final consumption.
Dididic = (DIdic / DI) *100 (3.87)
UdiFCdic = (FCdic / DIdic) *100 (3.88)
UdiSdic = (Sdic / DIdic) *100 = 100 - UdiFCdic (3.89)
More specific and exact conclusions would require specification of the households’
composition – number of workers by household, size, age composition, dependency ratios,
etc. (Dervis et al., 1982).
4. A SCENARIO SHOWING THE DISTRIBUTIONAL IMPACT CAUSED BY A REDUCTION IN THE
DIRECT TAX RATE PAID BY HOUSEHOLDS
Considering the framework, assumptions and purposes of this version of the algebraic
SAM, an experiment was carried out involving current transfers from households.
Because the intention was to study the distributional impacts of government policies, a
scenario was defined, considering a 1percent reduction in the direct tax rate (ti) paid by
households to the government, involving a leakage from the government’s main source of
receipts (current transfers from households) and an injection of receipts (resulting from the
reduction in expenditure) into one item of the expenditure of households (current transfers to
the government), although not the most important one.
The immediate purpose of this experiment is to improve the financial situation of
households.
In the framework within which the above-mentioned scenario will be defined and the
experiment performed, the direct taxes, or the current taxes on income, wealth, etc. paid by
households, represent 6.5 percent of their aggregate income (households pay 68.9 percent of
the direct taxes paid by all institutions). On the other hand, employees pay 8.5 percent of their
aggregate income, which is the highest direct rate within the groups of households (they also
pay 58.7 percent of the direct taxes paid by all institutions and 85.2 percent of those paid by
households). Employers and own-account workers pay the lowest rate: 2.5 percent.
At the level of macroeconomic aggregates and balances, the performed experiment
resulted in a decrease of 1.5 percent in gross domestic product at market prices (GDP), as
well as in gross national income at market prices (GNIMP). The disposable income (DI) of
households only increased by 0.04 percent and, curiously, employees, who pay the major
share of direct taxes, are the only household group that shows a decrease, due to the
their disposable income. The other institutions showed a generalized decrease in their DI,
particularly the government, with a decrease of 7.9 percent, which had a consequent negative
impact on both demand and production. This situation led to decreases in GDP and GNIMP,
as mentioned above, as well as in the gross saving and net borrowing of the economy, the
latter showing a significant increase of 6.3 percent.
The dependence of final consumption on the gross disposable income of all domestic
institutions, including the government, as well as the relationship between aggregate demand
and production, are certainly the main causes of these results.
At the level of the budgets of institutions, the impacts on current balances, expressed by
gross saving, and on total balances, expressed by the net lending/borrowing, a generalized
decrease was observed, except in the case of the current balance of those households that do
not belong to the group of employees. The current balance of the general government was the
one that suffered the greatest impact, with a reduction in the current deficit resulting mainly
from the impact of the reduction in disposable income on final consumption. The impacts at
the level of the capital balance were not significant – which was expected, because the
experiment was conducted with the flows of the current account. As far as the total balance is
concerned, the net lending of households recorded a slight improvement (0.4 percent),
whereas that of financial corporations and non-profit institutions serving households
worsened – the former significantly (- 14.7 percent) and the latter slightly (- 0.2 percent). In
turn, the net lending of non-financial corporations was converted into net borrowing,
although the net borrowing of the general government recorded a decrease of 3.0 percent –
reflecting the decrease observed in the current deficit. All these fluctuations in the total
budget balances resulted in an increase in the net borrowing of the economy of 6.3 percent, as
seen above.
Because the experiment was performed using a version of the algebraic SAM with too
many fixed parameters and exogenous variables, the structural changes were certainly not
significant. Let us, however, look at the results.
At the level of the distribution of generated income among factors of production, before
the experiment, the compensation of labour received by employees represented 54.5 percent,
whereas the compensation of labour received by employers and/or own-account workers
represented 7.5 percent, and the compensation of capital represented 38.0 percent of
generated income. After the experiment, a slight improvement can be seen in the positions of
the latter two factors of production in detriment to the first. Workers with high and medium
On the other hand, in the case of the distribution of generated income among
institutions and socioeconomic groups within households, while, before the experiment,
households received 84.5 percent of gross national income, with 62.1 percent corresponding
to the group whose main source of income was wages and salaries (employees), non-financial
corporations received 16.4 percent, and the remainder was distributed within the other
institutions – with the general government recording a negative share. After the experiment,
the position of the institutions either did not change or registered a slight improvement –
except in the case of the households in general and of the group whose main source of
income is wages and salaries (employees) in particular, and, in both scenarios, in the case of
the general government, which recorded an increase in its negative position.
The distribution of disposable income among institutions before the experiment
revealed that households had 69.3 percent of disposable income, with the group whose main
source of income is wages and salaries (employees) having 41.9 percent; the general
government had a share of 16.0 percent (similar to the group of households whose main
source of income is the compensation of labour received by employers, including
own-account workers); and the non-financial corporations had a share of 11.2 percent, with the
others being less significant. The scenario that resulted from the experiment showed an
improvement in the relative positions of households, financial corporations and
non-profit institutions serving households in detriment to the other two, with special emphasis
being given to the case of the general government. Mention should also be made of the
positive impact that was noted in the relative position of the group of households whose main
source of income is connected with old age (recipients of pensions).
In parallel with this, an experiment was carried out (Santos, 2008) involving current
transfers to households, more concretely social benefits other than social transfers in kind
paid by the government to households, and, generally speaking, the defined scenario revealed
smaller generated impacts with similar mathematical signs.
5. CONCLUDING REMARKS
Within a SNA framework, the application performed for Portugal showed that
numerical and algebraic versions of a SAM can each be constructed. In the former version,
each cell assumed a specific numerical value, with the sums of the rows being equal to the
sums of the columns. In the latter version, each cell was represented by algebraic expressions
that, together with those of all the other cells, represent a SAM-based model, the calibration
all the known national accounting transactions, making it possible to deduce macroeconomic
aggregates and balances, as well as structural indicators of the distribution and use of income.
With the initial aim of improving the financial situation of households, the scenario
resulting from a reduction of 1.0 percent in the direct tax rate paid by households to the
government showed that not only did the situation of both households and the general
government worsen, but so did the situation of the whole economy.
Research should, however, continue, revising the assumptions, the parameters, the
structure and all the details of these two versions of the indispensable working instrument that
APPENDIX
Conventions and declarations
Sets (set indices: lower-case subscripts)
f ε Factors of production
− Labour – employees (fle) [with low education level (flel), with medium education level (flem), with high education level (fleh)]
− Own assets (foa)
- Labour – employers and/or own-account workers (foal) [with low education level
(foall), with medium education level (foalm), with high education level (foalh)]
- Capital - interests, profits, rents (foak)
aε Activities [agriculture, hunting and forestry; fishing and operation of fish hatcheries and fish
farms (group1, a1); industry, including energy (group 2, a2); construction (group 3, a3); wholesale and retail trade, repair of motor vehicles and household goods, hotels and restaurants; transport and communications (group 4, a4); financial, real-estate, renting and business activities (group 5, a5); other service activities (group 6, a6)]
p ε Products [products of agriculture, hunting, forestry, fisheries and aquaculture (group 1, p1);
products from mining and quarrying, manufactured products and energy products (group 2, p2); construction work (group 3, p3); wholesale and retail trade services, repair services, hotel and restaurant services, transport and communication services (group 4, p4); financial intermediation services, real-estate, renting and business services (group 5, p5); other services (group 6, p6)]
di ε Domestic Institutions
– dic (current account of di) [households(dich): employees (group 1, dich1), employers and own-account workers (group 2, dich2), recipients of pensions (group 3, dich3), others (group 4; dich4); non-financial corporations (dicnfc); financial corporations (dicfc); general government (dicg); non-profit institutions serving households (dicnp-NPISHs)] – dik (capital account of di) [households (dikh), non-financial corporations (diknfc),
financial corporations (dikfc), general government (dikg), and non-profit institutions serving households (diknp-NPISHs)]
– dif (financial account of di)
rw ε rest of the world
In variables and parameters with two indices, the first represents the row and the second the
column accounts (both indices may be equal).
Parameters (lower-case, italics)
β.. proportion of gross added value in the value of production of each group of activities
γ .. proportion of intermediate consumption in the value of production of each group of activities
adv.. share of the value of acquisitions less disposals of valuables of each group of products by each group of domestic institutions in the total value of acquisitions less disposals of valuables by these institutions
advc .. coefficient of acquisitions less disposals of valuables: amount expended by each group of domestic institutions on acquisitions less disposals of valuables per unit of gross saving
apc .. average propensity to consume of each group of domestic institutions: amount of final consumption per unit of (gross) disposable income
b2gp.. proportion of capital compensation (gross operating surplus) in labour compensation
b3s.. share of compensation of employers and/or own-account workers (gross mixed income) in the gross added value
ce .. coefficient of main source of income of domestic institutions (households) recipients of compensation of employees
cgfcf .. rate of coverage of gross fixed capital formation of each group of domestic institutions by investment grants received by these institutions
chinv .. share of the value of changes in inventories of each group of products by each group of domestic institutions in the total value of changes in inventories of that group of products
chinvc .. coefficient of changes in inventories: amount of change in inventories of each group of products per unit of supply
clr .. share of compensation of employees paid by activities and sent to the rest of the world
coa .. coefficient of main source of income of domestic institutions (households) recipients of compensation of employers and/or own-account workers
d1s .. share of compensation of employees in the gross added value
d5s .. share of current tax on income, wealth, etc. paid by each group of domestic institutions to each group of domestic institutions (Portuguese general government), in the total of current tax on income, wealth, etc. paid by the former
d61s .. share of social contributions paid by each group of domestic institutions to each group of domestic institutions in the total of social contributions paid by the former
d62rws.. share of social benefits other than social transfers in kind paid by each group of domestic institutions to the rest of the world in the total of social benefits other than social transfers in kind paid by the former
d7 .. share of other current transfers paid by each group of domestic institutions to each group of domestic institutions in the total of other current transfers paid by the former
d7rws .. share of other current transfers paid by each group of domestic institutions to the rest of the world in the total of social benefits other than social transfers in kind paid by the former
d91 .. share of capital taxes paid by each group of domestic institutions (households) to each group of domestic institutions (Portuguese general government) in the total of capital taxes paid by the former
d92.. share of investment grants paid by each group of domestic institutions (Portuguese general government) to each group of domestic institutions in the total of investment grants received by the latter
d92rw.. share of investment grants paid by the rest of the world to each group of domestic institutions in the total of investment grants received by the latter
d99.. share of other capital transfers paid by each group of domestic institutions to each group of domestic institutions in the total of other capital transfers received by the latter
d99rw.. share of other capital transfers paid by the rest of the world to each group of domestic institutions in the total of other capital transfers received by the latter
fcs .. proportion of expenditure on final consumption in each group of products in the total value of the final consumption of each group of domestic institutions
fcsrw .. proportion of expenditure on final consumption in the rest of the world in the total value of the final consumption of each group of domestic institutions
gfcf .. share of the value of gross fixed capital formation in each group of products by each group of domestic institutions in the total value of gross fixed capital formation by these institutions
icp .. coefficient of the intermediate consumption of products: proportion of intermediate consumption of each group of products per unit of intermediate consumption of each group of activities
ntag .. share of net taxes on production paid by each group of activities andreceived by domestic institutions (Portuguese general government)
ntpg .. share of net taxes on each group of products received by domestic institutions (Portuguese general government)
ntprw .. share of net taxes on each group of products received by the rest of the world (European Union institutions)
sc .. social contribution rate: social contributions paid by domestic institutions, per unit of received gross national income
si .. saving identity special
sk.. share of compensation of capital received by domestic institutions
ti .. direct tax rate: current taxes on income, wealth, etc. paid by domestic institutions, per unit of received aggregate income
tk .. rate of capital tax levied on other capital transfers received by domestic institutions
tm .. rate of trade and transport margins on each group of domestically transacted products: amount of trade and transport margins per unit of value of domestically transacted products
tmc .. trade and transport margins coefficient of correction
tp .. (net) tax rate on each group of products: amount of (net) taxes on products per unit of the value of domestically transacted products
Exogenous variables (upper-case, at least the first letter, italics)
CFR.. compensation of the factors of production received from the rest of the world
CFS.. compensation of the factors of production sent to the rest of the world
D1RW.. compensation of employees (transaction D1 of the SNA) received from the rest of the world
D4PRW .. property income (transaction D4 of the SNA) sent to the rest of the world
D4RW .. property income (transaction D4 of the SNA) received from the rest of the world
D62P .. social benefits other than social transfers in kind (transaction D62 of the SNA) paid by domestic institutions
D62RW .. social benefits other than social transfers in kind (transaction D62 of the SNA) received by domestic institutions from the rest of the world
D7P .. other current transfers (transaction D7 of the SNA) paid by domestic institutions
D7RW .. other current transfers (transaction D7 of the SNA) received by domestic institutions from the rest of the world
D8 .. adjustment made for the change in the net equity of households in pension fund reserves (transaction D8 of the SNA)
D99P .. other capital transfers (transaction D99 of the SNA) paid by domestic institutions to the rest of the world
D99R .. other capital transfers (transaction D99 of the SNA) received by domestic institutions
EX .. value of exports (transaction P6 of the SNA, at f.o.b. prices)
FT .. financial transactions (transactions F1 to F7 of the SNA), except those received from the rest of the world
IM .. value of imports (transaction P7 of the SNA, at c.i.f. prices)
K2 .. acquisitions less disposals of non-financial non-produced assets (transaction K2 of the SNA)
NTAA .. net taxes on production paid by each group of activities
P51 .. value of gross fixed capital formation (transaction P51 of the SNA)
Endogenous variables (upper-case, at least the first letter, normal)
AD .. value of aggregate demand (at market prices) AFIP .. aggregate factors income (paid)
AFIR .. aggregate factors income (received) AI .. aggregate income (received)
AINV .. aggregate investment AIP .. aggregate income (paid)
AS .. aggregate supply (value at market prices)
B2g .. gross operating surplus (balance B2g of the SNA) B3g .. gross mixed income (balance B3g of the SNA)
CFS.. compensation of the factors of production sent to the rest of the world (except, property income sent to the rest of the world)
CT .. current transfers
CTP .. (total) current transfers paid by each group of domestic institutions to (all) domestic institutions
CTR .. (total) current transfers received by each group of domestic institutions from (all) domestic institutions
DI .. (gross) disposable income
Didi .. percentage of gross disposable income received by domestic institutions Digav .. percentage of income generated by the factors production
Digavfle .. percentage of income generated by employees, by level of education
Digavfoak ..indicator of the distribution of income (gross added value) generated by capital among activities (in percentage terms)
Digni.. percentage of generated income (gross national income) received by domestic institutions DT.. value of domestically transacted products, at basic-c.i.f. prices
DTmp ..value of domestically transacted products, at market prices D1 .. compensation of employees (transaction D1 of the SNA)
D5 .. current taxes on income, wealth, etc. (transaction D5 of the SNA) D61 .. social contributions (transaction D61 of the SNA)
D91P .. capital taxes (transaction D91 of the SNA) paid by domestic institutions
D92R ..investment grants (transaction D92 of the SNA) received by domestic institutions FC .. value of final consumption (transaction P3 of the SNA), at market prices
FTRW .. financial transactions (transactions F1 to F7 of the SNA) received by domestic institutions from the rest of the world
GAV .. gross added value, at factor cost
GCF .. value of gross capital formation (transaction P5 of the SNA), at market prices GDP.. gross domestic product, at market prices
GNI .. gross national income, at factor cost GNIMP.. gross national income, at market prices INVF .. investment funds
KT .. capital transfers
KTP .. (total) capital transfers paid by each group of domestic institutions to (all) domestic institutions
KTR .. (total) capital transfers received by each group of domestic institutions from (all) domestic institutions
NLB .. net lending / borrowing
NTA.. net taxes on production (transaction D29-D39 of the SNA) NTP .. net taxes on products (transaction D21-D31 of the SNA) P52 .. value of changes in inventories (transaction P52 of the SNA)
P53 .. value of acquisitions less disposals of valuables (transaction P53 of the SNA) S .. gross saving
TFTP .. total financial transactions (paid) TFTR .. total financial transactions (received)
TM .. trade and transport margins (without correction) TMc .. trade and transport margins – correction
TVRWP .. value of transactions to the rest of the world TVRWR .. transactions value from the rest of the world
UdiFC ..percentage of gross disposable income used in final consumption by domestic institutions
UdiS .. percentage of gross disposable income used in (gross) saving by domestic institutions VCT .. value of total costs (at basic prices)
VIC .. value of intermediate consumption (transaction P2 of the SNA) at market prices VP .. value of production (transaction P1 of the SNA), at basic prices
REFERENCES
Dervis, Kemal et al., General Equilibrium Models for Development Policy, Cambridge
University Press: Cambridge; 1982.
Drud, Arne et al., “Macroeconomic Modelling Based on Social Accounting Principles”.
Journal of Policy Modeling 1986; 8(1); 111-145.
Eurostat, European System of Accounts (ESA 95). Eurostat: Luxembourg; 1996.
IWSG - Inter-Secretariat Working Group, System of National Accounts (SNA 93).
Commission of the European Communities – Eurostat, Brussels/Luxembourg;
International Monetary Fund, Washington, DC; Organization for Economic Co-operation
and Development, Paris; United Nations Statistical Office, New York; World Bank,
Washington DC; 1993.
LEG - Leadership Group on SAM, “Handbook on Social Accounting Matrices and Labour
Accounts” Eurostat Working Papers, Theme – Population and Social Conditions
3/2003/E/N 23; Luxembourg; 2003.
Pyatt, Graham, “A SAM Approach to Modeling”. Journal of Policy Modeling 1988; 10(3);
327-352.
“Fundamentals of Social Accounting”. Economic Systems Research 1991;
3(3); 315-341.
Pyatt, Graham and Roe, Alan, Social Accounting for Development Planning with special
reference to Sri Lanka. Cambridge University Press: Cambridge; 1977.
Pyatt, Graham and Round, Jeffery, Accounting and Fixed Price Multipliers in a Social
Accounting Matrix Framework, in Pyatt G. and Round, J. (eds.) Social Accounting
Matrices. A Basis for Planning. A World Bank Symposium, The World Bank,
Washington, DC 1985; 186-206.
Santos, Susana, “The Social Accounting Matrix as a working instrument for defining
economic policy. Its application to Portugal during the period 1986-90, with emphasis on
the agro-industrial sector”. PhD dissertation, ISEG-TU Lisboa (only available in
Portuguese); Lisbon; 1999.
“The importance of the Social Accounting Matrix. Its application to Portugal
during the period 1990-95”. ISEG-TU Lisboa – Department of Economics Seminar,
Lisbon; 2001.
“Quantitative analysis of the economic flows between Portugal and the other
Centre of Research on European and International Economics – ISEG-TU Lisboa;
Lisbon; 2003.
“Social Accounting Matrices for Portugal in 1998-99. Modelling the effects
of changes in government receipts and expenditure”. Working Paper No. 7/2003/
Department of Economics/Research Unit on Complexity and Economics – ISEG-TU
Lisboa, Lisbon, 2003a.
“Portuguese net borrowing and the government budget balance. A SAM
approach”. Journal of Policy Modeling 2004; 26(6); 703-717.
“Distribution of aggregate income in Portugal from 1995 to 2000 within a
SAM framework. Modelling the household sector”, Working Paper No. 12/2004/
Department of Economics/Research Unit on Complexity and Economics – ISEG-TU
Lisboa; Lisbon; 2004a.
“Social Accounting Matrix and the System of National Accounts: An
Application”, School of Economics and Management. Working Paper No. 14/2005/
Department of Economics/Research Unit on Complexity and Economics – ISEG-TU
Lisboa; Lisbon; June 2005.
“Effects of changes in flows of funds between Government and households.
A SAM approach to Portugal”. EconWPA-GE (Working Paper Archive in Economics –
General Equilibrium) 0507002; 2005a.
“Constructing a Database for Economic Modelling from the System of
National Accounts: a Social Accounting Matrix for Portugal”. Working Paper Series –
SSRN (Social Science Research Network) abstract=916089; 2006.
“Modelling Economic Circuit Flows in a Social Accounting Matrix
Framework. An Application to Portugal”. Applied Economics 2007 39(13-15),
1753-1771.
“A SAM-based Model, constructed from the SNA, to be used for studying the
distributional impacts of government policies in Portugal". Working Paper Series – SSRN