A Work Project, presented as part of the requirements for the Award of a Masters Degree in Economics from the Faculdade de Economia da Universidade Nova de Lisboa.
C
RITICALA
NALYSIS:
P
ORTUGUESE9
THG
RADEE
XAMR
ESULTS ANDS
OCIOECONOMIC FACTORSRita Ramos Azevedo
Student Number 399
A Project carried out on the Applied Policy Analysis course, under the supervision of:
Ana Balcão Reis and Maria do Carmo Seabra
1
CRITICAL ANALYSIS:PORTUGUESE 9THGRADE EXAM RESULTS AND SOCIOECONOMIC
FACTORS
ABSTRACT
The typical indicator used to assess school performance is average test score results. Literature has pointed out serious weaknesses of this measure as a school performance indicator. The strongest criticism resides in the bias that may exist in socially disadvantaged schools. In fact, this measure does not take into account socioeconomic and other variables which are relevant in determining student‟s school performance and out of the scope of school control. Using school level cross-section data from Portugal for 9th grade exams between 2005 and 2010, I have explicitly calculated the impact of these variables on school achievement as regards exams. I found an important causal effect between socioeconomic variables and school achievement. This implies that average test scores are an intrinsically flawed instrument. For this reason, this study proposes an adjusted measure of school performance. This measure consists of a ratio between current average school scores and expected average school scores, taking into account the reference variables by municipality.
2
I.INTRODUCTION
“Education is a service that transforms fixed quantities of inputs (individuals) into
individuals with different qualities.”(Hanushek, 1986) In fact, education is an extremely powerful mechanism which holds the potential to create opportunities and promote social mobility.
For Gary Becker, education is a way of investing in Human Capital. According to this theory, one can think of education as an investment decision, where current income opportunities are renounced in exchange for improved future income. In light of the Human Capital Theory, education should not be simply seen as a personal benefit (increase in wages), but should also be seen as a way of create social benefit due to the positive externalities associated to it. Consequently government intervention on the educational sector is beneficial and is a potential Pareto improvement.
Many studies have been carried out regarding the factors that influence student achievement and the true contributions of school factors (class size, quality of teachers) and external school factors, namely socioeconomic and cultural factors.
3
The present project explores the main variables that contribute to the explanation of student achievement on Portuguese 9th grade exams. Based on this analysis, it presents an alternative indicator for school performance.
This project addresses these tasks through an empirical analysis based on school‟s 9th
grade exam results in Portugal. There is so far no study like this one that takes up this issue for the 9th grade exams.
This study is especially significant in the Portuguese case, since it is one of the European countries with the highest levels of income inequalities. According to OECD data, the level of inequality in Portugal is only comparable to the level observable in the US, which presents the highest level of inequality in developed countries. (OECD, 2005) Portugal is also one of countries with the highest dropout and failure rate in Europe.
I have found is that an important causal effect between the characteristics of each municipality and school exam results. These characteristics include, but are not limited to, the average per capita income in these municipalities and the education level.
Subsequently, based on these results I propose an alternative and innovative indicator to measure the school performance. The proposed adjusted measure of achievement
consists of the ratio between the school‟s current average score and the expected average score if the school were as successful as the reference variables of the municipality. This indicator allows measuring the true school performance, isolating it from the socioeconomic and cultural factors.
More specifically, I address the following questions: First, I use literature review to ask which are the variables that truly influence student achievement? Additionally, I answer what the implications of relying on school rankings which are based on exam scores as an indicator of the school performance are?
4
and cultural variables are controlled? Fourthly, how does the adjusted measure of school performance compare to school rankings?
The project is divided into seven key sections; including the Introduction in Section I. In Section II, I discuss, based on literature and empirical work, the main variables which explain student achievement and a brief analysis of the implications and the consequent disadvantages of using average test scores to assess school performance. In Section III, I will describe the structure of the Portuguese educational system whilst in Section IV I describe the chosen data and the variables. I also present an econometric model to analyze the impact that internal school and municipality variables (socioeconomic and cultural conditions) have on average school exam scores. In Section V, I present the regression results. In section VI, I develop an adjusted measure of school performance. Lastly, in Section VII, I present my main conclusions and some proposals for further research.
II.LITERATURE REVIEW
The existing literature on academic performance indicators, as regards this analysis, can be broadly grouped into two areas. Firstly, many studies analyze the educational performance indicators, discussing their validity and the main limitations of this measure.
Mancebón and Bandrés 1999, in their study described some features of the educational process that should be take into account regarding the assessment of school performance: i) “the cumulative nature of the educational process”; student achievement is influenced by many factors, namely, the student‟s prior years of education, their socioeconomic background and cognitive skills, ii) the importance of exogenous factors to the school.
“The uniqueness of the educational production process implies that a significant effort
must be made to filter out what is really provided by each school.”
5
average scores on the exams, namely the SAT‟s (Scholastic Aptitude Test), the ACT‟s
(American College Testing program) for United States or PISA for international comparisons. In spite of this, Hanushek (1990) considers that this data is severely limited in the evaluation of school performance. In fact, the use of the average (or median) of this type of test scores has been severely criticized by the literature due to the number of fallacies it contains. Meyer uses simulations to show that this indicator provide a misleading portrait of school specificities of performance for grade levels and its evolution over time, since it is an averaged. Moreover, the author points to the fact that this indicator encourages schools to participate in “cream skimming”, that is, schools tend to invest their efforts on those students who tend to achieve higher tests scores in order to increase the
school‟s performance. Bradley and Taylor (2002) argue that this effect is particularly noteworthy in private schools where processes of selective admissions prevail. Reback 2007, studied the school short-run incentives to improve student´s expected performance, and he found that students perform better than expected when their test score is particularly important for the school accountability rating, since the school support more students in this case. Another form of “cream skimming” was pointed out by Shepard (1991), and consists of retaining students at a given grade level or encouraging low performance students to transfer to another school. Other limitations of exams scores as performance indicator are presented in literature. Ladd (2001) points out that schools with
6
Second, there are studies that address the contribution of student´s individual´s characteristics, their family and neighborhood features for the children´s achievement.
The Coleman Report in 1966 provided strong evidence for the pivotal role of the family background and cultural factors in determining children‟s achievement. A large volume of empirical evidence (Datcher-Loury 1989) has supported this claim.
Many authors have proposed an educational production function to measure the efficiency of school inputs on educational output. The production function compares the educational output (e.g. achievement in tests scores, graduation rates) with a set of inputs. Jerrim and Micklewright (2010) concluded that children have better results when parents spend more time with them developing their skills, and the more educated parents tend to be, the more effective in transmitting the knowledge they are. However, the authors face
many statistical problems with the inclusion of “family income” in their model. Other
authors, namely Strauss and Sawyer (1986) recognize this problem.
In spite of this, researchers such as Becker (1981) and Danziger and Waldfogel (2000), among others, have pinpointed the positive and significant impacts that family income has on student‟s achievement. Families with high economic resources are more likely to produce important inputs for their children‟s development, providing greater educational resources (books), better pre-school child-care and, among other things, children have the possibility to attend private tutoring. This last factor is significant in Portugal, according to Neto-Mendes, Costa and Ventura (2003). Acemoglu and Angrist (1999), found also an important correlation between the average schooling in US and the state wage levels, based on an instrumental variables strategy.
7
families (Astone and McLanahan 1991, others). The causes of this phenomenon remain unclear; one explanation is the economic disadvantages that single–parent families face (Astone and McLanahan, 1994). In terms of family size, there is evidence that larger families tend to spend less time with each individual child (Graaf 1986).
Kalmijn and Kraaykamp (1996) and Graaf, Gaff and Kraaykam (2000), among others, have pointed out that cultural capital is another important variable in explaining student achievement and have incorporated it in their models. The Cultural Capital Theory is related to the socialization process into highbrow activities, such as interest in art and music, museum attendance, and reading. In empirical studies, this variable is generally measured by family reading habits and participation in formal culture (visits to museums, theaters and concerts). However, Povoas (2008) concluded in her project that these variables are not significant in explaining school exam scores.
Many authors have tried to measure the true efficiency of schools and proposed alternative evaluation methods for it. Sampaio (2003) has attempted this in Portuguese secondary schools. Taking into consideration exam results for 2002 in Mathematics, he tries to seperate them from school effects, socioeconomic and cultural impacts as well as
student‟s characteristics. He concludes that schools influence only the prior achievement. Hanushek and Taylor (1990) emphasize that the best school performance indicator is valued-added. However, this measure is extremely difficult to implement since the information required for it is rarely available. This topic will be discussed further in Section V.
III. THE PORTUGUESE EDUCATIONAL SYSTEM AT A GLANCE
3.1. The Educational System
8
schools that are financed by the Government. Both teaching contents and methods are defined by the Ministry of Education at all types of school up to the 12th grade.
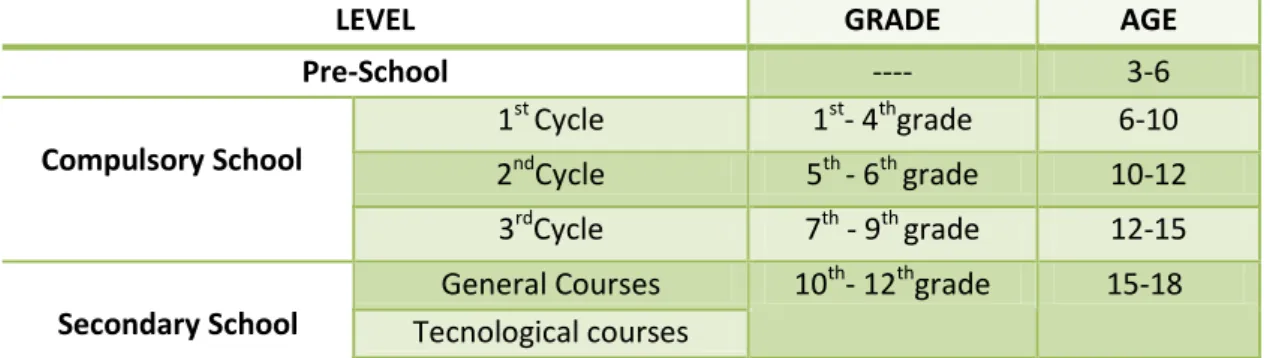
The Educational system is represented in Figure 1, found in the Appendix. In Portugal, pre-primary schooling is not compulsory for children between 3 and 5 years of age. Compulsory school is divided into three main cycles: the first cycle which includes grades 1 to 4 (at the 4th grade, students are required to do provas de aferição); the second cycle which includes the next two grades (at the end of which students are required to do provas de aferição) and finally, the third cycle which lasts 3 years (students are required to do exams in both Portuguese and Mathematics in the 9th grade in order to conclude compulsory school). 1After this basic education, secondary education follows, which is optional. In secondary school, students can opt between general and technological (work-oriented) courses.
As regards public school ownership, first cycle schools are run by the Central Government and belong to the municipalities. Second and Third cycle schools are both run and owned by the Central Government. Public schools are free of charge; however, complementary financial aid is available for all disadvantaged students. According to the Ministry of Education, this financial aid should help support food, accommodation and school materials expenses.
This project focuses only on 3rd cycle education, specifically 9th grade exam results. Note that the ENEB (Exames Nacionais do Ensino Básico) are only mandated for schools on continental Portugal and Madeira.
3.2. Portuguese School Evaluation
In Portugal, legislation was passed in 2002 which permitted self evaluation and external evaluation of schools.
1
9
Despite this effort, there is still no systematic method for evaluating school performance in place. In general, evaluation is based on an informal and simplistic method conducted by newspapers which compute school rankings based on average exam grades. Communication of these rankings for basic schools only began in 2005, based on the school results of 9th grade national exams.
In 2006, the Ministry of Education created a “working group for school evaluation”, with an aim to define models for self and external evaluation in pre-schools, basic and secondary schools. A year later, a department of the General Inspectorate of Education (IGE) was established, to evaluate 100 schools that voluntarily agreed to participate. The IGE evaluates several aspects (e.g. organization and management of the school, leadership, auto-regulation capacity, and results on various levels) and all visited schools received a report stating the weaknesses and strengths of the school as seen by the IGE. This external evaluation has being extended to all schools in Portugal. In Section V I will discuss this subject further.
IV. DISCUSSION
4.1. Methodology and Data
Table1 summarizes the inputs and output variables used in the study.
Inputs Outputs
School related variables School average scores of 9th grade exams Municipality socioeconomic variables
Municipality cultural variables Table 1: Inputs and Outputs
9th grade exam score data is published by the Portuguese Ministry of Education. This data has been published every year since 2005. The last available year is 2010.
10
A cautionary note is advisable before proceeding. At any type of school in a given year, there are two types of students who may take a national exam: internal and external students. Internal students are regular students who take a national exam as a student belonging to that school whereas external students include those who register for exams on an independent basis2.On the other hand, for each exam in a given year, there are two calls. The first call is a compulsory phase that occurs in June and includes all regular students who are automatically enrolled at the school. The second phase is in September and is only for students who have not been able to successfully pass the 9th grade in the first phase. Here, I will only consider the first phase.
As regards inputs, I will examine in more detail the variables and the respective proxies in section 4.2. However, it is important at this point to mention the type and the level of analyses. Unfortunately, in Portugal, there are no historical databases regarding student performance and corresponding family background. Furthermore, the national exam database does not contain information regarding the student‟s prior school results or their socio-cultural background. For this reason, socioeconomic and cultural data is only available at a municipality level.
On the other hand, municipality–level variables are not available on a yearly basis, since the majority of data only pertains to the last census year - 2001. For this reason I do not possess a complete data-panel.
Therefore, I will alternatively use a repeated cross section, where I compare average school grades of a particular year, on that year‟s school-level explanatory variables and socioeconomic and cultural explanatory variables.
2.
11
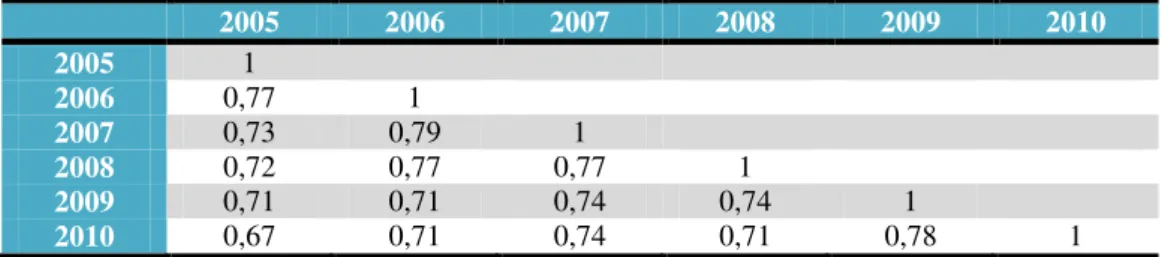
In Table 2 I compute the correlation between average school exams scores (the average score of both exams, Mathematics and Portuguese) for the last six years.
2005 2006 2007 2008 2009 2010
2005 1
2006 0,77 1
2007 0,73 0,79 1
2008 0,72 0,77 0,77 1
2009 0,71 0,71 0,74 0,74 1
2010 0,67 0,71 0,74 0,71 0,78 1
Table 2: Pairwise average score correlation coefficient for the six available years.
Correlation is always positive (values are always greater than 0) and the correlation values vary between 0,67 and 0,79, which is close to 1. School exams scores are quite stable across time: this means that one expects that a school that presents a high exam score in a certain year will continue to exhibit high average scores in the following year. Not surprisingly, the correlation values decrease as one moves further from a given year.
I also analyze the correlation between average scores in nation-wide Portuguese and Mathematics exams; the Pairwise correlation table is shown in the Appendix, table 3.
Again, all correlation values are positive and quite large. Correlations between Portuguese and Mathematics exams scores for the same year are represented diagonally.
As one can see, these values are high, ranging between 0,73 and 0,79, which means that the scores for the exam in Portuguese is extremely interconnected with the Mathematics exam score. Again, the correlation between the two exams scores decreases as the temporal interval between them increases.
12
On the other hand, I have decided to consider the school average score on both exams as a dependent variable, instead of carrying out separate estimates for school scores on Mathematics and Portuguese, since these two variables are also highly correlated.
My sample includes 1374 schools and represents all the schools that participated in the 9th grade exam at least once between 2005 and 2010. In 2005, the number of schools is only 1237. In Table 4, in the Appendix, I demonstrate the relationship between the number of schools and the municipalities. Note that the Azores, due to its independent status, decided not to participate in the 9th grade national exams. For this reason, I will only consider 289 municipalities even though Portugal has 308. All the considered municipalities have at least one basic school that participated in the 9th grade exam. There is no potential source of bias, as occurs in the case of secondary schools (Povoas 2008)3.Table 5 and 6 summarize the relation between the number of private school and PFPRIV and the municipalities. Through these tables, one can conclude that Private and State-funded Private Schools are concentrated in 45 and 49 municipalities respectively and that the remaining 84% of municipalities in Portugal do not possess any Private schools. Lisbon and Oporto alone have more than 11 Private schools.
4.2. Empirical Model and Variables
Ideally, my objective here would be to explain school exam scores through individual
characteristics, family background (parents‟ income, school variables (infrastructures,
teachers‟ quality, peer effect) and socioeconomic variables that affect the neighborhood. Unfortunately, individual and family background data is not available in Portugal and even school-level data is scarce, as mentioned above.4
3
. There is no occurrence of bias in this sample due to the fact that all municipalities have at least one basic school, and therefore all the students‟ socioeconomic backgrounds are taken into account. On the other hand, all schools are included in this analysis, even those with a lower number of students, whereas these schools are not generally taken into account in newspaper ranking.
4
13
In table 7 in the Appendix, I describe the variables used in this project and their sources. Therefore, my strategy will be to link average academic scores in 9th grade exams to socioeconomic and cultural variables, that is, match each school to the corresponding socioeconomic and cultural variables of its municipality.
This methodology is justified by the governmental school allocation rule. In Portuguese Public Schools students are allocated according to their place of residence or, alternatively, to where their parents‟ workplace is located. According to this criterion, students should be allocated to the nearest school to their residence, e.g. the school in their municipality, or alternatively, in some cases, to their parent´s workplace. For this reason, I shall use the municipal-level data as a proxy for students‟ socioeconomic background.
The main specification that I estimate is as follows:
Where S refers to the school and M to the municipality where it is located. The dependant variable, Ys, refers to the average academic score in 9th grade exams; in terms of the explanatory variables Table 7 presents the definition, source and year of each variable and Table 8 presents the main descriptive statistics.
Now, I will present and justify the main variables and respective proxies.
Municipality Income: The variable INCM stands for municipality income. Many authors have included the relationship between educational outcomes and family income in their research (e.g. Blanden and Machin, 2004), and numerous studies have documented a positive relation between parents‟ income and the school. There is also a conviction that wealthier regions are relatively prosperous. I take into consideration four alternative proxies: Purchasing Power (PPM); Proportion Purchasing Power (PPPM)5;
5.
14
Unemployment Rate (UNEMM) and monthly average income (AVERAGEINCM). In terms of signs, I expect a positive sign for PPM, PPPM and AVERAGEINCM and a negative sign for UNEMM.
Municipality Education: in the specification, municipality education is represented by the variable EDUM. In order to be successful, children require a certain amount of human resources provision; the importance of these factors were shown by Murnane, Maynard and Ohls (1981) among others, which compare the impact of “human resources” with the
15
Municipality culture: CultM stands for cultural capital. Graaf (2000), measures the cultural resources by taking into account the family‟s reading habits and its participation in formal culture. “Reading habits are measured by the number of hours per week parents spend reading and by the number of visits to libraries. Participation in culture is
measured by the number of visits parents make per month to museums, theaters or
concerts.” I have only taken into account formal culture as a measure in cultural capital. To reflect this effect, I have introduced a proxy MONUM that stands for the number of monuments per resident and ICULTM, the cultural infrastructures per resident in each municipality. I also consider a proxy to reflect investment in culture: the amount of per capita cultural expenditures in the municipality (EXPCULM). One would expect that a more culture-friendly municipality would stimulate students and increase their academic results. I therefore expect a positive sign.
Municipality Demography: In the regression, DEMM refers to the demography variable. Póvoas (2008) in her project called attention to the fact that educational variables are dependent on the demographic structure of the population in each given municipality, particularly MANDM and ILLITM, as well as some cultural variables. For this reason, I have included some demography proxies, for instance OLDM, to control the percentage of resident population in a given municipality which is over 65 years old and the average age in the municipality (AVRGAGEM). In my regression I include an immigration variable, the percentage of foreign people residing in the municipality (FOREIGNM). Unfortunately, there is no available data according to race. On the other hand, numerous studies have shown that children from single parent families are at a disadvantage as regards academic results compared with two-parent families.6 Therefore I have also included a variable to represent the impact of single parent families (SINGLEM). Ihave complemented the analysis introducing one variable for family size, the percentage of 6.
16
families with more than 3 children (CHILDREN_3M). It is believed that families with many children tend to spend less time with each individual child as compared with families with only one child.
Municipality quality of life: The variable BUILDM stands for the average age of buildings in a given municipality. This variable reflects quality of life, insofar as new buildings would be better suited to today‟s needs. The age of buildings could also be a proxy which corresponds to regional economic dynamics, since places with new buildings receive more investment. The expected coefficient sign is ambiguous. On the one hand, one would a negative sign due to the regional economic dynamics that are lower in regions where buildings are older. But on the other hand, cities have the oldest buildings, so the proxy may also reflect the economic and demographic dynamics in the cities, which would then lead us to expect a positive sign.
Municipality Social Capital: The variable SOCIALCAPM refers to the Social Capital. Coleman introduces a new type of capital: Social Capital. According to his study, this type of capital has important effects on child wellbeing, particularly educational achievement and the adoption of new technologies by society. Many researchers have included this variable in their studies, in order to reflect citizenship. I will try two proxies: the abstention rate in local municipal elections (VOTEM) and the percentage of recycle residues per resident (RECYM). In terms of coefficient signs one might expect a negative sign VOTEM and a positive sign for RECYCLEM.
School variables: Krueger (1999) emphasized the importance of class size and the fact that student achievement increases in small classes, this beneficial effect persists throughout one‟s life, and the probability to attend university is higher. Hoxby 2000, studied the effect of class size on student achievement using longitudinal variation in the population associated to each grade in 649 schools elementary school. However her
17
student‟s scores. Unfortunately, there is no available data in terms of class size, so, alternatively, I will use the number of exams per school (EXAMSs) as a proxy for school dimension. A bigger school may have economies of scale (Povoas 2008), it may have more specialized teachers with longer teaching experience in preparing students for the exams. On the other hand, in small schools, teachers could be forced to teach several subjects which could have a negative impact on the children‟s achievement. However, in smaller schools teachers sometimes have the ability to give more attention to each student, resulting in a more familiar environment (not necessarily a higher teacher/pupil ratio), which would increase average school grades. Therefore the EXAMSM coefficient sign is ambiguous. I have also considered a variable which takes into account the teacher/pupil ratio: the percentage of 3rd cycle and secondary teachers relative to the number of 3rd cycle and secondary students. Unfortunately, this variable is only available for NUTIII, I have, nevertheless, decided to include it since it proved to be significant in the estimations. Many authors suggest the existence of a gender gap, which is evident in exam scores, and is explained due to the greater effort exerted by female students. I include the percentage of female participation in 9th grade exams per school (GIRLS) as a proxy of gender, and the percentage of students under 16 participating in 9th grade exams per school (AGEs), as a proxy of age. Please note that students who are over 16 in 9th grade exams signify that these students have stayed back at least one year. In terms of signs, one expects a positive sign for GIRLS and for AGE .7 In Portugal there are three types of schools. I will therefore consider two dummies PUBS and PFPRIVS. The dummy PUBS is equal to 1 if it is a public school and 0 otherwise. The dummy PFPRIVS is equal to 1 if it is a State-funded private school and 0 otherwise. For PUBS and PFPRIVs one expects a negative sign. Private schools are characterized by either wealthier or more able individuals who wish 7
18
to invest additional resources in education besides that which is guaranteed by the state. Obviously this dummy reflects other aspects, namely, the differences of school environments and the peer effect. According to Zimmerman (1999) and others, private schools are expected to be more organized, since they are smaller than public ones and have a higher financial autonomy as compared with the Central Government. Additionally, the existence of peer effects that aid in the creation of a different “academic
environment” and “social units” which may have a positive impact on academic results. Hoby 2000 analyzes the impact of gender and race on class performance. She concluded that peer effect are relevant, and having peers that score 1 point higher increase an
individual‟s score by 0,10 to 0,55. This effect is stronger intra-race and a more female peer group increases achievement. I include the variable COMPETD, which corresponds to the number of schools per resident. This variable aims to measure the impact of competition between the schools in each district. There is a continuous claim that increased competition between schools increase levels of student achievement (e.g. Ponzo
2010). “Moreover, many authors show that students achieve much better outcomes if
schools operating in more competitive environments also experience a higher pressure on
academic standards coming from parents”. Hence, one expects a positive sign.
In order to cross-check the analysis, other controls are used relative to the selected regressions. I include regional dummies in the regression, which allows me to check whether there are persisting regional effects, even controlling for socioeconomic factors. I cross-check this analysis by using average 9th grade exam scores in schools as dependent variable between 2005 and 2010 for both exams (Mathematics and Portuguese) together and also separately.
V. RESULTS
19
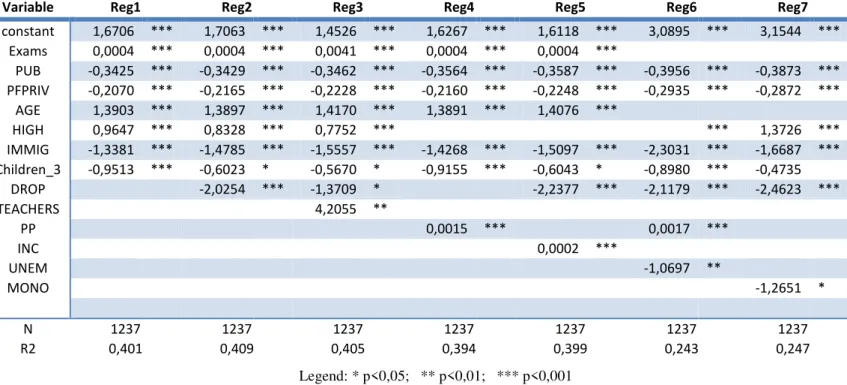
corresponds to the baseline specification. (Consult Statistical and econometric considerations in Appendix)
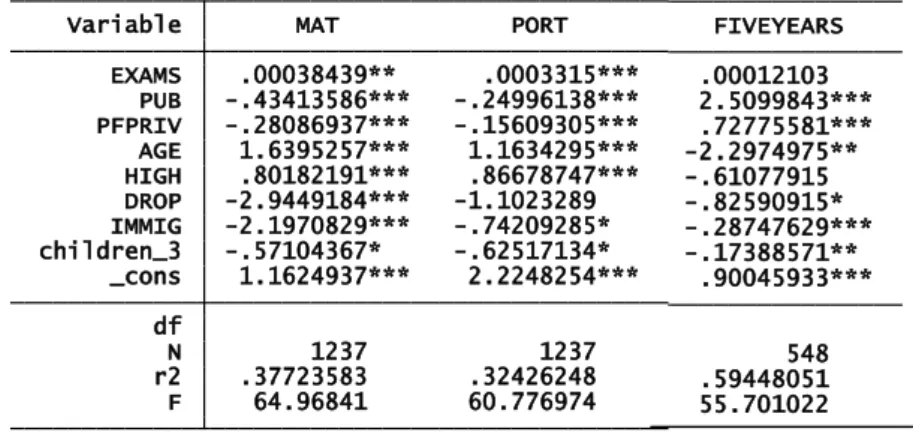
As was explained above I choose PPM as a proxy for income, this variable always presents positive coefficients, and is more significant than PPPM. As one can see in column 5, the variable INCM is also a significant variable, however the coefficient value is PPM, an increase of 1 percentage point in municipality average income increases by only 0,0002% the school average grade. Although unemployment has always had negative coefficients, the amounts are not significant. It is therefore not possible to ensure that schools located in municipalities with a low rate of unemployment have better results, ceteris paribus.
In terms of the educational variables, MANDM and HIGHERM variables have always presented positive and significant coefficients. In spite of this, HIGHERM has a much higher coefficient, meaning that the percentages of residents in each municipality who have attended higher education have a greater influence exam results then the percentage of people who have only attended compulsory education. For this reason, and in order to
Variable Reg1 Reg2 Reg3 Reg4 Reg5 Reg6 Reg7
constant 1,6706 *** 1,7063 *** 1,4526 *** 1,6267 *** 1,6118 *** 3,0895 *** 3,1544 *** Exams 0,0004 *** 0,0004 *** 0,0041 *** 0,0004 *** 0,0004 ***
PUB -0,3425 *** -0,3429 *** -0,3462 *** -0,3564 *** -0,3587 *** -0,3956 *** -0,3873 *** PFPRIV -0,2070 *** -0,2165 *** -0,2228 *** -0,2160 *** -0,2248 *** -0,2935 *** -0,2872 ***
AGE 1,3903 *** 1,3897 *** 1,4170 *** 1,3891 *** 1,4076 ***
HIGH 0,9647 *** 0,8328 *** 0,7752 *** *** 1,3726 ***
IMMIG -1,3381 *** -1,4785 *** -1,5557 *** -1,4268 *** -1,5097 *** -2,3031 *** -1,6687 *** Children_3 -0,9513 *** -0,6023 * -0,5670 * -0,9155 *** -0,6043 * -0,8980 *** -0,4735
DROP -2,0254 *** -1,3709 * -2,2377 *** -2,1179 *** -2,4623 ***
TEACHERS 4,2055 **
PP 0,0015 *** 0,0017 ***
INC 0,0002 ***
UNEM -1,0697 **
MONO -1,2651 *
N 1237 1237 1237 1237 1237 1237 1237
R2 0,401 0,409 0,405 0,394 0,399 0,243 0,247
Table 9: Baseline Specification and other regressions.
20
avoid a multicollinearity problem in my baseline specification, I have decided to apply the HIGHERM. The level of illiteracy in each municipality doesn´t has any effect on exams score. The dropout variable is significant and presents a negative coefficient, which means that municipalities with high drop-out rates negatively influence average scores, that is, schools located in regions where there is a lower quality educational background present poorer results. I have tried to apply the PPM and the HIGHM together; however, this undermines the income variable. This occurs because these two variables are correlated.8
As regards school variables, the GENDERs variable is not significant, meaning that in our model gender does not affect the school‟s average exam scores. I have introduced two dummies to reflect the type of school; the reference category is Private school. As expected, Public schools and State-funded Private schools do worse than private ones, since the two dummies present both negative coefficients. Please note that public schools present poorer results than state-funded public schools. Unfortunately, upon only these regressions it is impossible to calculate whether this effect is due to the positive link between private schools and privileged socioeconomic backgrounds or to school differences, such as organization or peer effect.
The variable EXAMSS reflect the number of students per school in the 9th grade, this variable is significant and the coefficient is positive. This means that bigger schools have better results than smaller ones. This can be explained by the fact that teacher‟s experience in preparing students for the exams and the levels of teacher specialization is higher in bigger schools. On the other hand, the economies of scale and the spillovers due to
student‟s mix characteristics may offset the fact that, at small schools, there may be a more familiar environment. In spite of this, I cannot reject the possibility that a better 8.
21
school attracts more students and not otherwise, (the school is better due to the fact that it is bigger).
Parents may decide to send their children to better schools which, in turn, will increase their number of students. This effect could create a problem of endogeneity. This effect, however, is quite limited for public schools in Portugal due to the student allocation rule which states that students be allocated to the nearest school.
The proxy AGES reflects the percentage of students who have never stayed back. As a general rule, better schools present lower percentages, therefore, this variable tends to be close to 1. The variable teachersM, corresponds to the number of teachers per student. This variable is only available in terms of NUTIII, although it is a significant variable, and the coefficient is positive and high.
With regards to the competition between schools, I have introduced variable ratioM, the ratio between the number of private schools and public schools in each municipality. However this variable is not significant, this occurs due to the low number of municipalities with private schools (Section 4.1).
In terms of the cultural variables I have applied EXPCULM, this variable is not significant, which means that according to our model, the expenditures in culture per municipality does not have an impact on the students‟ grades. Despite this fact, it is not possible to conclude, based simply on this data, that diversity in cultural infrastructures does not have an influence on student achievement. We are only able to capture the investment per municipality in 2001.
22
means that when families have more than 3 children there is a negative impact on the average exam results. The percentage of immigrants per municipality is also a significant variable. The coefficient is negative, which implies that municipalities with many immigrants have a negative influence on the student´s exams scores. In reality, immigrants tend to work lower-paying jobs and, in some cases, students have to deal with the language barrier which makes the learning processincreasingly difficult. In spite of this, this variable can be a proxy of the neighborhood environment. Some groups of immigrants tend to live in poorer neighborhoods.
In order to consider citizenship, I have introduced the variable VOTEM, which is also not statistically significant. The variable BUILDM has a negative sign and occurs because regional economic dynamics are lower in regions where buildings are older.
To cross-check, I have done a regression using the school average in Mathematics and Portuguese exams and the school average for the exams from 2005 to 2010 as dependent variables. The results of these regressions are presented in Table 10 in the Appendix.
5.2. Regional Differences
In this section I have introduced Regional dummies in my baseline specification (Reg2). The regional variable allows me to check whether regional effects still persist even after controlling for socioeconomic variables. For this purpose, I have used the NUT II regional division of the Portuguese territory. There are seven NUTII regions in Portugal: Norte, Centro, Lisboa, Alentejo, Algarve, Azores and Madeira. However, I consider only six regions since the Azores did not participate in 9th grade exams. For this reason, I have considered five dummies and the omitted variable is Centro.
23
Unfortunately, although the variables Alentejo and Madeira present a negative coefficient, these variables are not significant and as such one cannot make any conclusion about these regions. The schools located in Alentejo, followed by schools located in Lisboa are the ones that, on average, have a better performance than those in Centro considering only the significant variables.
In terms of the other variables, they maintain the same sign, however, as one can see when I included the regional dummies in the baseline specification, the DROP variable is no longer statistically significant. For this reason, I have presented the same regression without DROPM in Column 1 (reg8). The results are very similar to the previous specification and the adjusted R-squared is also similar.
The asymmetries between the regions can be explained by natural conditions or historical reasons that influence the educational structure and environment. It may also result from reinforcing forces that attract more people, more and better students and teachers, further reinforcing the attractiveness of the region. On the other hand, immigration could be another explanation, in fact, there are asymmetries between the number of immigrants throughout the regions; immigrants tend to concentrate more on bigger cities such as Lisboa and Porto and in the Algarve region. Another explanation is region labor market dynamics. The Portuguese labor market is characterized by tough models of employment protection and a low dynamic, in terms of job creation and job extinction, which limit worker flows between jobs. Portugal and Blanchard (2001), characterize the Portuguese labor market as a market with “very low labor mobility”,
24
VI.ALTERNATIVE SCHOOL MEASURE
The use of the average exam scores as a measure of school quality presents many limitations as has been pointed out above. In this section, I will analyze an alternative measure for school quality.
6.1. The AGES variable
In analyzing school quality one can consider three types of variables: Socio-economic and cultural variables, namely family background and neighborhood; school related variables, such as peer effects, class size and student/teacher ratios and the output variables, such as students‟ average scores. The first two types of variables can be considered as input variables. When analyzing school output variables, the most evident is average exam scores. The AGE variable, however, (percentage of students under 16) can also be interpreted as a school output variable. In fact, this variable is a proxy of the percentage of the students that had never stayed backbefore the 9th grade. (consult table 12 in the Appendix, the regression as dependant variable AGE)
I decided not to exclude the variable AGE of the baseline specification, although I am aware of the possibility that this variable can also be considered an output. I used the Ramsey RESET test to analyze the existence of omitted variables on the baseline specification with the AGE variable and on the model which does not include the AGE variable. In the specification without AGE there is evidence for omitted variables. On the other hand, upon application of AGE to the baseline specification, I do not reject the null hypotheses. For this reason, I have decided to keep the variable AGE and to use reg 2 as my baseline specification.
6.2. Adjusted Measure of School Performance
25
reg2). This indicator enables us to measure school performance using socio-economic and cultural variables. If a school has a ratio equal to one, this means that average school scores are equal to the expected ones, taking into account the municipality features and the school characteristics. On the other hand, if a school has a ratio higher than one, this school has an average exam score which is better than the predicted one, based on the municipality and school conditions. For this reason, these schools are considered to be successful. In cases where schools present a ratio lower than 1 the opposite occurs.
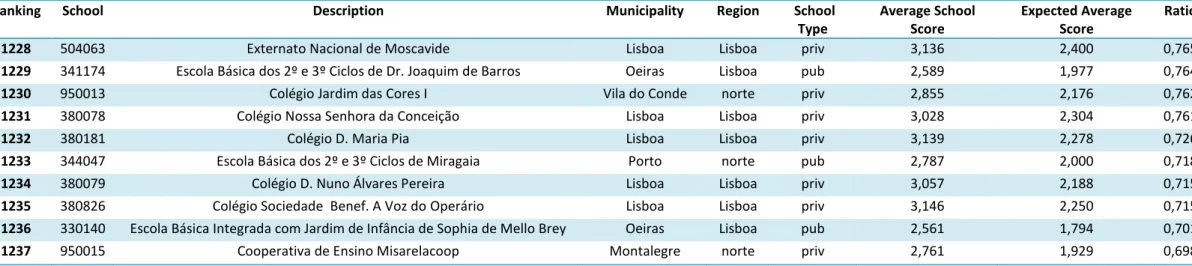
Based on the ratio results, it is possible to construct a ranking, where the schools with the highest ratio are in the top.
I constructed this adjusted school measure for 2005, based on 9th grade exams scores. Firstly, I determined the expected average school score, replacing the specific school values on the baseline specification, regression reg2. I then computed the ratio:
Table 13, in the Appendix presents the summary statistics for these variables.
1
.5
2
2
.5
3
3
.5
4
1.5 2 2.5 3 3.5
Estimated School Average Score GRADES Fitted values
26
Graph1 summarizes each school result. On the graph it is represented by the 45° line and the scatter plot corresponding to all school observations. If the observation is on the 45°line this means that the school average score is equal to the expected one, and in this case the ratio is 1. On the other hand, if the observation is above the 45° line, the adjusted score ratio is higher than 1. As expected, the plots are concentrated in the middle section of the graph and are slightly skewed to the right, since the expected school exams scores range between 1,59 and 3,29 and average 2,64.
In terms of schools, those presenting higher adjusted score ratios are located in Machico (Madeira), Alijó (Norte), Braga (Norte) and Aveiro (Centro), respectively and all of them are Public schools. The worst ones are located in Montalegre (Norte), Oeiras (Lisboa) and Lisboa (Lisboa) respectively, two of them are private. Consult Table 14 and 15 in the Appendix with the raking based on adjusted score ratio.
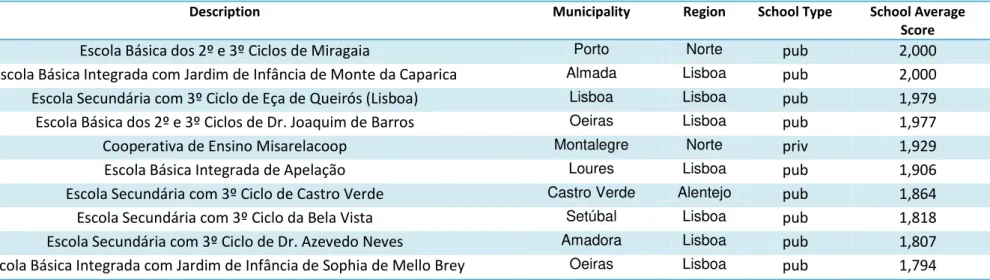
I have compared this ranking with the traditional ranking published in newspapers which are based on average exam results. In the Appendix I have constructed the tables 16 and 17 in relation to the top ten school rankings according to average school scores in exams and the ranking for the ten worst schools.
In terms of schools, the ones with the ten highest average score on the exams are all located in Grande Lisboa and Grande Porto, and only two of them are public. The majority of the ten worst schools are also located in Grande Lisboa e Grande Porto, and nine schools are public.
27
However, despite these differences, the correlation between the school positions in both rankings are positive and relatively high- approximately 0,89.
I have also analyzed each region separately; consult Graphs 2 to 7 in the Appendix. Proportionately, the Norte is the region with more schools with an adjusted score ratio lower than 1, in fact, the majority of schools in this region are concentrated below the 45° line. On the other hand, Centro is the region where, proportionally, schools ratios are more concentrated around 1.
VII.CONCLUSION
The typical indicator used to assess school performance is the average and median achievement test scores. This indicator, however, is subject to controversy. Hanushesk (1990) considers it extremely limited in its evaluation of school performance. In fact, this indicator suffers from three main inefficiencies: it creates incentives for school cream skimming; it fails to take into account past student performance and does not reflect the individual socioeconomic context of the school.
The first aim of this project is to estimate the importance of these external factors in school achievement. The study provides confirmation for existing theories about the ways in which family structure, income and education influence school performance. In fact, a community with a lower percentage of families with more than three children, and a higher percentage of residents with higher education, positively affects school achievement. The results also suggest that smaller schools, Public or State-funded Private schools and low regional teacher/student ratios negatively influence school scores. The cultural variables are, on the most part, irrelevant. Furthermore, regional effects still persist after socioeconomic and cultural variables are controlled. These effects are justified by natural or historical reasons and labor market dynamics.
28
scores and the expected average school scores if the school was as successful as the reference variables of the municipality. This indicator has the added advantage of potentially eliminating the bias that exists in average school scores due to the socioeconomic and cultural variables and could eradicate incentives to cream-skimming.
The main limitations of this study are the nonexistence of a complete dataset for student´s and parent´s level. The existences of it may allow developing a more significant model with a higher R squared. On the other hand, one important missing variable on the analysis is the past student performance, again there is no available data.
29 REFERENCES
Acemoglu, Daron and Angrist, Joshua. 1999. "How Large are the Social Returns to Education? Evidence from Compulsory Schooling Laws," NBER Working papers 99-30, Massachusetts Institute of Technology (MIT), Department of Economics.
Astone, N.M., & McLanahan, S.S.. 1991. “Family structure, parental practices and high
school completion.” American Sociological Review, 56, 309-302.
Astone and McLanahan. 1994.“Family structure, residential mobility, and school
dropout: a research note”,Demography 31, pp. 575–584
Becker, G.. 1981 (revised and enlarged in 1991) “A treatise on family”, Harvard university press, pp. 93-112.
Becker, G.. 1984. “Human Capital- A theoretical and empirical Analysis with special
reference to education”, The University of Chicago Press, third edition
Blanchard, Olivier and Portugal, Pedro. 1998. "What Hides Behind an Unemployment Rate: Comparing Portuguese and U.S. Unemployment," NBER Working Papers 6636,
National Bureau of Economic Research, Inc.
Blanden, J. and S. Machin. 2004. “Educational Inequality and the Expansion of UK
Higher Education”, Scottish Journal of Political Economy, 51, 230-249.
Bradley & J Taylor. 2002. "The Effect of School Size on Exam Performance in Secondary Schools," Working Papers”, Department of Economics, University of Lancaster.
Carneiro, P.. 2006. “Equality of opportunity and educational achievement in Portugal”, 3 Conferência do Banco de Portugal - Desenvolvimento Económico Português no Espaço Europeu
Costa, Jorge Adelino, Ventura, Alexandreand Neto-Mendes, António. 2003. “As explicações no 12º ano: contributos para o conhecimento de uma actividade na
sombra”.Revista Portuguesa de Investigação Educacional nº 2, Universidade Católica Portuguesa. 55-68.
Dronkers, Pong, S. -L. and Hampden-Thompson, G.. 2003. “Family policies and children's school achievement in single- versus two-parent families.”Journal of Marriage and the Family 65, pp. 681-699.
Danziger, S. and Waldfogel, J.. 2000. “Investing in children: what do we know? What
should we do?” London School of Economics, Centre for Analysis of Social Exclusion,
30
Datcher-Loury, Linda. 1989. "Family Background and School Achievement among Low Income Blacks" Journal of Human Resources, University of Wisconsin Press, vol. 24(3), pages 528-544
Graaf P. M.. 1986. “The Impact of Financial and Cultural Resources on Educational
Attainment in the Netherlands”, Sociology of Education, Vol. 59, 4 237-246
Graaf, N., De Graff, P., & Kraaykamp, G.. 2000. “Parental cultural capital and educational attainment in the Netherlands: A refinement of the cultural capital
perspective.” Sociology of Education, 73, 92-111.
Gibbons, Steve & Machin, Stephen. 2003. "Valuing English primary schools," Journal of Urban Economics, Elsevier, vol. 53(2), pages 197-219.
Goldstein, H. and Spiegelhalter, D. J..1996. “League tables and their limitations:
statistical issues in comparisons of institutional performance.” Journal of the Royal Statistical Society: Series A, 159, 385-443.
Hanushek , Eric A.. 1986. "The economics of schooling," Journal of Economic Literature, 49(3), . pp. 1141-1177
Hanushek, E. and Taylor, L. L.. 1990. “Alternative Assessments of the Performance of Schools: Measurement of State Variations in Achievement”, Journal of Human Resources,Volume 25, 179-201
Hoxby, C.. 2000. “Peer effects in the classroom: Learning from gender and race variation.” NBER Working Paper No 7867.
Hoxby, C.. 2000. “The effects of class size on student achievement: New evidence from population variation”. Quarterly Journal of Economics, 115(4):1239–1285.
Jerrim, J. and Micklewright, J.. 2010. “Children‟s education and parents
socio-economic status: distinguishing the impact of mothers and fathers”, Institute of Education, University of London
Krueger, Alan B.. 1999. "Experimental Estimates of Education Production Functions," The Quarterly Journal of Economics, MIT Press, vol. 114(2), pages 497-532
Ladd, H. F.. 2001. “Schools-based educational accountability systems: the promise and
the pitfalls”, National Tax Journal, Vol. 54 385-400
31
Meyer R. H.. 1995. “Educational Performance Indicators: A critique”, Institute for Research on Poverty Discussion Papers.
McLanahan Sara and Sandefur Gary. 1994. “Growing Up with a Single Parent: What
Hurts, What Helps.” Cambridge: Harvard University Press.
McNab, C. & Murray, A.. 1985. “Family Composition and Mathematics Achievement”,
Scandinavian Journal of Educational Research, 29, 89-102
Murnane, R. J., Maynard, R. A. and Ohls, J. C.. 1981. “Home Resources and Children's Achievement2, Review of Economics and Statistics, Vol. 63, No. 3 369-377
Murray, A., & Sandqvist, K.. 1990. “Father absence and children's achievement from age 13 to 21”, Scandinavian Journal of Educational Research, 34, 3-28.
Ponzo, Michela. 2009. "The Effects Of School Competition On The Achievement Of Italian Students," Working Papers 200920, Università della Calabria, Dipartimento di Economia e Statistica.
Povoas, Inês. 2008. “A critical assessment of the Portuguese secondary school rankings”, Work Project, Faculdade de Economia da Universidade Nova de Lisboa
Reback, Randall. 2006. “Teaching to the Rating: School Accountability and the Distribution of Student Achievement," Journal of Public Economics Working Papers 0602, Barnard College, Department of Economics.
Sampaio, “Eficiência dos Estabelecimentos de Ensino Secundário Portugueses”,
Investigação dirigida em Economia 2002/2003, Faculdade de Economia - Universidade Nova de Lisboa
Shepard, L. A.. 1991 “The influence of standardized tests on the early childhood
curriculum, teachers, and children”,Yearbook in Early Childhood Education (Vol. 2, pp. 166-189). New York: Teachers College Press.
Strauss, Robert P. & Sawyer, Elizabeth A.. 1986. "Some new evidence on teacher and student competencies," Economics of Education Review, Elsevier, vol. 5(1), pages 41-48, February.
Zimmerman D. J.. 1999. “Peer effects in academic outcomes: evidence from a natural
32
STATISTICAL AND ECONOMETRIC CONSIDERATIONS APPENDIX
In terms of the multicolinerity, there could be evidence of it. This problem could occur if the correlation between the two variables is too high. This may lead to unreliable estimates with standard errors and unexpected signs or magnitudes.
Table 24: Correlations between the municipality income variables
I present three proxies of municipality income (Purchasing power; proportion of the purchasing power and municipality monthly average income). These three variables are positively correlated, with correlation coefficients higher or equal to 0,8, making it redundant to include the three variables. For this reason, I have decided to only include Purchasing Power. The Purchasing Power variable reflects the wealth of the municipality. Because schools from all municipalities have been included, it is not necessary to use a variable that accounts for each municipality wealth as compared with the total wealth in Portugal, such as PPPM (Proportion of the purchasing power). Thus, in the baseline specification I have used PPM, the other two proxies (PPPM and AVERAGEINCM) are used to cross-check.
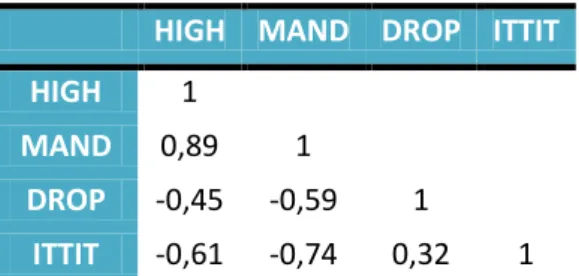
HIGH MAND DROP ITTIT
HIGH 1
MAND 0,89 1
DROP -0,45 -0,59 1
ITTIT -0,61 -0,74 0,32 1
Table 25: Pairwise Correlations between Educational variables
In Table 22 one can see that municipality education proxies are also extremely correlated. I run regressions using only a subsample of education-related variables.
PPPM PPM AVERAGEINCM
PPPM 1
PPM 0,82 1
33
The multicollinearity problem could lead to underestimated coefficients and t-statistics, so that it would be difficult to access their impact on the grades of 2005. I have therefore decided to apply the _rmcoll command in Stata to check the existence of multicollinearity on the baseline consideration, and there is no evidence of multicollinearity.
The used data is extremely heterogeneous, for instance, the proxies for income vary significantly from municipality to municipality, and the impact in grades in wealthier municipalities will empirically be very different. There is therefore a suspicion of heteroscedasticity. The presence of heteroscedasticity implies the violation of constant error variance, one of the Gauss Markov assumptions. Even if it neither causes bias nor
inconsistency of OLS estimators, the estimators‟ variances are no longer valid, nor are there conclusions about the statistical significance of the OLS estimates based on t-statistics. To evaluate the presence of heteroscedasticity I have applied the Breush-Pagan test. This method tests the null hypothesis that error variances are all equal versus the alternative that error variances are, in fact, a multiplicative function of one or more variables. A large chi-square would indicate that heteroskedasticity was present. The results for the baseline specification are presented below:
Breusch-Pagan / Cook-Weisberg test for heteroskedasticity Ho: Constant variance
Variables: fitted values of GRADES chi2(1) = 57.02
Prob > chi2 = 0.0000
34
Some socio-economic and cultural variables are unobserved on conventional data, such
as parent‟s ability. This unobservable data can create a bias on estimation. I therefore use a
wide range of proxies, in such a way as to, according to Coulon, Meschi, Vignones and
others, eliminate evidence of omitted variables. To confirm this statement, I decided to do
the Ramsey RESET test to check the existence of omissions in the baseline specification.
As expected, there was no evidence of omitted variables
Ramsey RESET test using powers of the fitted values of GRADES
Ho: model has no omitted variables
F(3, 1224) = 19.17
Prob > F = 0.0000
T
ABLES AND GRAPHSA
PPENDIXTable 3: Pairwise average score between the exams for the six years.
LEVEL GRADE AGE
Pre-School ---- 3-6
Compulsory School
1st Cycle 1st- 4thgrade 6-10 2ndCycle 5th - 6th grade 10-12 3rdCycle 7th - 9th grade 12-15
Secondary School
General Courses 10th- 12thgrade 15-18 Tecnological courses
2005 mat 2006 mat 2007 mat 2008 mat 2009 mat 2010 mat
2005 port 0,73 0,63 0,57 0,64 0,56 0,51
2006 port 0,64 0,76 0,64 0,63 0,55 0,55
2007 port 0,63 0,67 0,74 0,65 0,58 0,58
2008 port 0,62 0,66 0,7 0,72 0,6 0,6
2009 port 0,63 0,66 0,65 0,63 0,76 0,65
2010 port 0,62 0,67 0,66 0,64 0,65 0,79
35
Table 4: Relation between the number of schools and municipalities
Table 5: Relation between the number of Private schools and municipalities Number of schools Total number Percentage of Cumulative percentage
per municipality of municipalities total municipalities of total municipalities
0 0 0,0% 0,0%
1 90 31,1% 31,1%
2 49 17,0% 48,1%
3 42 14,5% 62,6%
4 18 6,2% 68,9%
5 19 6,6% 75,4%
6 16 5,5% 81,0%
7 11 3,8% 84,8%
8 7 2,4% 87,2%
9 6 2,1% 89,3%
> 10 31 10,7% 100,0%
Total 289 100,0%
Number of schools PRIV per municipality
Total number of Municipalities PRIV
Percentage of total municipalities
Cumulative percentage of total municipalities
0 244 84,4% 84,4%
1 31 10,7% 95,2%
2 4 1,4% 96,5%
3 5 1,7% 98,3%
4 2 0,7% 99,0%
5 0 0,0% 99,0%
6 0 0,0% 99,0%
7 0 0,0% 99,0%
8 0 0,0% 99,0%
9 0 0,0% 99,0%
10 1 0,3% 99,3%
>11 2 0,7% 100,0%
Total 289 100,0%
Number of schools PFRIV per municipality
Total number of Municipalities PFRIV
Percentage of total municipalities
Cumulative percentage of total municipalities
0 240 83,0% 83,0%
1 36 12,5% 95,5%
2 7 2,4% 97,9%
3 3 1,0% 99,0%
4 1 0,3% 99,3%
5 1 0,3% 99,7%
6 0 0,0% 99,7%
7 0 0,0% 99,7%
8 0 0,0% 99,7%
9 1 0,3% 100,0%
Total 289 100,0%
Variables Source Year Description
Grades GRADE Ministry of Education
2005-2010 Average school grades in 9th grade exams
Purchasing Power PP National Institute of Statistics
2005-2007
Municipal Proportion of Purchasing Power PPP National Institute of Statistics
2005-2007 Percentage of total purchasing power per municipality
Income Monthly average income INC National Institute of Statistics 2001 Percentage of total purchasing power in that municipality
Unemployment rate UNEM National Institute of Statistics 2001 Unemployed population in the broad sense /
Total active population in the broad sense
Percentage of people that
HIGH National Institute of Statistics 2001 Resident population that completed high education/
completed higher education Resident population
Percentage of people having completed compulsory education at
least MAND National Institute of Statistics 2001
Resident population that have completed compulsory school/
Resident population
Municipal
Dropout rate DROP National Institute of Statistics 2001
People that did not complete the 9th grade
Education from the resident population of 10-15 years of age /
Resident population of 10-15 years of age
Illiteracy Rate ILLIT National Institute of Statistics 2001
Resident population that cannot read or write
over 10 years of age /
Resident population over 10 years of age
Amount of cultural expenditures
EXPCUL National Institute of Statistics
2005-2009
Cultural expenditures in thousand Euros/
per resident Resident population
Municipal
Cultural infrastructures per resident MONU National Institute of Statistics 2005 Total number of monuments in the municipality/
Culture Total resident population in the municipality
Number of cultural infrastructure
ICULT National Institute of Statistics 2005 Total number of cultural infrastructures/
per resident Total resident population in the municipality
Percentage of people with
OLD National Institute of Statistics 2001 Resident Population with 65 years of age or more/
65 years of age or more (Total resident population in the municipality)
Average age AVRGAGE National Institute of Statistics 2001 Average age of resident population per municipality
Municipal
Single-Parent families MONO National Institute of Statistics 2001 Total number of single-parents families/
Demography Total number of families in the municipality
Percentage of immigrants IMMIG National Institute of Statistics 2001 Resident population with foreign nationality/
Total resident population in the municipality
Percentage of families
CHILDREN_3 National Institute of Statistics 2001 Total families with more than 3 children /
with more than 3 children Total number of families
Municipal
quality of life Average Building Age BUILD National Institute of Statistics 2001 Weighted average age of the buildings
Municipal Abstention Rate VOTE National Elections Commission 2005 Abstention rate in local government elections in 2005
Social Capital Percentage of recycle
RECY National Institute of Statistics 2001 Recycle residues in the municipality (KG)/
residues per resident Resident population in the municipality (hab)
Teacher/pupil ratio per NUTIII TEACHERS National Institute of Statistics 2001 Total number of 3rd cycle and secondary teachers/
Total number of 3rd cycle and secondary students
School
Number of exams EXAMS Ministry of Education
2005-2010
Public school (dummy) PUB Ministry of Education
2005-2010 Equals 1 if the school is Public and equals 0 otherwise
Private school financed
PFPRIV Ministry of Education
2005-2010
Equals 1 if the school is a State-funded Private school
by the Government (dummy) and equals 0 otherwise
Percentage of girls GIRLS Ministry of Education
2005-2010 Percentage of girls in 9
th
grade exams per school
Percentage of students under 16 AGE Ministry of Education
2005-2010
Percentage of students under 16
in 9th grade exams per school