DOI: 10.1590/1808-057x201703420
Satisfaction among accounting professors in Brazil
Tamires Sousa Araújo
Universidade Federal de Uberlândia, Faculdade de Ciências Contábeis, Uberlândia, MG, Brazil
Gilberto José Miranda
Universidade Federal de Uberlândia, Faculdade de Ciências Contábeis, Programa de Pós-Graduação em Ciências Contábeis, Uberlândia, MG, Brazil
Janser Moura Pereira
Universidade Federal de Uberlândia, Faculdade de Matemática, Uberlândia, MG, Brazil
Received on 03.18.2016 – Desk acceptance on 04.10.2016 – 5th version approved on 02.12.2017
ABSTRACT
he aim of this study was to identify the prevalence of satisfaction among accounting professors in Brazil throughout their careers. he research is classiied as descriptive and used a quantitative approach to data analysis. 641 valid responses were obtained from professors from all regions of Brazil. he results show that a feeling of satisfaction prevails among accounting course professors, as most of them “like the profession” and, in general, “are satisied with it”. It was found that levels of satisfaction are higher among individuals with more experience, in that in their irst years in the job (one to three years), professors have lower satisfaction rates; the highest levels of satisfaction are found in the inal stage (over 35 years). he main factor that inluences satisfaction is personal fulillment (teaching work and relationship with students). It was also possible to identify that positive feelings about teaching predominate (67.3%) compared to negative ones (32.7%). hese results show the need for greater attention to be paid in the early years of the career in order to avoid a “reality clash”. hey also show the need for other studies to investigate how the phases in the life cycle of accounting professors are characterized.
1. INTRODUCTION
Job satisfaction is a relevant topic when thinking about professional development in any area, including education. However, little is known about the levels of satisfaction, the factors associated with it, and the predominant feelings among professors in higher education. Recent changes make the topic even more important.
The approval of Act n. 9,394/1996 – Law of Guidelines and Bases for National Education (Brazil, 1996) - enabled big changes in Brazilian higher education. h e number of positions in public and private teaching increased, new modalities appeared, such as distance learning, and mechanisms were constructed for regulating quality, aimed at assessing and monitoring educational policies.
In the 1980s, matriculations in higher education numbered approximately 300 thousand. In 2013, the Census on Higher Education indicated 7,305,977 matriculated students; of these, 74% were in private institutions and 26% were in public ones (Anísio Teixeira National Institute for Educational Studies and Research [INEP], 2013). h is story was no diff erent in accounting courses. In 1991 there were approximately 97 thousand students matriculated. In 2013, this number had increased to 328,031 students. In 2013, accounting courses came to occupy fourth position in number of matriculations in Brazilian higher education, with approximately 4.5% of total matriculations.
However, accounting courses have successively presented low academic performance indices, both in the National Student Performance Exam (ENADE) and in the Suffi ciency Exam promoted by the Federal Council for Accounting (CFC). h e results from the ENADE in the 2006, 2009, and 2012 editions were around 34%, with accounting thus featuring among the worst performing courses. Similarly, between the i rst edition of the 2011 Suffi ciency Exam and the i rst one from 2015, average candidate performance was 43% (Federal Council for Accounting, 2015).
Against this backdrop, professors face the challenge of remaining up to date, of understanding student diversity, and of diversifying with regards to forms of teaching, in order to have a better chance of reaching the heterogeneity present in the classroom, and thus fuli ll their role in the teaching-learning process.
Moreover, studies are needed that include the role of teaching staff in the process of training future
professionals, as well as factors that can aff ect their job satisfaction. h is investigation was therefore guided by the following question: how prevalent is satisfaction among accounting professors in Brazil throughout their careers?
Job satisfaction can be dei ned as a sensitive feeling that results from analyzing the work environment and experiences within it (Ferreira, 2011). Ramos (2009) indicates that job satisfaction can be understood as a positive emotional state derived from a profession. Freitas (2011) understands that satisfaction is a base-component for any organization and that it supports the development of institutions.
One of the main theories related with job satisfaction is the two-factor theory proposed by Herzberg (1987), which was based on the theory of human motivation from Maslow (1943). Herzberg (1987) proposes that satisfaction is motivated by “job enrichment”, which means off ering opportunities for the psychological growth of employees, thus keeping them satisi ed with their work. Pedro and Peixoto (2006) justify the use of this theory in the educational environment due to it being directly solely towards job satisfaction, with it being able to effi ciently measure whether teaching staff are satisi ed with their organizational environment or not. h is environment covers all of the important components in an organization, such as working conditions and economic and political relationships (Megginson, Mosley & Pietri, 1986).
Studies carried out by diff erent authors based on the theory from Herzberg (1987) and with regards to elementary level education in Portugal have shown that job satisfaction among teachers is low, that teacher malaise is persistent, and that this evidence could aff ect student performance (Jesus, Abreu, Santos & Pereira, 1992; Pedro & Peixoto, 2006). In Brazil, a few studies on higher education show greater levels of satisfaction (Assunção, Domingos, Cabral, Santos & Pessoa, 2014; Moretti, 2010; Traldi & Fiuza, 2012).
In the area of accounting, these studies are rare. However, understanding the prevalence of satisfaction among accounting professors throughout their careers could contribute with observations about institutional actions for improving the work environment and favoring the professional training process.
teaching professionals, and focusing on Huberman (2000). In the third section the methodological procedures are presented: data collection, composition of the instrument, sample, and statistical tests used. In the fourth section the
results are presented: descriptive statistics, satisfaction scores in each life cycle stage, factors identii ed, and feelings experienced by the professors. Finally, in the i t h section, the i nal remarks are presented.
2. A LOOK AT JOB SATISFACTION AMONG PROFESSORS
For Ferreira (2011, p. 16), “since the i rst decades of the twentieth century, man’s satisfaction at work has constituted a factor of growing concern”, as it can be understood that lack of job satisfaction can cause worker frustration and losses to employers and those who receive the services provided.
Bergamini (1997) shows that it is common in many organizations for there to be workers who are unsatisi ed with what they do and who are only in the company for the remuneration that they use to be happy outside of work, which makes satisfaction a problem for both sides, employee and employer. According to Ferreira (2011), the reason for such concern is that this lack of satisfaction can cause disharmony in the work environment, reducing productivity.
In conceptual terms, Anitha (2011) indicates that job satisfaction is a general attitude regarding how much employees like their jobs, with this satisfaction being important to the total quality of an organization, since it enables higher employee and employer performance. For Ferreira (2011, p. 74), being satisi ed in the organizational environment can be understood as “a pleasant or positive emotional state resulting from the evaluation of some job or experiences in the job”. h e author also adds that:
(...) job satisfaction is a pleasurable emotional state derived from evaluating a job with regards to an individual’s values, related to the job. Job dissatisfaction is an unpleasant emotional state derived from evaluating a job as ignoring, frustrating, or denying the individual’s values, related to the job (Ferreira, 2011, p. 74 apud Locke, 1976).
Many authors indicate job satisfaction as a “positive” employee state with regards to their job (Alves, 1991, 1994; Gursel, Sunbul & Sari, 2002; Seco, 2000). Others address satisfaction as professional success (Frase & Sorenson, 1992; Jesus, 1993, 1995; Pinto, 1996; Sánchez & García, 1997). All of these approaches show that job satisfaction is linked to the situation in which workers i nd themselves in companies, and whether they consider themselves to be “happy” with the role that they carry out and how much they are valued.
A pioneering study on the topic of job satisfaction was conducted by Maslow (1943), establishing the
foundations of the theory of human motivation. According to Maslow, human needs present a pyramidal hierarchy in which the lowest level (the base of the pyramid) is composed of the most basic (physiological) needs, while the other levels (security needs, social, self-esteem, and self-fuli llment needs) become more diffi cult to reach as the pyramid is climbed. Following on from this reasoning, Bohrer (1981, p. 44) highlights that “individuals will only be motivated by a higher level of needs when they have satisfactorily achieved the previous levels”.
h us, any threat to these needs can cause frustrations in an individual. Maslow (1943) explains that a frustrated man can be considered as a sick individual. h e author contemplates that it is the task of organizations to create a bridge between basic needs and worker fuli llment in a company.
Following on from this, Ferreira, Demutti, and Gimenez (2010, p. 7) highlight that “even if all basic needs are at least partially satisi ed, individuals can feel unhappy if they are not using their full ability”. Also according to these authors, another weakness in the theory is the rigidity of the levels, since in order for an individual to reach higher levels the lower ones need to be totally satisi ed. However, this ot en does not occur. Sometimes a person can aspire to a need from higher levels even without fully satisfying the lower levels. Bergamini (1997) adds that the research developed by Maslow lacked empirical support, with no test that validated it in practice, given that it was carried out via observations.
Despite the criticisms, the theory from Maslow (1943) provided support to others, such as the two-factor theory (Ferreira et al., 2010) proposed by Herzberg (1987), which highlights that the basic needs presented by Maslow (1943) do not create motivation, but rather “movement”. Basically, the movement would be all of the attitudes taken by an organization (such as increasing salaries, bonuses, benei ts, changing roles, etc.) that make individuals carry out certain tasks. h ese are what Herzberg (1987) called extrinsic factors.
In order to satisfy workers, it is necessary to fuli ll their esteem and self-fuli llment needs. Enrichment can occur via the type of work or with increases in the range of
work. Herzberg (1987) presents two groups of factors for motivation at work: hygienic factors and motivational factors, which are illustrated in Figure 1.
For Herzberg (1987), the hygienic factors are extrinsic and prevent dissatisfaction, but the employee has no control over them. Moreover, these factors feature in the analysis of variables that are beyond the work, involving what is external for individuals (salary, security, etc.), and what is within the environment they coexist in. Bergamini (1997) states that increasing salary or rewards raises the level of productivity in the short run, but this increase does not last.
A lack of hygienic factors can demotivate workers, such as when an employee does not think their remuneration is suffi cient, the working conditions are not good, the interpersonal relationships between colleagues and leadership are not good, there is uncertainty about their employment within some months, etc. h ese hygienic factors only inhibit dissatisfaction for a limited period of time and do not create motivation. Bergamini (1997) adds that the more money is involved in rewards, the greater the damage to the company can be if these values are removed from the workers, since they can understand this as a punishment, which can result in major conl icts and dissatisfaction.
As for the intrinsic motivational factors, these create satisfaction among employees and can, for a longer period
of time, “control” employee dissatisfaction. h ese factors are directly related to the employee’s function, since he/ she can feel more satisi ed by having more responsibilities staff (Herzberg, 1987). For the author, some activities in organizations can motivate workers, including: freedom in their role, accountability for their own work, and more authority being given to them. However, not all organizations and not all jobs can be enriched.
Pedro and Peixoto (2006), supported by the theory from Herzberg (1987), carried out a study aiming to analyze the job satisfaction index of teachers in elementary cycles 2 and 3 in Portugal. h e results from the research indicate an average job satisfaction index of 2.34, on a scale of 5 points. h e “sociopolitical dimension” factor, related to items concerning salary and professional questions, was the most strongly associated with dissatisfaction, with the “teacher salary”, “attitude of parents and society towards teachers”, “students’ behavior in class”, “security and stability at work”, and “processes for career progression” variables standing out.
h e authors also analyzed the relationship between the teacher life cycle and job satisfaction and identii ed that the group with between 7 and 15 years in teaching present a higher satisfaction value (3.15 points) and that
Figure 1 Hygienic and motivational factors: Herzberg Theory
the new teachers in the i rst group with 1 to 6 years present a lower value (2.21 points).
In Brazil, Taveira and Silva (2015) studied the relationship between job satisfaction among teachers and the performance presented by students in the Prova Brasil (National School Performance Evaluation) in the city of Macaé, in the state of Rio de Janeiro. h e study involved 77 teachers at 6 elementary education institutions. In order to carry it out, the Siqueira (2008) questionnaire – Job Satisfaction Scale (JSS) – was used to identify satisfaction among the teachers. h e results prove that there is a positive correlation between satisfaction and student performance in the Prova Brasil. Using a 7 point scale, the study also showed the following satisfaction indices: 3.90 and 3.16 points in relation to salaries, 3.36 and 3.17 points in relation to promotion, 4.20 and 4.90 points in relation to leadership, 4.18 and 4.27 points in relation to the nature of the work, and 5.11 and 5.19 points in relation to work colleagues.
Traldi and Fiuza (2012) carried out a study aimed at identifying the levels of organizational commitment, well-being, and satisfaction among 76 professors who lectured in at least one subject to business course students at a university. h e results regarding job satisfaction indicate that, on a scale of 0 to 5 points, the professors were satisi ed with the “leadership” (4.23 points), with the “colleagues” (4.02 points), and with the “nature of the work” (3.42). h e authors explain the relatively high results as being due to the arrival of new management at the university, which invested in improvements in the environment and in working conditions. h e results indicate that the greater the eff ective commitment of the professionals, the greater the levels of well-being and satisfaction.
Moretti (2010) aimed to identify the proi le and level of job satisfaction of business course professors at private teaching institutions in the city of Ribeirão Preto, in the state of São Paulo, using the JSS tool. h e sample was composed of 127 answered questionnaires. h e author analyzed the following factors related to satisfaction: colleagues, salary, leadership, nature of work, and promotions. h e authors emphasize that, in general, the professors were satisi ed with their colleagues (5.51), leadership (5.48), and the nature of the work (5.23), but dissatisi ed with salary (3.94) and promotions (3.85), on a scale of 1 to 7 points. h e authors also report that in relation to job satisfaction there is no signii cant diff erence between genders. It was also shown that salary increases do not aff ect levels of satisfaction.
Assunção et al. (2014) analyzed the relationship between the level of satisfaction and level of aff ective
organizational commitment of accounting course university professors. h e sample was composed of 42 professors from two universities (Federal University of Ceará and University of Fortaleza), corresponding to 65% of the accounting course professors. Using the Mann Whitney U test, they investigated the variables work, relationships, salary, outlook, and autonomy. h e results revealed that there is a positive and moderate relationship between job satisfaction and eff ective organizational commitment. It was also shown that the “salary” and “autonomy” variables were not signii cant and are not related with the level of professor satisfaction. As for the “work” and “skills and relationships” variables, these are factors that presented a positive relationship with satisfaction, being linked to professor satisfaction. It was also found that there was no signii cant diff erence in satisfaction between the public and private university professors studied (Assunção et al., 2014).
h us, by carrying out a broad diagnosis of the satisfaction prevalent among accounting course professors in Brazil, as well as its evolution throughout their careers, this study i lls some gaps. Understanding the path professors traverse over the course of their careers has been the topic of studies by a number of authors (Araújo, Lima, Oliveira & Miranda, 2015; Gonçalves, 1995, 2009; Huberman, 1989, 2000; Jesus & Santos, 2004; Lima, Oliveira, Araújo & Miranda, 2015; Veenman, 1984).
A classical study concerning the topic was developed by Huberman (1989, 2000), the aim of which was to identify the stages traversed by teachers during their careers. h e investigation was carried out using elementary cycle teachers. A teacher’s life cycle begins in the career entry stage, which lasts from one to three years. In this stage, two factors are important: the “discovery” aspect, “which translates initial enthusiasm, experimentation, and exaltation from i nally being in a position of responsibility”, and “survival”, in which a “reality shock” can be present, since in this period teachers will i nd themselves in the classroom, which may enter into conl ict with all of their “beliefs” and expectations from before beginning their career (Huberman, 2000, p. 39).
h e third stage established by Huberman (2000) is that of diversii cation or questioning (self-questioning), this being the longest life cycle stage. h is stage begins at er seven years in teaching and extends up to 25 years. Huberman (2000, p. 41) affi rms that, in the diversii cation stage, “people then embark on a small series of personal experiments, diversifying didactic material, evaluation methods, the way students are grouped, the sequence of programs, etc.”. However, at er leaving the establishment stage, a teacher may, instead of entering the diversii cation stage, go on to the questioning stage. h e symptoms of this stage range “from a mild sensation of routine to an existential ‘crisis’ regarding career fuli llment” (Huberman, 2000, p. 42). Also in this stage, teachers carry out an analysis of their life and their career, questioning their goals and objectives to be achieved.
h e fourth stage will depend on the path taken in the previous stage. If a teacher underwent diversii cation, in the fourth stage he/she will enter into serenity, which is characterized by a gradual distancing from the students, which occurs peacefully (Huberman, 2000). On the other hand, if the teacher has previously experienced questioning, in this career stage he/she will undoubtedly experience conservatism, when the professional feels anxious, dissatisi ed, regretful about life and career, and resistant to changes. h e duration of this stage ranges from 25 to 35 years in a career (Huberman, 2000).
At er all of these stages, a i nal, divestment stage begins. Ferreira (2008, p. 33) understands this stage to be “a phenomenon that can be seen as a ‘divestment’
in personal and institutional plans, a retreat from the ambitions or ideas present at the beginning.” For Huberman (2000, p. 50) “it is a time when people view their own lives as ‘inevitable’, as one life that ‘had to’ happen the way it did and that needs to be accepted as such”. In this stage, considered to be the end of a teaching career, the divestment process and departure from the career begins.
As verii ed, the path of a teaching career is not a sequence of events, but rather a process (Huberman, 2000) that starts in post-graduation, when the initial teacher training beings (or should), and extends until the career ends.
Pedro and Peixoto (2006) indicate that the life stages can be related with teacher motivation, since in certain stages addressed by Huberman (2000), teachers can be more or less demotivated. With regards to this, the studies from Araújo et al. (2015) and Lima et al. (2015) reveal that, in the i eld of accounting courses in Brazil, the initial stage in the teaching profession has been the most problematic, aff ected mainly by student demotivation, heterogeneous class, the amount of administrative work, very numerous classrooms, and lack of time.
It is therefore understood that this paper is diff erent from those previously discussed, since it aims to identify the prevalence of satisfaction among accounting professors in Brazil throughout their careers. By addressing this gap, it can provide relevant contributions to the literature and to teaching in the area of accounting.
3. METHODOLOGICAL ASPECTS
h is study is descriptive and aims to identify the prevalence of satisfaction among accounting professors in Brazil over the course of their careers. h e approach to the research problem is quantitative. h e data were gathered using the questionnaire tested and validated by Pedro and Peixoto (2006), in which some adjustments were made at er observing the reality of accounting teaching in Brazil, such as the insertion of the terms “accounting
professor” and “teaching activity”, and the scale was changed, adopting scores from 1 to 10. h ese changes were needed in order to use the tool in the context of higher education in accounting, as well as to apply exploratory factor analysis (EFA), as suggested by Fávero, Beli ore, Silva, and Chan (2009). h e i nal version was approved by the Ethics Committee of the Federal University of Uberlandia.
1) characterization of the respondents (gender, age, time teaching, qualii cation, region of origin, type of institution);
2) general level of satisfaction (with four statements to which the participants should respond on a scale ranging from “completely disagree” to “completely agree”, with values close to 1 for disagree and close to 10 for agree);
3) factors related with satisfaction, which are based on the two-factor theory – hygienic and motivational; 4) feelings perceived in teaching, with the option to choose
three feelings experienced in teaching out of 12 feelings presented (6 positive and 6 negative).
For the data collection a database of the possible respondents was created. h is process was carried out in three stages. First, all of the institutions that off ered accounting courses in Brazil were identified. This investigation was carried out using the e-MEC platform (http://emec.mec.gov.br/), an electronic system for monitoring higher education processes in which there is information on course recognition, authorization, etc. h e platform off ers a list of all of the institutions and all of the courses registered. Using an advanced search (accounting science courses in operation in Brazil), it was possible to obtain a spreadsheet of 1,292 courses.
In the second stage, the websites of the institutions listed in the spreadsheet obtained using the e-MEC platform were visited. The database was composed of diff erent information, such as: name of institution, institution website, name of course coordinator, email address of the course coordinator, and email addresses of professors linked to the institution (this information was predominantly made available in public institutions). h e searches resulted in a total of 1,706 course coordinator and 2,849 professor email addresses.
Subsequently, the data collection tool was stored in the Google Docs platform, were it remained available between May 26 and July 26 of 2015, when the invitations were sent to the participants. h ese were sent in two ways: i rst, electronic messages were sent to the course coordinators requesting that they respond to the survey and pass on the message to the other professors in their respective institutions. h en individual messages were sent to the 2,849 professors previously identii ed. h e messages were sent by electronic direct mail, specifying the name of the professors.
Gall, Gall, and Borg (2007) highlight that a recurring problem with the use of questionnaires for capturing data is reply rate, which is considered low. In this case, the electronic messages were sent three
times, making diff erent appeals (e.g. the relevance of the research to teaching, a commitment to get back with the results, and mentioning the low rate of replies to previous mailings), since, according to the authors, this procedure increases the reply rate. h e mailing was carried out with 20 intervals in between. In this period, 652 replies were received, and of this total, 11 respondents did not agree to take part in the study or let the questionnaire blank. h us, the i nal sample was composed of 641 replies.
At er receiving the replies, the data analysis began, which was carried out in three stages: in the i rst, the descriptive statistics of the sample were carried out (gender, age, time teaching, qualii cation, region of origin, and type of institution). In the second stage, multiple comparisons of proportions tests were conducted to compare the proportions of satisfaction and dissatisfaction among the professors in the sample (tables 2 and 5), as well as the test of the association between level of satisfaction and stage. h e p-values from the tests of association are presented in i gures 2, 4, 5, and 6. Both tests follow a chi-squared distribution.
For comparing two proportions or more, Biase and Ferreira (2009) recommend the chi-squared test of asymptotic multiple comparisons of binominal proportions, since this test presents reliable results and does not depend on assumptions (additivity, independence of observations, residual normality, homogeneity of variances). h e chi-squared test of independence (or association) assumes that: (i) no cell in the table has an expected frequency of less than 1 and (ii) no more than 20% of the cells have an expected frequency of less than 5. Non-verii cation of the assumptions leads to resorting to Monte Carlo simulations. h erefore, in this paper, the chi-squared test based on Monte Carlo sampling was applied (n = 10,000) (Siegel & Castellan, 1988).
In the third stage, EFA was carried out to group, into factors, the questions from section 3 of the questionnaire. EFA aims to explain the correlation or covariance in a group of variables. h e factorial test enables how much each factor is associated to each variable to be assessed, as well as analyzing how much the factors found explain the variability of the results obtained using the sum of variances in the original variables (Fávero et al., 2009).
factors assessed, Cronbach’s alpha was used, presented on the last line of Table 3, as suggested by Hair, Anderson, Tatham, and Black (2005).
In order to verify whether there is any correlation between the factors found in the factor analysis and the variables related to general satisfaction among the professors, correlation coeffi cients were used, which according to Martins and Teói lo (2007) indicate the strength of a connection between two variables, which is shown in Table 4. Considering that the data did not present normality, the Spearmen non-parametric correlation test was used.
It bears mentioning that the term “correlation” only enables affi rmations to be made about associations and never about cause and eff ect, since it is not possible to directly observe the eff ect of one factor, as the same individual cannot, at the same time, be exposed and not exposed to the factor. In reality, what is observed are two groups, one which is exposed to the factor and another which is not. h us, by using these groups it is possible to identify the connection by means of measurements such as correlation coeffi cients.
4. RESULTS ANALYSIS
First, the proi le of the respondents is presented. h is aspect is important, since previous studies have addressed different audiences from that of this
study. h e sample was composed of 641 accounting science professors in Brazil, as shown in Table 1.
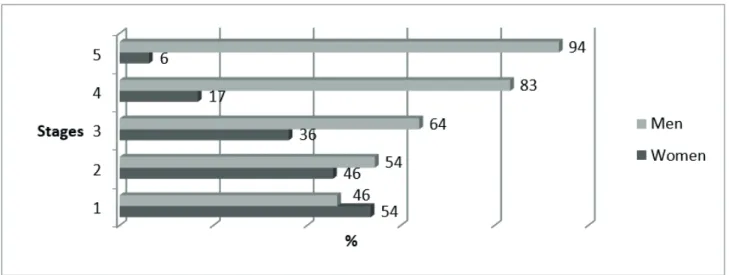
The respondent profile is composed of 63.2% male and 36.8% female professors. Although males are predominant in the sample, a growing entry of women into the initial stages of the teaching career in accounting can be
noticed, with an inversion occurring in the predominant gender among new arrivals, as shown in Figure 2. h is result supports the trend identii ed by Araújo et al. (2015).
Table 1Profi le of respondents
Variables Total %
General sample 641 100
Gender Female 236 36.8
Male 405 63.2
Stages (years)
Up to 3 56 8.7
4-6 112 17.5
7-25 402 62.7
26-35 54 8.4
More than 35 17 2.7
Qualii cation
Graduation 03 0.5
Specialization 71 11.1
Master’s 323 50.4
Doctorate 238 37.1
Post-Doctorate 06 0.9
Region
Central-West 65 10.1
Northeast 117 18.3
North 28 4.4
Southeast 218 34
South 205 32
No answer 08 1.2
Insitution
Public 374 58.3
Private 229 35.7
Both 38 5.9
Figure 2Gender per life cycle stage
Source: Developed by the authors.
With regards to time in teaching, analyzed in accordance with the professional life cycle stages proposed by Huberman (2000), it was verii ed that 8.7% of the sample are new arrivals to the career, as they have been teaching for up to 3 years, 17.5% are professors in the establishment stage of their careers, with 4 to 6 years of teaching experience, the majority of the professors investigated, 62.7%, are passing through the intermediate stage, with 7 to 25 years in teaching, 8.4% have between 26 and 35 years of experience, and 2.7% are in the stage known by Huberman (2000) as divestment, with more than 35 years in teaching.
In relation to the respondents’ qualii cations, a prevalence of masters is observed, covering 50.4% of the total, followed by doctors, (or post-doctors), with 38%, and specialists, representing 11.6% of the participants. It was interesting to observe that 88.4% of the sample has a strict sensu qualii cation, which may be associated with the greater number of respondents from public institutions (58.3%).
With a greater number of institutions having a higher course in accounting, the Southeast also presented the greatest number of replies (34%), followed by the South region, with 32%. h e Northeast presented 18.3%, the Central-West region presented 10.1%, and the North region represented 5.9% of total respondents.
It was also identii ed that 58.3% of the professors lectured at public higher education institutions (HEIs), 35.7% at private HEIs, and 4.4% worked at HEIs of both
types. h ese results are not consistent with the proportions of matriculations in public and private HEIs in Brazil, since the data from the 2013 National Census on Higher Education (Instituto Nacional de Estudos e Pesquisas Educacionais Anísio Teixeira [INEP], 2013) reveal that 26.5% of matriculations in higher education are in public HEIs and 73.5% are in private HEIs. h e greater participation of professors from public HEIs in the study may be explained, among other aspects, by the ease of access to the professors’ emails.
With the aim of identifying possible biases derived from the predominantly public HEI sample, diff erence of means tests between the satisfaction indices were carried out; however, no statistically signii cant diff erences were found between the satisfaction levels of public and private HEI professors.
4.1 General Satisfaction among Professors
Table 2General satisfaction among the professors
Variables Questions P1 (n) P2 (n) p Decision
Satisfaction 1 I like my profession. 0.0484 (31) 0.9516 (610) < 0.000 P1 < P2 Satisfaction 2 In general, I feel satisi ed in my teaching job. 0.0655 (42) 0.9345 (599) < 0.000 P1< P2 Dissatisfaction 1 Sometimes I feel discouraged with my profession. 0.5632 (361) 0.4368 (280) < 0.000 P1 > P2 Dissatisfaction 2 If it were possible, I would change job. 0.8596 (551) 0.1404 (90) < 0.001 P1 > P2 P = proportion.
Source: Developed by the authors.
At a 5% level of significance and using the comparisons between proportions test, when the professors where questioned in relation to “liking the profession”, the answers were almost totally concentrated in proportion 2, showing that most professors like the profession. When questioned in relation to “feeling satisi ed with the job”, more than 90% of the respondents reported being satisi ed with their teaching career.
h ese results provide the i rst research evidence that accounting professors are predominantly satisi ed with the profession, thus converging with studies carried out in higher education in previous investigations (Ferreira, 2011; Ferreira, Machado & Gouveia, 2012; Moretti, 2010), which identii ed positive satisfaction among professors, unlike the study carried out in elementary education, which indicates dissatisfaction among teaching staff (Pedro & Peixoto, 2006).
At a 5% level of signii cance, using the comparisons of proportions test, when the professors were questioned regarding “feeling discouraged by the profession”, 56% (361 professors) disagree with this statement, coni rming the trend identii ed in the previous question. However, it should be mentioned that 44% of the professors questioned sometimes feel discouraged with the profession, indicating that even among those who feed satisi ed with teaching,
moments of discouragement exist.
Finally, when questioned regarding “changing job”, only 14% of those investigated (90 professors) said they would change. It is interesting to observe that 61% of these professors were male, 39% doctors and 44% masters, 70% did not carry out any other activity besides teaching, 68% were in the third stage of the life cycle, and 83% were linked to public institutions. In summary, the proi le of the professor who would change job is: male, in the middle of the career, with a title, dedicated exclusively to teaching, and from a public institution.
It is noteworthy that the proportion of dissatisfaction with regards to the profession among accounting professors is much lower than the proportion related to satisfaction. h is result is coherent with the responses to the i rst two questions and coni rms the tendency for satisfaction among the professors investigated.
To complete the analysis, the general level of satisfaction among professors throughout the career stages proposed by Huberman (2000) was investigated. Figures 3, 4, 5, and 6 present the questions on general satisfaction in relation to the career stages, as well as the p-values from the chi-squared test, which verify whether the level of satisfaction depends on stage.
Figure 3 I like my profession
It can be observed that approximately 80% of the professors in stages 1, 2, and 3, when asked whether they like the profession, attributed scores of 9 or 10, indicating that they in fact like the profession. In the subsequent stages, this percentage rises even more. In stage 4, for example, 83% of the professors attributed scores of 9 or 10, and in stage 5, all of the professors gave a score of 9 or 10. h e chi-squared test, using a 10% level of signii cance, shows evidence that “liking” the profession increases with the professors’ time of experience (p = 0.0956).
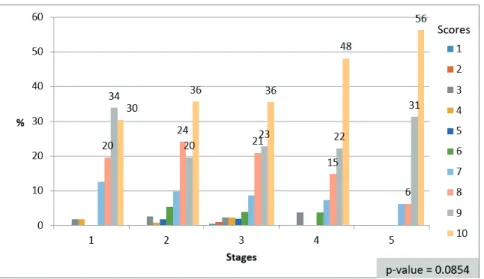
It can be noted, in Figure 4, that 64% of the professors in stage 1 attributed higher satisfaction scores (9 or 10) and that there was a tendency for growth over the course of the other career stages. In the last stage (5), 93% of the sample chose scores of 9 or 10 with regards to job satisfaction. h e chi-squared test, using a 10% level of signii cance, shows evidence that as professors acquire more experience in the profession, their satisfaction increases (p = 0.0854).
Figure 4 I feel satisfi ed with the profession
Source: Developed by the authors.
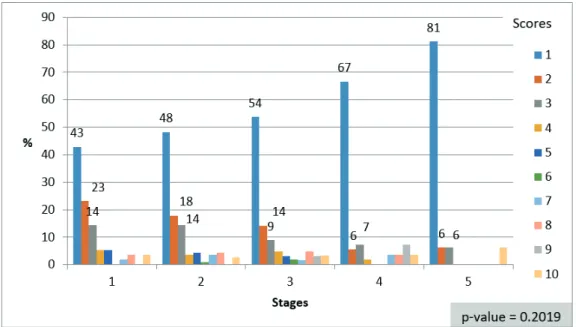
h e professors were also investigated with regards to “feeling discouraged with the profession”. Figure 5 presents the results.
Figure 5. I feel discouraged with the profession
Figure 6 If I could, I would change profession
Source: Developed by the authors.
Unlike i gures 3 and 4, in Figure 5 an increase in lower scores can be seen over the course of the stages, especially score 1, showing that, at the beginning of the career, there is more disappointment as a result of the
diffi culties. In this case, using the chi-squared test at a 10% level of signii cance shows no evidence of a connection between discouraged professors and time in teaching (p = 0.3667).
h e last question investigated, “if I could, I would
change profession”, is presented in Figure 6.
From Figure 6 it is possible to see that 66% of the professors who i nd themselves in the i rst two stages disagree with the statement, having indicated scores 1 or 2. As for the professors in the other stages, more than half chose to disagree with the statement, and in the last stage (5), 93% totally disagree with the statement. However, using the chi-squared test at a 10% level of signii cance shows no evidence of a connection between the statement and time in teaching.
Thus, with regards to satisfaction, the results identii ed suggest that it is positive and rises over the course of the career stages. Even though the studies from Huberman (1989, 2000) suggest that there can be satisfaction and dissatisfaction in practically all stages of the career – for example, in the i rst stage, discovery/ enthusiasm vs. reality shock, in the third, diversii cation vs. questioning, in the fourth, serene distancing vs. conservatism, and in the i t h stage, serene divestment vs. bitter divestment – it must be highlighted that, in the more advanced stages of the career, teaching professionals undoubtedly take into account the investment already made in the career vis-à-vis the opportunities for change at this time. It can be said that these phases involve a certain settling or acceptance, “of accepting as such” (Huberman,
2000, p. 50).
4.2 Factors Related to Job Satisfaction
In the third section of the questionnaire, the professors are presented with 25 questions for which they should inform their level of agreement, on a scale of 1 to 10 points. Answers close to 1 mean “it does not satisfy me” and those close to 10 mean “it satisi es me completely”.
To simplify the number of items composing the questionnaire, EFA analysis was carried out. According to Fávero et al. (2009), this test aims to analyze the connection between each variable and a factor and how much this factor can explain the results found in a sample. By carrying out factor analysis, a result to the Kaiser Meyer Olkin (KMO) test of 0.92 was found. Figueiredo and Silva (2010) mention that this test can vary between 0 and 1 and that the closer to 1, the better; in other words, the KMO obtained in this study satisi ed the test.
Hair et al. (2005), the lowest limit generally accepted for the Cronbach alpha is 0.70, which was also reached.
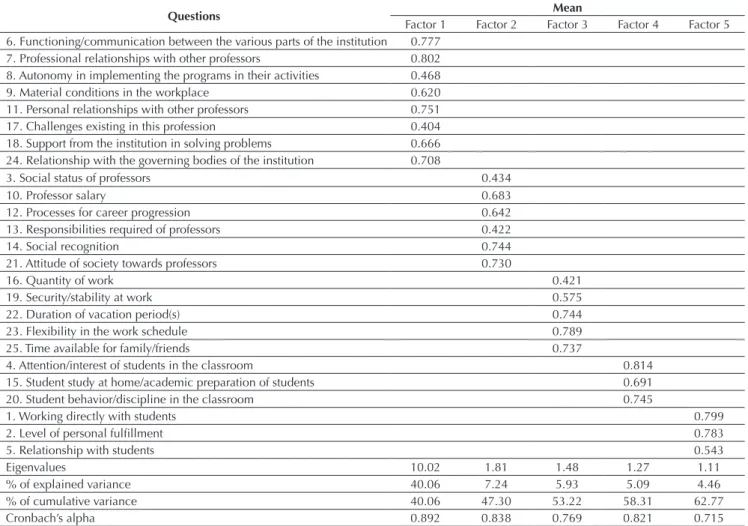
h e factors evaluated in this study are similar to those assessed by Pedro and Peixoto (2006):
Factor 1 – interpersonal and institutional relationships, which grouped the items related to the professor’s relationship with the teaching institution;
Factor 2 – sociopolitical, which involved the items related to salary and professional questions;
Factor 3 – working conditions, with item related to the teaching work conditions;
Factor 4 – students, which contemplates the items related to questions concerning the students;
Factor 5 – personal fuli llment, which grouped items
related to the teaching work and the relationship with students.
h e i rst three factors (1, 2, and 3) contain items related to the hygienic factors, which are extrinsic, derive from dissatisfaction and over which employees have no control. h e lack of these factors can demotivate workers, as described in theory from Herzberg (1987). As for the last two factors, these contemplated items related to the motivational factors addressed by Herzberg (1987). h ese factors are intrinsic, create satisfaction among employees, and are directly related to the roles carried out by employees.
h e next step is to analyze whether the factors assessed are in fact associated with satisfaction among
Table 3Factor Analysis (varimax rotation)
Questions Mean
Factor 1 Factor 2 Factor 3 Factor 4 Factor 5 6. Functioning/communication between the various parts of the institution 0.777
7. Professional relationships with other professors 0.802
8. Autonomy in implementing the programs in their activities 0.468
9. Material conditions in the workplace 0.620
11. Personal relationships with other professors 0.751
17. Challenges existing in this profession 0.404
18. Support from the institution in solving problems 0.666
24. Relationship with the governing bodies of the institution 0.708
3. Social status of professors 0.434
10. Professor salary 0.683
12. Processes for career progression 0.642
13. Responsibilities required of professors 0.422
14. Social recognition 0.744
21. Attitude of society towards professors 0.730
16. Quantity of work 0.421
19. Security/stability at work 0.575
22. Duration of vacation period(s) 0.744
23. Flexibility in the work schedule 0.789
25. Time available for family/friends 0.737
4. Attention/interest of students in the classroom 0.814
15. Student study at home/academic preparation of students 0.691
20. Student behavior/discipline in the classroom 0.745
1. Working directly with students 0.799
2. Level of personal fuli llment 0.783
5. Relationship with students 0.543
Eigenvalues 10.02 1.81 1.48 1.27 1.11
% of explained variance 40.06 7.24 5.93 5.09 4.46
% of cumulative variance 40.06 47.30 53.22 58.31 62.77
Cronbach’s alpha 0.892 0.838 0.769 0.821 0.715
Table 4 Test of correlation between the motivational factors and level of satisfaction among professors
Satisfaction Spearman Correlation
Factor 1 Factor 2 Factor 3 Factor 4 Factor 5
I like my profession 0.257 0.125 0.142 0.121 0.493
p 0.000 0.002 0.000 0.000 0.002
In general, I feel satisi ed in my teaching job 0.313 0.201 0.195 0.188 0.420
p 0.000 0.000 0.000 0.000 0.000
Dissatisfaction
Sometimes I feel discouraged with my profession -0.166 -0.164 -0.075 -0.212 -0.184
p 0.000 0.000 0.057 0.000 0.000
If it were possible, I would change job -0.169 -0.114 -0.127 -0.120 -0.338
p 0.000 0.004 0.001 0.002 0.000
Source: Developed by the authors.
the respondents. h e Spearman correlation test was thus carried out. h e results are presented in Table 4.
From Table 4, it can be noted that there is a positive and signii cant correlation between all of the factors found in the study and the two questions related to general satisfaction among the professors, using a 5% level of signii cance. Similarly, a negative and signii cant correlation is identii ed between the i ve factors and the two questions related to dissatisfaction, also at a level of 5%. h ese results show that these factors are related with the levels of satisfaction among accounting course professors and support the results obtained previously (Pedro, 2011; Pedro & Peixoto, 2006). In other words, in the i eld of accounting courses in Brazil, the assumptions of the two-factor theory remain valid, since both the hygienic factors, which are extrinsic and prevent dissatisfaction, and the motivational factors, which are intrinsic and create satisfaction, are signii cantly correlated with satisfaction among the professors.
h e factors that presented the highest coeffi cients of correlation were factor 5 (personal fuli llment) and factor 1 (interpersonal and institutional relationships). h e former is linked to the motivational factors and the latter to the hygienic factors. h is result partially converges with those of Pedro and Peixoto (2006), who in their study presented that the interpersonal and institutional relationships factor is the one that is most associated with professor satisfaction. h e result also supports what is proposed by the two-factor theory from Herzberg (1987), according to which motivational factors, such as personal
fuli llment, are positively associated with satisfaction. When the questions are inverted, or rather, when the factors associated with dissatisfaction are analyzed, the coeffi cients are all negative. h e factors that are most correlated are factor 4 (students), factor 5 (personal fuli llment), and factor 1 (interpersonal and institutional relationships), with the i rst two being linked to the motivational factors and the latter to the hygienic factors. h is means that the less fuli lled the professor is, the more dissatisi ed.
Considering that previous studies have already identii ed a connection between professor satisfaction and academic performance (Taveira & Silva, 2015), it becomes important for educational managers to pay attention to the i ve factors mentioned above, since all of them presented signii cant correlations with the questions on satisfaction and dissatisfaction, notably the factors that presented the highest coeffi cients (F1 and F5).
Tests were also carried out involving the correlation between the questions related to satisfaction and dissatisfaction and the control variables: gender, life cycle stage, region, public and private institution, age, and title of professor; however, none of these presented any level of signii cance.
4.3 Feelings Experienced by the Professors
It can be noted that the proportion of positive feelings is visibly greater than the negative ones and only the feeling of “worry” stands out among the negatives. h e feelings of frustration, anxiety, and discouragement are also relevant, but appear in smaller proportions than worry.
It is also interesting to observe that the three most representative positive feelings (enthusiasm, satisfaction, and fuli llment) were numerically higher in the private
institutions than in the public ones (19.8%, 17.4%, and 15.7% versus 17.5%, 17.3%, and 14.1%, respectively). Moreover, the feeling of worry also appeared with more intensity in the public institutions than in the private ones (15.9% and 13.8%, respectively).
Table 5 presents the test of the proportion of positive versus negative feelings reported by the 641 professors composing the sample.
Table 5Feelings experienced
Feelings Proportion p
Positive 0.6729
< 0.000
Negative 0.3271
Source: Developed by the authors.
Figure 7 Feelings experienced by the sample
Source: Developed by the authors.
At a 5% level of signii cance, using the comparisons of proportions test, the results coni rm the prevalence of satisfaction among the professors studied, since the most expressive feelings are positive (67.3%). h e negative feelings, which refer to job dissatisfaction, were chosen less by the professors (32.7%). h ese results diverge from those found in the study from Pedro and Peixoto (2006) carried out in Portugal and involving elementary education teachers, according to which the negative feelings are among the most mentioned by the teachers in the sample: nervousness (39.7%), worry (34.2%), and security (32.9%).
In summary, the results found in relation to the level of satisfaction among the professors, as well as its evolution throughout their careers, the results from the tests of correlation between the factors assessed in the factor
analysis and the level of satisfaction, as well as the analysis of the positive and negative feelings experienced by the professors, all point in the same direction: satisfaction among accounting professors in Brazil prevails over dissatisfaction.
5. FINAL REMARKS
h e diff erent results obtained in the study indicate the prevalence of general satisfaction among accounting professors, as the majority “like the profession” and, “in general, feel satisi ed with the profession”. Some studies indicate that teaching staff in diff erent areas, such as nursing, business, and elementary education, are also satisi ed with their professions (Ferreira, 2011; Ferreira et al., 2012; Moretti, 2010).
Observing the stages in a teaching career, the study identii ed that, as the number of years of experience increases, there is an increase in the satisfaction perceived by the professors (i gures 3 and 5), given that the i rst phase has lower levels of satisfaction and the last phase presents the highest levels. h e literature already indicates that the i rst phase is critical and that it requires care. According to Huberman (2000), the problems are greater in this phase, due to teaching professionals’ inexperience and lack of preparation.
h is tendency is aligned with the two-factor theory from Herzberg (1987), since as time passes the same professors acquire more experience and become more coni dent in facing the problems that originate from teaching, which can lead to them being more satisi ed.
h e correlation analysis indicated that all the factors generated by the EFA are signii cantly correlated with the questions in the study related to general satisfaction. Factor 5 (personal fuli llment), which is associated with the motivational factors, is the one that correlates the most with job satisfaction. h is indicates that, for the professors investigated, personal fuli llment is very important for satisfaction in teaching. h is i nding converges with that found in the theory from Herzberg (1987), in which the motivational factors increase teacher satisfaction.
Another piece of evidence that satisfaction among professors is greater than dissatisfaction involves the analysis of positive and negative feelings experienced by the professors in the profession. At a 5% level of signii cance, using the comparisons of proportions test, it was possible to identify that the most expressive feelings are positive ones (67.3%). As for the negative feelings, which rel ect job dissatisfaction, these were the least chosen by the professors (32.7%). Here, it is important to highlight that more than 70% of the sample was in more advanced stages of the career (stages 3, 4, and 5).
h ese results show that, despite accounting teaching in Brazil undergoing significant changes due to the
increase in matriculations and adhesion to international accounting standards, satisfaction with the profession prevails among the teaching staff . In other words, despite the problems, accounting teaching seems attractive.
h e results also show an increase in the presence of females in recent years, especially among new arrivals to the profession. h is fact, together with the increase in professors with a strict sensu qualii cation, indicates a change in the proi le of accounting professors in the near future.
h is paper contributes by adding to the studies involving job satisfaction among professors in the area of accounting, given that, in Brazil, such investigations are still rare. Moreover, by identifying that the most critical stage for professor dissatisfaction is the initial one, it encourages new studies regarding entry into the teaching career, in order to better explain the issues that aff ect new arrivals to the profession.
Also worth mentioning is the importance of educational managers continuously evaluating the factors related to professor satisfaction, as the literature already presents indications that professor satisfaction may be related to student academic performance (Taveira & Silva, 2015). Accounting courses have consistently presented low indices in the ENADE and in the CFC Suffi ciency Exam.
Finally, the limitations of this study should be highlighted. It is emphasized that the use of the life stages proposed by Huberman (1989) may not portray exactly the professional life cycle of accounting professors in Brazil. h e sample, although expressive, is predominantly comprised of public HEIs and its representativeness of Brazilian accounting professors is not known exactly, due to the absence of such information. It is also highlighted that there may be some bias originating from the lack of replies, as individuals with lower levels of satisfaction with the profession may be less interested in studies of this nature.
REFERENCES
Alves, F. C. (1991). Estudo da satisfação/insatisfação dos professores efectivos do 3º ciclo do ensino básico e do ensino secundário do distrito de Bragança (Master’s Degree). Universidade de Lisboa, Lisboa.
Alves, F. C. (1994). (In)satisfação docente. Revista Portuguesa de Pedagogia, 27, 29-60.
Anitha, R. (2011). A study on job satisfaction of paper mill employees with special reference to Udumalpet and PalaniTaluk. Journal of Management and Science, 1(1), 36-47. Araújo, T. S., Lima, F. D. C., Oliveira, A. C. L., & Miranda, G. J.
(2015). Problemas percebidos no exercício da docência em contabilidade. Revista Contabilidade & Finanças, 26(67), 93-105.
Assunção, R. R., Domingos, S. R. M., Cabral, A. C. A., Santos, S. M., & Pessoa, M. N. M. (2014). Satisfação e comprometimento organizacional afetivo: um estudo com docentes universitários do curso de ciências contábeis. Revista de Administração da UFSM, 7(3), 453-468.
Bergamini, C. W. (1997). Motivação nas organizações (4a. ed.). São Paulo, SP: Atlas.
Biase, N. G., & Ferreira, D. F. (2009). Comparações múltiplas e testes simultâneos para parâmetros binomiais de k populações independentes. Revista Brasileira de Biometria, 27, 301-323. Bohrer, R. S. (1981). Motivação: abordagem crítica da teoria de
Maslow pela propaganda. Revista Administração de Empresas, 21(4), 43-47.
Brasil. (1996). Lei nº 9.394, de 20 de dezembro de 1996. Estabelece as diretrizes e bases da educação nacional. Brasília, DF: Diário Oi cial da União. Retrieved from http://www.planalto.gov.br/ ccivil_03/leis/l9394.htm.
Conselho Federal de Contabilidade. (2015). Exame de Sui ciência: Resultado do 1º Exame de 2015 é publicado no DOU. Jornal do CFC, 18(126). Retrieved from http://portalcfc.org.br/ wordpress/wp-content/uploads/2013/01/jornal126_abr_mai_ FIM_web.pdf.
Fávero, L. P. L., Beli ore, P. P., Silva, F. L., & Chan, B. L. (2009). Análise de dados: modelagem multivariada para tomada de decisões. Rio de Janeiro, RJ: Elsevier.
Ferreira, A. C. M. (2011). Satisfação no trabalho de docentes de uma instituição pública de ensino superior: rel exos na qualidade de vida (Master’s Degree). Universidade Federal de Goiás, Goiânia.
Ferreira, A., Demutti, C. M., & Gimenez, P. E. O. (2010). A teoria das necessidades de Maslow: a inl uência do nível educacional sobre a sua percepção no ambiente de trabalho. Anais do Seminários de Administração, São Paulo, SP, Brasil, 13. Ferreira, J. B., Machado, M. L., & Gouveia, O. (2012). A (in)
satisfação dos académicos no ensino superior. Educação, Sociedade & Culturas, 37, 129-139.
Ferreira, M. A. M. (2008). Ciclo de vida, desenvolvimento profi ssional e gestão escolar – uma abordagem biográi ca (Master’s Degree). Universidade Aberta, Lisboa.
Figueiredo, D. B., Filho, & Silva, J. A., Jr. (2010). Visão além do alcance: uma introdução à análise fatorial. Opinião Pública, 16(1), 160-185.
Frase, L. E., & Sorenson. L. (1992). Teacher motivation and satisfaction: impact on participatory management. NASSP Bulletin, 76, 37-43.
Freitas, M. F. P. (2011). Satisfação profi ssional dos enfermeiros especialistas (Master’s Degree). Instituto Politécnico de Viseu, Viseu.
Gall, M. D., Gall, J. P., & Borg, W. R. (2007). Educational research: an introduction (8a. ed.). Boston, MA: Pearson.
Gonçalves, J. A. (1995). A carreira das professoras do ensino primário. In: Nóvoa, A. (Org.). Vida de professores. Porto: Porto Editora.
Gonçalves, J. A. (2009). Desenvolvimento proi ssional e carreira docente – fases da carreira, currículo e supervisão. Sísifo: Revista de Ciências da Educação, 8, 23-36.
Gursel, M., Sunbul, A. M., & Sari, H. (2002). An analysis of burnout and job satisfaction between Turkish head teachers and teachers. European Journal of Psychology of Education, 17, 35-45.
Hair, J. F., Jr., Anderson, R. E., Tatham, R. L.,& Black, W. C. (2005). Análise multivariada de dados (5a. ed.). Porto Alegre, RS: Bookman.
Hering, S. Q. (1996). Motivação dos quadros operacionais para a qualidade sob o enfoque da liderança situacional (Master’s Degree). Universidade Federal de Santa Catarina, Florianópolis.
Herzberg, F. (1987). One more time: how do you motivate employees? Harvard Business Review, Watertown, USA. Retrieved from http://synchronit.com/downloads/freebooks/ herzberg.pdf.
Huberman, M. (1989). Le cycle de vie professionnelle des enseignants secondaires: résumé d’une recherche démentielle. Genève: Cahiers de la Section des Sciences de l’Education: pratiques et théorie, 54.
Huberman, M. (2000). O ciclo de vida proi ssional dos
professores. In: Nóvoa, A. (Org). Vida de professores (2a. ed.). Porto: Porto Editora.
Instituto Nacional de Estudos e Pesquisas Educacionais Anísio Teixeira. (2013). Censo do Ensino Superior. Retrieved from
http://download.inep.gov.br/educacao_superior/censo_ superior/apresentacao/2014/coletiva_censo_superior_2013. pdf.
Jesus, S. N. (1993). A motivação dos professores: estudo exploratório sobre a inl uência da formação educacional e da prática proi ssional. Jornal de Psicologia, 11, 27-30.
Jesus, S. N. (1995). A análise da motivação para a proi ssão docente segundo o modelo da discrepância motivacional: um estudo preliminar. Revista Portuguesa de Educação, 8, 163-180. Jesus, S. N., Abreu, M. V., Santos, E. J. R., & Pereira, A. M. S.
(1992). Estudo dos’ factores de mal-estar na proi ssão docente. Revista Psychologica, 8, 51-60.
Jesus, S. N., & Santos, J. C. V. (2004). Desenvolvimento
Lima, F, D. C., Oliveira, A. C. L., Araújo, T. S., & Miranda, G. J. (2015). O choque com a realidade: dormi contador e acordei professor... Revista Electrónica Iberoamericana Sobre Calidad, Efi cacia y Cambio en Educación, 13, 49-67.
Locke E. A. (1976). h e nature and causes of job satisfaction. In: Dunnette, M. D. (1976). Handbook of industrial and organizational psychology. Chicago (IL): Rand McNally, p. 1297-349.
Martins, G. A., & h eóphilo, C. R. (2007). Metodologia da investigação científi ca para ciências sociais aplicadas. São Paulo, SP: Atlas.
Maslow, A. H. (1943). A theory of human motivation. Revista Psychologica, 50, 370-396.
Megginson, L. C., Mosley, D. C., & Pietri, P. H., Jr. (1986). Administração: conceitos e aplicações. Tradução de Auriphebo Berrance Simões. São Paulo, SP: Harba.
Moretti, G. J. S. (2010). O perfi l e a satisfação no trabalho dos professores dos cursos de graduação em Administração das instituições de cursos superiores privadas da cidade de Ribeirão Preto-SP (Master’s Degree). Universidade de São Paulo, Ribeirão Preto.
Pedro, N. (2011). Auto-ei cácia e satisfação proi ssional dos professores: colocando os construtos em relação num grupo de professores do ensino básico e secundário. Revista de Educação, Lisboa, Portugal, 18(1), 23-47.
Pedro, N., & Peixoto, F. (2006). Satisfação proi ssional e auto-estima em professores dos 2º e 3º ciclos do ensino básico. Revista Análise Psicológica, 24(2), 247-262.
Pinto, F. C. (1996). Mal-estar na docência: o fundo da questão. Revista O Professor, 50(3), 3-8.
Portal Brasil. (2014). Educação:ensino superior registra mais 7,3 milhões de estudantes. Retrieved from http://www.brasil.gov. br/educacao/2014/09/ensino-superior-registra-mais-de-7-3-milhoes-de-estudantes.
Ramos, S. I. V. (2009). (In)satisfação e stress docente. Estudo Geral, [3]1-41. Retrieved on March 2, 2016, from https:// estudogeral.sib.uc.pt/handle/10316/8522.
Sánchez, A. M., & García, J. L. (1997). El clima de las instituciones educativas y la satisfacción laboral de los profesores. Revista de la Escuela de Ciencias de la Educación, 176, 419-436.
Seco, G. M. S. B. (2000). A satisfação na actividade docente (Doctoral h esis). Universidade de Coimbra, Coimbra.
Siegel, S., & Castellan, N. J. (1988). Nonparametric statistics for the behavioral sciences. New York, NY: McGraw-Hill.
Siqueira, M. M. M. (2008). Medidas do comportamento organizacional: ferramentas de diagnóstico de gestão. Porto Alegre, RS: Artmed.
Taveira, I. M. R., & Silva, J. S. (2015). A relação entre a satisfação dos professores e o desempenho dos alunos de Macaé. Anais do Congresso Nacional de Administração e Contabilidade, Rio de Janeiro, RJ, Brasil, 6.
Traldi, M. T. F., & Fiuza, G. D. (2012). Comprometimento, bem-estar e satisfação dos professores de administração de uma universidade federal. Revista Eletrônica de Administração, 2, 290-316.
Veenman, S. (1984). Perceived Problems of Beginning Teachers. Review of Educational Research, Catholic University of Nijmegen, 54(2), 143-178.
Correspondence address:
Tamires Sousa Araújo
Universidade Federal de Uberlândia, Faculdade de Ciências Contábeis Av. João Naves de Ávila, 2121 - Bloco F – CEP: 38400-902