fuzzy set theory
Kleber Pacheco de Castro
Universidade do Estado do Rio de Janeiro / Programa de Pós-Graduação em Ciências Econômicas Rio de Janeiro / RJ — Brazil
José Roberto Rodrigues Afonso
Instituto Brasiliense de Direito Público / Escola de Direito de Brasília Brasília / DF — Brazil
his article proposes a comparative analysis among Brazilian municipalities in order to identify the determinants of the potential and of the ability to collect urban property tax (IPTU) in Brazil. he analysis applied the fuzzy set theory, a pioneer methodological choice in the ield of public inances in Brazil, which has provided unpre-cedented results in terms of property taxation. he results conirmed what analysts and municipal leaders have pointed out for a long time: the majority of Brazilian municipalities do not use their full potential to collect the IPTU — a fact that tends to be more critical in smaller cities, which depend on funding from other spheres of Government. he article breaks new ground in assessing this potential based on a comparative analysis of cities with similar characteristics.
Keywords: taxation; municipal inance; fuzzy analysis; property tax.
IPTU: avaliação de potencial e utilização sob a ótica da teoria dos conjuntos fuzzy
A im de identiicar os determinantes do potencial de arrecadação do imposto sobre propriedade predial e territorial urbana (IPTU) no Brasil, bem como a utilização dessa capacidade, este artigo propõe uma análise comparativa dos municípios brasileiros aplicando a teoria dos conjuntos fuzzy. A aplicação dessa metodologia na área das inanças públicas é pioneira no Brasil, o que proporcionou resultados inéditos em matéria de tributação da propriedade. Os resultados conirmaram o que analistas e até mesmo dirigentes municipais já apontaram há tempos: a maioria dos municípios brasileiros não utiliza todo o seu potencial de arrecadação do IPTU — fato que tende a ser mais crítico nas cidades de menor porte e que dependem mais de recursos de outras esferas de governo. O artigo inova ao mensurar esse potencial a partir de uma análise comparativa entre cidades com semelhantes características. Palavras-chave: tributação; inanças municipais; análise fuzzy; imposto sobre propriedade.
IPTU: evaluación de potencial y el uso bajo la óptica de la teoría de conjuntos fuzzy
Con el in de identiicar los determinantes del potencial de la colección de impuesto sobre bienes inmuebles y territorial urbano en Brasil, así como la exploración de tal capacidad, este artículo propone un análisis compa-rativo de los municipios brasileños mediante la aplicación de la teoría de conjuntos fuzzy. La aplicación de esta metodología en el área de las inanzas públicas es pionera en Brasil, e ha dado resultados sin precedentes sobre los impuestos de propiedad. Los resultados conirmaron lo que los analistas y líderes municipales incluso han señalado hace algún tiempo: la mayoría de los municipios brasileños no utiliza todo su potencial para recaudar IPTU — hecho que tiende a ser más crítico en ciudades más pequeñas y que dependen de fondos desde otras esferas del gobierno. Este artículo innova para medir este potencial basado en un análisis comparativo de las ciudades con características similares.
Palabras clave: impuestos; inanzas municipales; análisis fuzzy; impuesto a la propriedad.
DOI: http://dx.doi.org/10.1590/0034-7612160295
Article received on February 25, 2016 and accepted on July 10, 2017.
[Translated version] Note: All quotes in English translated by this article’s translator.
1. INTRODUCTION
In Brazil, the Urban Property Tax (IPTU) — which is a municipal jurisdiction — is currently going through many challenges. he amount collected sums around R$ 25 billion/year, which in 2014 rep-resented 0.51% of Brazilian GDP (RFB, 2015).
Although it accounts for approximately 1.5% of national tax revenue, IPTU is the second most rejected tax by Brazilians, according to a public opinion poll on national taxes and problems. It is not rare for municipalities to be rejected in court when trying to adjust the tax — as was the case of the largest city in the country, São Paulo, which led to a series of inquiries in other cities.1 Judiciary discussions have generated great repercussions in the media and summed to the widespread criticisms toward the tax as well as to complaints against other actions of public administration, not necessarily related to taxes.
Contrary to the feelings of civil society, preliminary technical analysis evidence that IPTU col-lection would be too low in most of the national territory (De Cesare and Marín, 2008; Bahl, 2009; Sepulveda and Vazquez 2009; Afonso, Araújo and Nóbrega, 2012), regardless of region, size, type or local economy.
Initial estimates indicate that, for all municipalities in the country, revenues from IPTU ac-counted for approximately 19.4% of total tax revenue in 2014. Fiteen years earlier, in 2000, this participation was 27%. However, the national average was not the reality observed in most mu-nicipalities: in approximately half of them, IPTU did not reach 10% of the municipalities’ total self-generated revenue.
Other evidence on the low use of the potential of IPTU can be observed in comparison with other taxes. A little more than 96% of the Brazilian municipalities had an estimated tax collection on Vehicle Property Tax (IPVA) higher than that of IPTU in 2014. he relation obtained between IPTU and the Tax on Service Provided (ISS), and IPTU and Real Estate Transfer Tax (ITBI) was, respectively, 87.7% and 45.9% in the same year. his latter fact draws much attention, since ITBI should be residual to IPTU. Yet, even a state capital (João Pessoa, PB) collected more ITBI than IPTU.
In this context, it is worth questioning if there is potential for IPTU collection and whether this potential is actually used by Brazilian municipalities. In addition, which municipalities in the country best use their ability to collect IPTU.
In order to answer these questions and subsidize the debate on real estate taxes in Brazil — to identify opportunities and challenges for better use of IPTU as a source of inancing the cities, con-sidering it is a tax adopted in more than 5,500 Brazilian municipalities — this article evaluates the municipalities potential of IPTU collection, and their ability to collect IPTU. he diagnosis seeks to quantify and relativize several variables (tax and socioeconomic) that directly contribute to determine the potential of the tax, and the cities’ capacity to collect it.
Understanding the factors that contribute to the great diversity of municipalities in Brazil is fundamental for any evaluation on IPTU. he determining element of the fair use of this tax in a municipality may lie in explanations that go beyond simple political will. Among the factors that should be considered are the size of the economy, proximity to the population (voters),
trative deiciencies, legislation and low need to generate own resources. In a country characterized by deep disparities, there is no single explanation for the diferent levels of capacity to collect local taxes, and therefore, there is no single model to be followed in order to boost revenues in municipalities.
2. METHODOLOGY
he methodology adopted is grounded on the fuzzy set theory. his is a theory developed by Za-deh (1965) that aims at using “degrees of truth” in order to deal with situations in a mathematical way. Fuzzy functions assign real numbers, located in the interval between [0.1], to truth degrees of statements — something which is neither deinitely true (1) nor deinitely false (0) could have an intermediate truth value (between 0 and 1).
his theory, like others from the broader set of the “degree of truth theories”, aims at formalizing situations (concepts, phenomena, statements) which are ambiguous and inaccurate. In time, it even-tually attracted economists’ interest in quantifying poverty. here are plenty of Brazilian academic works that use this methodology to determine multidimensional poverty, inequality and human development (Chiappero-Martinetti, 2000; Lelli, 2001; Baliamoune-Lutz, 2004; Lopes, 2003; Fonse-ca, 2003; Castro, Kerstenetzky and Del-Vecchio, 2010). he application of this theory, in the case of poverty estimation, would be justiied because poverty is an inexact phenomenon. hus, such theory would allow classifying families in two categories: “poor” and “not poor”. his tool is commonly used in regional economic analyses in Brazil (Simões, 2003; Cechini et al., 2012), and can be easily adapted to this study.
Just as poverty, both the potential and the capacity to collect IPTU are imprecise phenomena. It is not feasible to point out a given municipality as capable or incapable of colleting a particular tax. What can be attributed to that municipality is an intermediate classiication between full incapacity (0) and full capacity (1). he fuzzyset theory is used as a method for quantifying imprecise situa-tions, and the imprecision of the studied phenomenon is recognized and made explicit. his is the case presented here.
he adoption of this tool is justiied by a large number of theoretical references and practical applications. Moreover, its application in the ield of public inance and taxation — at least in Brazil — may be considered pioneering, bringing innovation to studies on these issues.
2.1 SELECTED INDICES
Infor-mation Proile (IBGE). All data were collected in 2014, except for the number of properties, which was obtained from the Demographic Census of 2010 (IBGE):
1. Primary variables a. Population
b. Current Budgetary Revenue R$ (BRL) c. Current Revenue from Taxes R$ d. Current IPTU collected R$ e. Current Transfer of IPVA R$ f. Current ITBI collected R$
g. Index of Municipalities Participation in ICMS (IMP) h. Number of properties
2. Derived indicators
a. Current IPTU per capita R$ b. IPTU/Revenue
c. Current IPVA per capita R$ d. Current ITBI per capita R$
e. Tax revenue/Budgetary revenue (%)
f. Index of Municipalities Participation in ICMS (IMP) g. Number of properties
In order to cover the three aforementioned dimensions to be used in this study (usage regarding the tax collection, potential of collection, and use of capacity), the derived indicators were used in a diferentiated way. herefore, three fuzzy indices were constructed in order to reach the dimensions. For the fuzzy index of the usage in terms of tax collection, only the derived indicators “a” (IPTU per capita) and “b” (IPTU/Revenue) were used. For the fuzzyindex of potential of collection, the derived indicators “c” (IPVA per capita), “d” (ITBI per capita), “e” (Revenue from Taxes/Budgetary Revenue), “f ” (IPM) and “g” (number of properties) were used. Finally, for the fuzzy index of use of the potential — which is a relation between fuzzy index of the usage and fuzzy index of potential of collection — all derived indicators were used.
2.2 SELECTED MUNICIPALITIES AND CRITERIA TO FORM GROUPS
Considering the comprehensive nature of this study, all existing municipalities in Brazil in 2014 should have been included for analysis. However, the main data source — Finbra — does not present data for all municipalities, only part of them. his partial sample, however, is very inclusive as it covers almost the entire national population. Between the years 2000 and 2013, for example, Finbra covered an average of 96.9% of all Brazilian municipalities, together with 98.3% of the country’s population. In 2014, Finbra covered 4,978 of 5,570 Brazilian municipalities, or about 89.4 % of all municipalities in Brazil. he other sources of data used for this study were made compatible with the restriction imposed by Finbra.
Despite the good quality of the initial sample, a ilter was applied in order to avoid gross errors and problems in the construction of derived indicators. herefore, municipalities that presented null value (zero or non-existent) for any of the primary variables were excluded from the database. his iltering procedure reduced the sample of municipalities to 4,515 (81% of the total).
It is important to highlight that municipalities were organized in groups of analysis in order to build and analyze fuzzyindices. Municipalities were divided according to the size of their population in six large groups (up to 10,000 inhabitants; between 10,001 and 20,000 inhabitants; between 20,001 and 50,000 inhabitants; between 50,001 and 100,000 inhabitants; between 100,001 and 500,000 in-habitants; and inally, over 500,000 inhabitants). his methodological procedure was conducted in order to reduce the distance between municipalities with very contrasting characteristics.2
2.3 CALCULATION OF FUZZY INDICES
Fuzzy indices were built from data collected from the sources presented previously, using the fol-lowing basic formula:
xi,j = Nj – Minj , 1 < j < 7; 1 < i < 4.515
Maxj – Minj
xij = value of the fuzzyindex for the indicator j calculated by the municipality i; Nj = observed value of the indicator’s series j for the municipality i;
Minj = minimum value of the indicator’s series j;
Maxj = maximum value of the indicator’s series j.
his formula was used directly in two of the three aggregate fuzzy indices proposed in this article. In the case of aggregate fuzzy index of usage (Ifau) and the aggregate fuzzy index of potential (Ifap), all indicators have a positive relation, making this formula suicient for the calculation. As for the aggregate fuzzy index of use of capacity (Ifauc), it is much simpler and is reduced to the relation between the results of the irst two aggregate indices (index of use divided by the index of potential).
2 During the research, other criteria to group municipalities were considered, such as HDI and geographic location. he choice for
Example 1: fuzzy index for IPTU per capita (in building the aggregate fuzzy index of usage) of the city of Rio de Janeiro.
Nj = 310,24 Minj = 42,98
Maxj = 501,33
xi,j = 310,24 – 42,98 ≅ 0,5831 501,33 – 42,98
Example 2: Fuzzy index for ITBI per capita (in building the aggregate fuzzy index of potential) in the city of Rio de Janeiro.
Nj = 114,92 Minj = 17,62
Maxj = 169,35
xi,j = 114,92 – 17,62 ≅ 0,6413 169,35 – 17,62
Chart 1 shows the relation between the selected indicators and the aggregate fuzzy indices.
CHART 1 RELATION BETWEEN VARIABLES AND AGGREGATE INDICES
Aggregate Fuzzy
Variable Usage Potential Use of Capacity
IPTU per capita + +
IPTU/Budgetary Revenues + +
IPVA per capita +
-ITBI per capita +
-Revenues from Taxes/Budgetary -Revenues +
-IPM +
-Number of properties +
-Source: Elaborated by the authors.
he following ive indicators show positive relation with the aggregate fuzzy index of potential and negative relation with the aggregate fuzzy index of use of capacity. he indicators were taken as proxy for diferent dimensions of municipal inances.
IPVA was taken as a proxy for the ability to collect property taxes. In other words, the greater the transfer/collection of IPVA, the greater the “willingness” (i.e. capacity) of local taxpayers to pay IPTU and, consequently, ceteris paribus the lower the use of capacity.
ITBI was used as proxy for the size of the local real estate market — both from the point of view of movement/transfers and real estate values. hat is, the higher the ITBI collection, the greater the potential of IPTU collection and, consequently, ceteris paribus the lower the use of capacity.
he ith variable (Revenue from Taxes/Budgetary Revenue) was used as a proxy for “iscal au-tonomy”, which means, the capacity of the municipality to generate its own resources. he higher this indicator, the greater the capacity of the municipality to present good administration of the tax (raising its potential) and consequently ceteris paribus the lower the use of capacity.
IPM was chosen as a proxy for economic activity or creation of added value in the municipality. hus, the higher the income generation in the municipality, the greater the ability of local agents to pay taxes (including IPTU), and consequently, ceteris paribus the lower the use of capacity.
he number of properties was used to measure the units that can be taxed. If the number of properties is higher, the greater the possibility of IPTU collection and, consequently, ceteris paribus the lower the use of capacity.
he indices built from the basic formula vary from 0 (zero) to 1 (one), where 0 (zero) corresponds to the index of the municipality that presents the lowest value for a given indicator in the population group, and 1 (one) corresponds to the index of the municipality that presents the highest value for a given indicator in the population group.
It should be noted that this “degree of truth” index, because using the maximum of each indicator as the denominator, implies the risk of being afected by outliers. Zeros were considered gross errors and were excluded. Eventual errors in the higher values may afect the indices of each indicator and, consequently, the aggregate indices.
2.4 INDICATORS’ WEIGHT
he construction of aggregate fuzzy indices depends on the aggregation of the individual fuzzy indices, obtained from each variable analyzed alone. However, in order to proceed with the aggregation, it is necessary to observe the participation of each of the individual fuzzy indices in the inal composition. In other words, to obtain the indicators’ weight.
here are two options when it comes to attributing weights: arbitration and mathematical instru-ments. Although some studies using the fuzzy set methodology adopt a more subjective concept for attributing weights (Barros, Carvalho and Franco, 2006; Carvalho, Kerstenetzky and Del-Vecchio, 2007), for this research mathematical instruments were used.
relevance of the iscal situation of the municipality is the comparison with the other municipalities. A hierarchy is obtained by simple comparison.
Based on this, the indicators’ weights are calculated weighted by the population size of the mu-nicipalities and based on the following formula:
wj = ln
[
n]
Σ
xi,j ni i =1n
xi,j = value of the fuzzy index for indicator j calculated for municipality I; n = total population;
ni = municipality population i.
Example: weight of indicator IPVA per capita (in building the aggregate fuzzy index of potential).
n= 180.583.711
wj = ln
[
180.583.711]
Σ
xi,j ni i =1 4.515x1,jn1 = 0,22 × 822 x2,jn2 = 0,05 × 1.000 (...)
x4.515,jn4.515 = 0,76 × 11.895.893
wj = ln
[
180.583.711]
≅ 1,17 56.203.907In general, the idea of attributing weight based on this formula is to avoid that individual indices with higher values gain inluence in the aggregated result, which could happen in a choice of weight by arbitrage.
Based on this attribution of weights, which allows a complete order (avoiding that two indicators present the same weight), the classiication is obtained and presented in table 1.
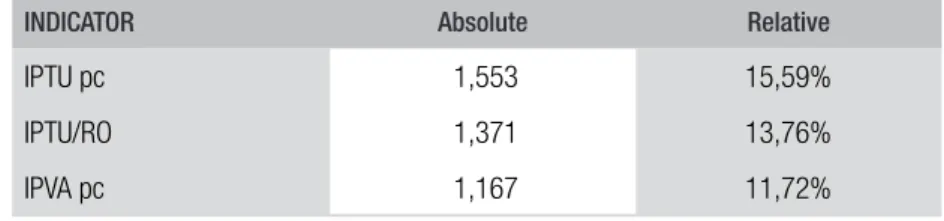
TABLE 1 WEIGHT OF INDIVIDUAL INDICATORS FORMING THE USE OF CAPACITY INDEX (2014)
INDICATOR Absolute Relative
IPTU pc 1,553 15,59%
IPTU/RO 1,371 13,76%
IPVA pc 1,167 11,72%
INDICATOR Absolute Relative
ITBI pc 1,540 15,46%
RT/RO 1,191 11,95%
IPM 2,206 22,14%
N. Imóveis 0,935 9,38%
Source: Elaborated by the authors. Primary sources: Finbra/STN; IBGE.
2.5 AGGREGATION OF FUZZY INDICES
For a more accurate comparison of the context of IPTU among municipalities, it is necessary to aggregate the seven indicators selected into another indicator (in this case, three other indicators), which would be the general representative of the dimension to be captured by the aggregate indicator (usage, potential and use of capacity).
he aggregation is calculated using the fuzzy indices of each variable (individual indices) and the weights of those variables. It is only a weighted average of the fuzzy indices, as observed in the following formula:
μi =
[
Σ
xi,j wj j =1n
]
Σ
wj j =1n
xi,j = value of the fuzzy índex for indicator j calculated for municipality i; wj = weight of indicator j.
Example: aggregate fuzzy index of potential of Rio de Janeiro
μi =
[
Σ
xi,j wj j =15
]
Σ
wj j =15
xi,1w1 = 0,32 × 1,17 xi,2w2 = 0,64 × 1,54 (...)
xi,5w5 = 0,56 × 0,93
μi =
[
3,257,04]
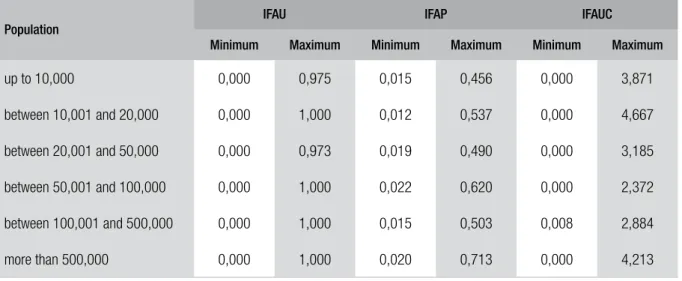
≅ 0,46number of indicators selected in this study is not considered high (seven), the closest results of 0 (zero) and 1 (one) indings are presented in table 2.
TABLE 2 MINIMUM AND MAXIMUM OF AGGREGATE FUZZY INDICES (2014)
Population
IFAU IFAP IFAUC
Minimum Maximum Minimum Maximum Minimum Maximum
up to 10,000 0,000 0,975 0,015 0,456 0,000 3,871
between 10,001 and 20,000 0,000 1,000 0,012 0,537 0,000 4,667
between 20,001 and 50,000 0,000 0,973 0,019 0,490 0,000 3,185
between 50,001 and 100,000 0,000 1,000 0,022 0,620 0,000 2,372
between 100,001 and 500,000 0,000 1,000 0,015 0,503 0,008 2,884
more than 500,000 0,000 1,000 0,020 0,713 0,000 4,213
Source: Elaborated by the authors. Primary sources: Finbra/STN; IBGE.
As observed in table 2 and will be noted throughout the article, only the aggregate fuzzy index of use of capacity can vary beyond 1 (one), because it is a mathematical relationship between the aggregate fuzzy index of usage and the aggregate fuzzy index of potential. Whenever the former is greater than the latter, the result will be an aggregate fuzzy index of use of capacity higher than 1 (one). Another important point is the fact that the minimum and the maximum of the aggregate fuzzy index of usage are almost always in the extremes (respectively 0 (zero) and 1 (one)). Since this index is composed of only two indicators (related to each other), it increases the possibility of the same municipality be the worst or the best in both dimensions that make up the index.
3. RESULTS ANALYSIS
Analysis was conducted to understand the municipalities’ behavior regarding housing tax (IPTU) collection. he analysis was carried out both in an aggregated and individualized way, by observing the behavior of a speciic city or a predetermined group.
3.1 AGGREGATE RESULTS AND DESCRIPTIVE STATISTICS
Regarding the descriptive statistics obtained from aggregate results, it is possible to observe that some of the indicators’ behaviors are common among these results.
A methodological aspect afecting the analysis of aggregate results is the impossibility of comparing diferent groups of municipalities. he groups were formed according to population. For instance, it is not recommended to compare the average Ifau (acronym in Portuguese for Aggregate Usage Fuzzy Index) and Ifap (acronym in Portuguese for Aggregate Potential Fuzzy Index) of municipalities with a populations of more than 500,000 inhabitants with the average of municipalities of a maximum population of 10,000 inhabitants. his limitation is reasonable since it is not important to compare a rich, well-developed city with a small one with fewer re-sources and serious social deiciencies. However, this is not the main explanation for not making such comparison, but the methodology of the study itself. he two aggregate indices — Ifau and Ifap — were calculated from an intragroup comparison, rather than intergroup. In other words, for each group, the municipalities with the best performance in the individual indicators within that group, served as references (benchmark) for the calculation. hus, diferent municipalities serve as a reference in each group.
he comparability limitation is applicable to both Ifau and Ifap, and can be more lexible for Ifauc (acronym in Portuguese for aggregate usage capacity fuzzy index). Ifauc is the index object of this study and it seeks to measure how a municipality is using its capacity to collect IPTU. he study observes how each group takes advantage of its potential tax collection. For example, the group of municipalities with a population between 50,001 and 100,000 inhabitants uses an average of 40% of its potential to collect IPTU (Ifauc = 0,40), whereas the group of municipalities with a population of up to 10,000 inhabitants uses 21% of its potential to collect IPTU (Ifauc = 0.21). In this case, the former group uses its potential better than the latter.
Another common feature of the statistics is the fact that the averages of both Ifau and Ifap are relatively higher in the groups that have fewer municipalities. hat is, a negative relation between the mean value of the aggregate index (Ifau or Ifap) and the number of municipalities in that group was identiied. he only explanation for this result is better performance among the members of the group with higher indices, observing that this is a remarkable feature within the municipalities with a population of over 500,000 inhabitants. In other words, evidence shows that the highest average index value for these groups is explained by the greater efort of these groups to collect more IPTU (Ifau) and by their greater potential for collecting the tax due to a more favorable socioeconomic environment (Ifap). However, this relation is not as clear when comparing two similar groups (pop-ulations with similar characteristics).
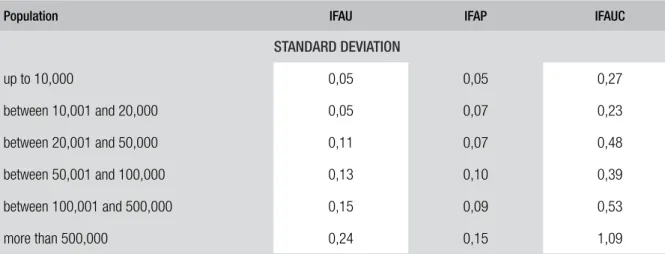
he standard deviation in the aggregate indices is high, vis-à-vis the averages, which provide a reasonable degree of uncertainty to the data series. Two normality tests (Anderson and Darling, 1952; Shapiro and Wilk, 1965) were applied to group data and the result was always negative, which indicates that the “normal distribution” is not applicable to the data of this research. his high dispersion (and uncertainty) can be explained by two reasons: the municipalities are very diferent which does not permit that their indices have a low variance; and the data from ‘Finbra’ are prone to errors, especially those of the small municipalities, which can accentuate the diferences.
he maximum (or the minimum) values of Ifap hardly ever reach 1 (one) or 0 (zero), since it is highly unlikely that a municipality gets its best (or worst) result in all individual indices within its own analysis group. In the case of Ifau, this possibility is considerably higher, since it is composed of only two individual indices. hus, for a municipality to reach 01 (one) on Ifau, for instance, it should present its best results of IPTU per capita and IPTU/Revenue. For Ifap, 01 (one) would only be possi-ble if a municipality presented the best result for indices for IPVA (vehicle tax) per capita, ITBI (real estate transfer tax) per capita, Tax Revenue/ Budget Revenue, IPM (transfers from state taxes) and amount of real estate. If the coincidence of results does not seem to be improbable for Ifau, in the case of Ifap, a municipality would only achieve all these requirements by chance. Table 2 reveals that Ifau has maximums and minimums in both end positions of the table, 1 (one) and 0 (zero), respectively. his cannot be observed for Ifap.
In the case of Ifauc, results higher than 1 (one) were common. In fact, this was evidenced in various municipalities of the sample analyzed. he interpretation for this result indicates these municipalities present an “over-exploration” of their capacities. he fact that there are municipal-ities that have an index higher than 1 (one) is not a problem at irst because it is a mathematical equation that uses two other indices which are built in a relative way (that is, a comparison between municipalities).
In any case, it is not acceptable that something is “producing” beyond its capacity. Statistically, this can be the result of a random event or even an error. In practice, the results might suggest that a municipality has considerably increased its IPTU levy in a speciic year in order to correct a lag of many years, however, that adjustment was overestimated (above the municipality capacity). Another possibility is the so-called summer cities, in which there are many properties (vacant almost all year) and little economic activity.
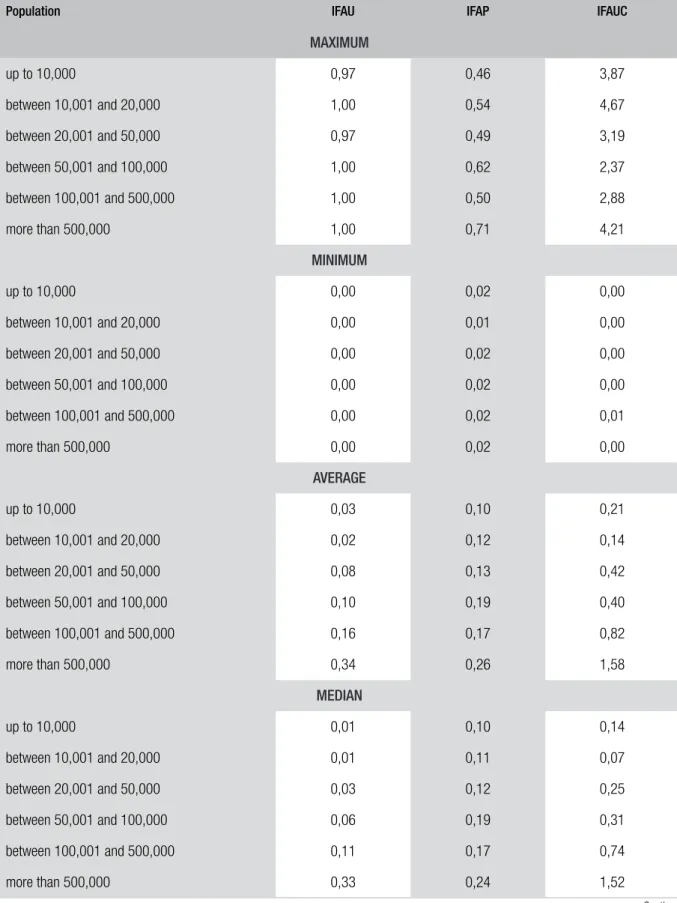
TABLE 3 DESCRIPTIVE STATISTICS OF AGGREGATE FUZZY INDICES PER POPULATION (2014)
Population IFAU IFAP IFAUC
MAXIMUM
up to 10,000 0,97 0,46 3,87
between 10,001 and 20,000 1,00 0,54 4,67
between 20,001 and 50,000 0,97 0,49 3,19
between 50,001 and 100,000 1,00 0,62 2,37
between 100,001 and 500,000 1,00 0,50 2,88
more than 500,000 1,00 0,71 4,21
MINIMUM
up to 10,000 0,00 0,02 0,00
between 10,001 and 20,000 0,00 0,01 0,00
between 20,001 and 50,000 0,00 0,02 0,00
between 50,001 and 100,000 0,00 0,02 0,00
between 100,001 and 500,000 0,00 0,02 0,01
more than 500,000 0,00 0,02 0,00
AVERAGE
up to 10,000 0,03 0,10 0,21
between 10,001 and 20,000 0,02 0,12 0,14
between 20,001 and 50,000 0,08 0,13 0,42
between 50,001 and 100,000 0,10 0,19 0,40
between 100,001 and 500,000 0,16 0,17 0,82
more than 500,000 0,34 0,26 1,58
MEDIAN
up to 10,000 0,01 0,10 0,14
between 10,001 and 20,000 0,01 0,11 0,07
between 20,001 and 50,000 0,03 0,12 0,25
between 50,001 and 100,000 0,06 0,19 0,31
between 100,001 and 500,000 0,11 0,17 0,74
more than 500,000 0,33 0,24 1,52
Population IFAU IFAP IFAUC
STANDARD DEVIATION
up to 10,000 0,05 0,05 0,27
between 10,001 and 20,000 0,05 0,07 0,23
between 20,001 and 50,000 0,11 0,07 0,48
between 50,001 and 100,000 0,13 0,10 0,39
between 100,001 and 500,000 0,15 0,09 0,53
more than 500,000 0,24 0,15 1,09
Source: Elaborated by the authors. Primary sources: Finbra/STN; IBGE.
Another relevant aspect is the fact that the maximum Ifauc index is very high in municipalities of smaller populations (group of municipalities with up to 10,000 inhabitants and the group of mu-nicipalities with a population between 10,001 and 20,000 inhabitants). hey reach values of 3.87 and 4.67, respectively, which are results very close to those of municipalities with a population of more than 500,000 inhabitants (4.21). As these are relative indicators, the aforementioned results can be explained by the fact that it is easier to stand out against “weaker competitors” than stronger ones. In other words, in a group that uses little of its potential, any municipality that has a good performance in collecting tax would stand out from others.
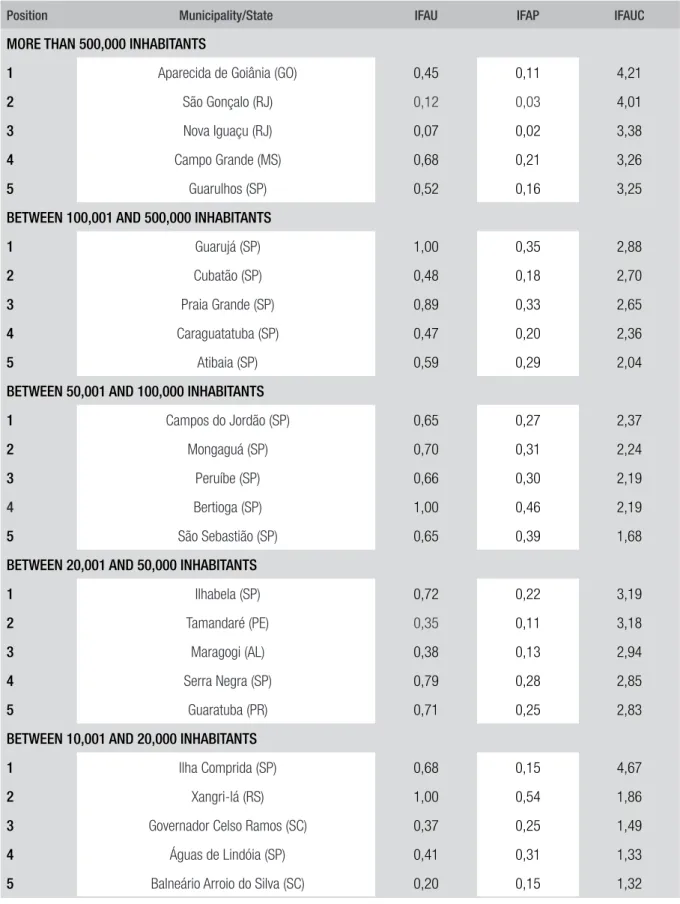
3.2 IFAUC RANKING OF MUNICIPALITIES
he ranking of data that is presented below used Itauc, which is the main index and object of this study. Although the results of the other two indices are presented in the table, they are considered informative data and are not relevant to the classiication of municipalities.
As well as presenting and briely analyzing the data, whenever it is possible (depending on the availability of information), some characteristics of the municipalities that had the most positive results in the rankings will be highlighted. his helps to understand the reasons why a municipality managed to achieve good results within its analysis group.
TABLE 4 RANKING OF THE FIVE MUNICIPALITIES WITH HIGHEST IFAUC — PER POPULATION (2014)
Position Municipality/State IFAU IFAP IFAUC
MORE THAN 500,000 INHABITANTS
1 Aparecida de Goiânia (GO) 0,45 0,11 4,21
2 São Gonçalo (RJ) 0,12 0,03 4,01
3 Nova Iguaçu (RJ) 0,07 0,02 3,38
4 Campo Grande (MS) 0,68 0,21 3,26
5 Guarulhos (SP) 0,52 0,16 3,25
BETWEEN 100,001 AND 500,000 INHABITANTS
1 Guarujá (SP) 1,00 0,35 2,88
2 Cubatão (SP) 0,48 0,18 2,70
3 Praia Grande (SP) 0,89 0,33 2,65
4 Caraguatatuba (SP) 0,47 0,20 2,36
5 Atibaia (SP) 0,59 0,29 2,04
BETWEEN 50,001 AND 100,000 INHABITANTS
1 Campos do Jordão (SP) 0,65 0,27 2,37
2 Mongaguá (SP) 0,70 0,31 2,24
3 Peruíbe (SP) 0,66 0,30 2,19
4 Bertioga (SP) 1,00 0,46 2,19
5 São Sebastião (SP) 0,65 0,39 1,68
BETWEEN 20,001 AND 50,000 INHABITANTS
1 Ilhabela (SP) 0,72 0,22 3,19
2 Tamandaré (PE) 0,35 0,11 3,18
3 Maragogi (AL) 0,38 0,13 2,94
4 Serra Negra (SP) 0,79 0,28 2,85
5 Guaratuba (PR) 0,71 0,25 2,83
BETWEEN 10,001 AND 20,000 INHABITANTS
1 Ilha Comprida (SP) 0,68 0,15 4,67
2 Xangri-lá (RS) 1,00 0,54 1,86
3 Governador Celso Ramos (SC) 0,37 0,25 1,49
4 Águas de Lindóia (SP) 0,41 0,31 1,33
5 Balneário Arroio do Silva (SC) 0,20 0,15 1,32
Position Municipality/State IFAU IFAP IFAUC
UP TO 10,000 INHABITANTS
1 Barra de São Miguel (AL) 0,72 0,19 3,87
2 Arroio do Sal (RS) 0,97 0,28 3,46
3 Águas de São Pedro (SP) 0,84 0,26 3,17
4 Centenário (TO) 0,12 0,05 2,43
5 Funilândia (MG) 0,24 0,10 2,39
Source: Elaborated by the authors. Primary sources: Finbra/STN; IBGE.
Of the six municipalities highlighted above, only one is not a tourist destination: Aparecida de Goiânia (GO). his is not a fact that resulted from mere chance since municipalities that welcome a great number of visitors also have a great number of underused properties (these properties are va-cant for most of the year). herefore, the political cost of the mayor in adopting a more rigid taxation policy (higher taxes and higher values of land as source of calculation of tax) in those municipalities is lower than it is in municipalities that do not have this characteristic. As all holiday homes are usually located in noble regions and neighborhoods, there is a possibility for the collecting of housing tax to be concentrated on this kind of real estate, without any loss of signiicant “electoral power”. hat is, the loating population who do not vote in the tourist destination end up paying most of the tax.
Reairming the vocation of these ive locations, IBGE (Brazilian Institute of Geography and Statis-tics) uses a tool called “Cidades” that shows that tourism is an essential activity in the aforementioned municipalities. Guarujá, Ilhabela, Ilha Comprida (considered to be a beach resort by the Govern-ment of the State of São Paulo) and Barra de São Miguel focus on beach tourism. Campos do Jordão (considered to be ‘climatic resort’ by the Government of São Paulo) focuses on mountain tourism.
In the case of Aparecida de Goiânia (GO), the good result can be linked to the recent eforts of the local city hall in improving IPTU tax collection. Good examples of these eforts are Municipal Law no 2.929/2010 (Establishes a campaign that stimulates collection and payment of debts regarding IPTU and ITU), as well as the implementation of ITU3 as a progressive tax, in which the land owner is notiied to build on the land or to pay higher taxes that may increase over time.
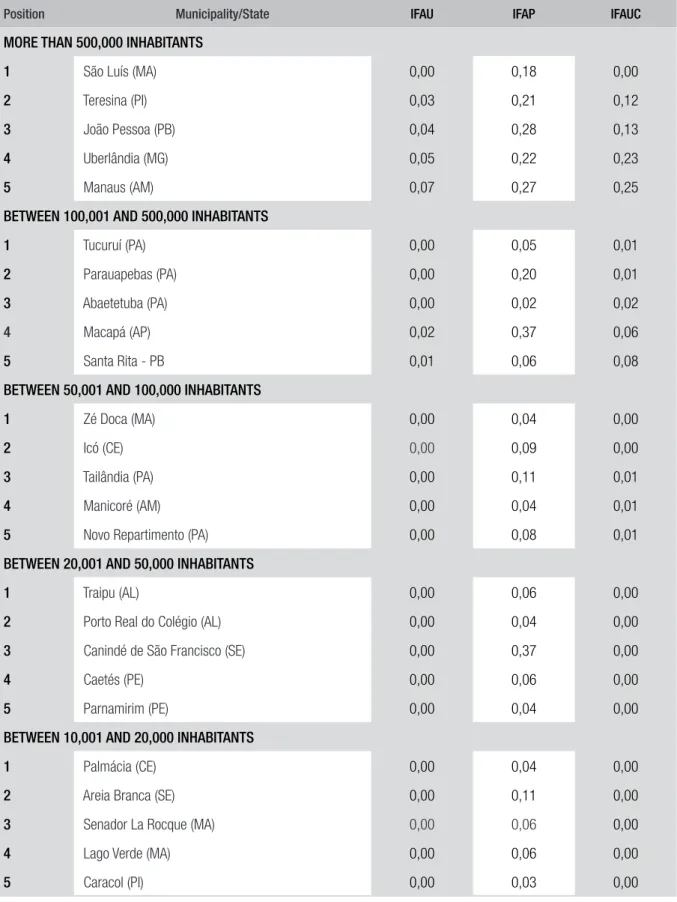
he following table shows the ranking for the ive municipalities with the worst Ifauc per pop-ulation in the year of 2014. he municipalities that negatively stood out from others were: São Luís (MA) — in the group of municipalities with a population of more than 500,000 inhabitants; Tucuruí (PA) — in the group of municipalities with a population between 100,001 and 500,000 inhabitants; Zé Doca (MA) — in the group of municipalities with a population between 50,001 and 100,000 in-habitants; Traipu (AP) — in the group of municipalities with a population between 20,001 and 50,000 inhabitants; Palmácia (CE) — in the group of municipalities with a population between 10,001 and 20,000 inhabitants; and Caridade do Piauí (PI) — in the group of municipalities with a population below 10,001inhabitants.
TABLE 5 RANKING OF THE FIVE MUNICIPALITIES WITH LOWEST IFAUC — PER POPULATION (2014)
Position Municipality/State IFAU IFAP IFAUC
MORE THAN 500,000 INHABITANTS
1 São Luís (MA) 0,00 0,18 0,00
2 Teresina (PI) 0,03 0,21 0,12
3 João Pessoa (PB) 0,04 0,28 0,13
4 Uberlândia (MG) 0,05 0,22 0,23
5 Manaus (AM) 0,07 0,27 0,25
BETWEEN 100,001 AND 500,000 INHABITANTS
1 Tucuruí (PA) 0,00 0,05 0,01
2 Parauapebas (PA) 0,00 0,20 0,01
3 Abaetetuba (PA) 0,00 0,02 0,02
4 Macapá (AP) 0,02 0,37 0,06
5 Santa Rita - PB 0,01 0,06 0,08
BETWEEN 50,001 AND 100,000 INHABITANTS
1 Zé Doca (MA) 0,00 0,04 0,00
2 Icó (CE) 0,00 0,09 0,00
3 Tailândia (PA) 0,00 0,11 0,01
4 Manicoré (AM) 0,00 0,04 0,01
5 Novo Repartimento (PA) 0,00 0,08 0,01
BETWEEN 20,001 AND 50,000 INHABITANTS
1 Traipu (AL) 0,00 0,06 0,00
2 Porto Real do Colégio (AL) 0,00 0,04 0,00
3 Canindé de São Francisco (SE) 0,00 0,37 0,00
4 Caetés (PE) 0,00 0,06 0,00
5 Parnamirim (PE) 0,00 0,04 0,00
BETWEEN 10,001 AND 20,000 INHABITANTS
1 Palmácia (CE) 0,00 0,04 0,00
2 Areia Branca (SE) 0,00 0,11 0,00
3 Senador La Rocque (MA) 0,00 0,06 0,00
4 Lago Verde (MA) 0,00 0,06 0,00
5 Caracol (PI) 0,00 0,03 0,00
Position Municipality/State IFAU IFAP IFAUC
UP TO 10,000 INHABITANTS
1 Caridade do Piauí (PI) 0,00 0,05 0,00
2 Senador Elói de Souza (RN) 0,00 0,08 0,00
3 Salto da Divisa (MG) 0,00 0,09 0,00
4 Lagoa de Pedras (RN) 0,00 0,09 0,00
5 Cajazeiras do Piauí (PI) 0,00 0,04 0,00
Source: Elaborated by the authors. Primary sources: Finbra/STN; IBGE.
he analysis of this ranking are limited to two of the aforementioned groups: municipalities with more than 500,000 inhabitants; and municipalities with a population between 100,001 and 500,000 inhabitants. he other three groups have several municipalities that are in the last position with re-sults close to 0 (Zero).
Within the group of municipalities with a population of more than 500,000 inhabitants, the city of São Luís stood out negatively for presenting quite modest indices (Ifau) for collection of IPTU (together, they represent approximately 11% of the best results in the group) compared to its (only) reasonable potential for tax collection (Ifap).
Tucuruí (PA) was ranked in last position for Ifauc in the group of municipalities with a population between 100,001 and 500,000 inhabitants. his result can be explained by low indices for the collec-tion of IPTU — all of them very close to 0 (Zero). In addicollec-tion to that, the city had an unsatisfactory potential (approximately 9.3% of the group’s highest potential), which indicates that there is still space for improving the collection of urban property tax (IPTU), but in a moderate way.
3.3 VISUAL ANALYSIS OF THE IPTU COLLECTION
In order to increase the perception of the number of municipalities which are not exploring IPTU adequately, dispersion graphs — which relate the positioning of each municipality according to Ifau and Ifap — are presented in this section. Interpreting these graphs is quite simple: in a good scenario, a municipality that manages to use all its potential for collecting IPTU would reach the exact same value for both Ifau and Ifap, obtaining 01 as Ifauc value. his situation is represented by the diagonal line that crosses the plot area, starting from 0.0 and reaching 1.1. If the municipality is located on this line, it is classiied as “eicient”.4
However, a municipality would be on this line only by coincidence. he most common situation is when a location is positioned either above or below the line. Since Ifau is located on the x-axis (horizontal) and Ifap is located on the y-axis (vertical), any municipality positioned above the line would be in a situation in which Ifau is lower than Ifap, meaning that this municipality is “ineicient”. Similarly, any municipality positioned below the line would be in a situation in which Ifau is higher than Ifap, meaning that this municipality is “super eicient”.
Graphs 1 to 6 show each municipality’s behavior between Ifau and Ifap per population.
4 his study does not aim at discussing the concept of eiciency mainly because it can be understood in many diferent ways. his term,
GRAPH 1 IFAU X IFAP — MUNICIPALITIES WITH A POPULATION OF OVER 500,000 INHABITANTS (2014)
Agg
regate Fyzzy Inde
x of Potential
Aggregate Fyzzy Index of Usage
1,0
0,9
0,8
0,7
0,6
0,5
0,4
0,3
0,2
0,1
0,0
0,0 0,2 0,4 0,6 0,8 1,0
Source: Elaborated by the authors. Primary sources: Finbra/STN; IBGE.
GRAPH 2 IFAU X IFAP — MUNICIPALITIES WITH A POPULATION BETWEEN 500,000 AND 100,001 INHABITANTS (2014)
Agg
regate Fyzzy Inde
x of Potential
Aggregate Fyzzy Index of Usage
1,0
0,9
0,8
0,7
0,6
0,5
0,4
0,3
0,2
0,1
0,0
0,0 0,2 0,4 0,6 0,8 1,0
GRAPH 3 IFAU × IFAP — MUNICIPALITIES WITH A POPULATION BETWEEN 10,000 AND 50,001 INHABITANTS (2014)
Agg
regate Fyzzy Inde
x of Potential
Aggregate Fyzzy Index of Usage
1,0
0,9
0,8
0,7
0,6
0,5
0,4
0,3
0,2
0,1
0,0
0,0 0,2 0,4 0,6 0,8 1,0
Source: Elaborated by the authors. Primary sources: Finbra/STN; IBGE.
GRAPH 4 IFAU X IFAP — MUNICIPALITIES WITH A POPULATION BETWEEN 20,001 AND 50,000 INHABITANTS (2014)
Agg
regate Fyzzy Inde
x of Potential
Aggregate Fyzzy Index of Usage
1,0
0,9
0,8
0,7
0,6
0,5
0,4
0,3
0,2
0,1
0,0
0,0 0,2 0,4 0,6 0,8 1,0
GRAPH 5 IFAU X IFAP — MUNICIPALITIES WITH A POPULATION BETWEEN 10,001 AND 20,000 INHABITANTS (2014)
Agg
regate Fyzzy Inde
x of Potential
Aggregate Fyzzy Index of Usage
1,0
0,9
0,8
0,7
0,6
0,5
0,4
0,3
0,2
0,1
0,0
0,0 0,2 0,4 0,6 0,8 1,0
Source: Elaborated by the authors. Primary sources: Finbra/STN; IBGE.
GRAPH 6 IFAU × IFAP — MUNICIPALITIES WITH A POPULATION OF UP TO 10,000 INHABITANTS (2014)
Agg
regate Fyzzy Inde
x of Potential
Aggregate Fyzzy Index of Usage
1,0
0,9
0,8
0,7
0,6
0,5
0,4
0,3
0,2
0,1
0,0
0,0 0,2 0,4 0,6 0,8 1,0
he graphs make it clear that there is a progression of the relative number of ineicient munici-palities as their size, in terms of population, decreases. In the group of more populated municimunici-palities, however, only 37% are located in the graph’s ‘ineicient zone’. In the group of municipalities with a population of up to 10,000 inhabitants, approximately 95.8% are above the line (ineicient). Out of the 1,957 in this group, only 30 were classiied as eicient (or super eicient). he previous group (10,001 to 20,000 inhabitants) presented an even worse percentage of ineiciency (99%). Nevertheless, there is a general tendency for it to get worse as the municipality population decreases.
he worst relative performance of low-population municipalities was already evidenced by Alonso and Castro (2014). hey point out political reasons (proximity between mayors and their voters) to explain this fact. Moreover, a lower taxable base (Sepulveda and Vasquez, 2009) and other adminis-trative issues (e.g. adminisadminis-trative costs) (Afonso, Araujo and Nobrega, 2012) are possible explanations for the poor results of smaller municipalities.
All the ineicient cities in this study could, in theory, improve their revenue from IPTU. Based on this, the next section proposes an estimation of the possible increase to municipalities’ revenue from IPTU through a better use of their potential.
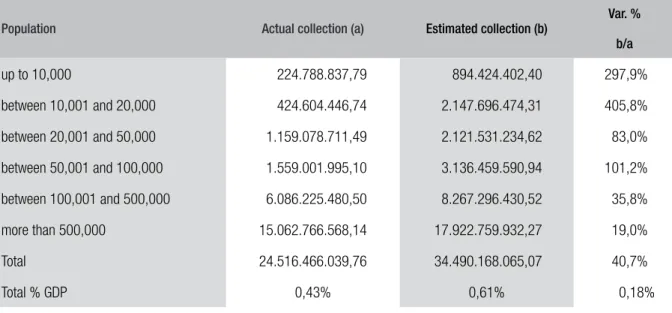
3.4 POTENTIAL TO EXPAND IPTU COLLECTION
Results show that many of the municipalities do not properly use their potential to collect IPTU. Based on this inding, the study has used the relation between Ifau and Ifap to help estimate the possible increase to municipalities’ revenue from IPTU. he simple inversion of the equation proposed to obtain Ifauc (from Ifau/Ifap to Ifap/Ifau) provides an expansion factor for increased IPTU collection per municipality. herefore, table 6 presents the aggregate results obtained from this estimate.
TABLE 6 AGGREGATE POTENTIAL TO EXPAND IPTU TAX COLLECTION (2014)
Population Actual collection (a) Estimated collection (b)
Var. %
b/a
up to 10,000 224.788.837,79 894.424.402,40 297,9%
between 10,001 and 20,000 424.604.446,74 2.147.696.474,31 405,8%
between 20,001 and 50,000 1.159.078.711,49 2.121.531.234,62 83,0%
between 50,001 and 100,000 1.559.001.995,10 3.136.459.590,94 101,2%
between 100,001 and 500,000 6.086.225.480,50 8.267.296.430,52 35,8%
more than 500,000 15.062.766.568,14 17.922.759.932,27 19,0%
Total 24.516.466.039,76 34.490.168.065,07 40,7%
Total % GDP 0,43% 0,61% 0,18%
It is to note that there is potential for increasing the amount of IPTU collected in all groups of municipalities. In most groups, the potential for expansion is very high, exceeding 400% in cities with a population between 10,001 and 20,000 inhabitants, for example. Many of the locations with this potential, however, collect very little IPTU. By observing the estimation in an aggregate way, it is possible to realize that there is a potential for IPTU collection to grow by slightly more than 40%. In terms of GDP, the estimated expansion would be 0.18% of the municipality GDP.
he idea of potential for tax collection described in this article is important, as municipalities are increasingly demanded to provide more and better public services, at the same time sufering from the uncertainty (inconsistency) of revenue low from the Federal and States’ governments.
[...] if society demands more action from the municipal administration, structural increases in revenue are crucial. he only plausible hypothesis, if there is a need for increasing revenue, will be feasible if the tax policy is in line with taxpayers’ capacity to contribute and with the consequent strengthening of tax management. [Guedes, 2008:17]
4. FINAL CONSIDERATIONS
here is a consensus among public inance experts in Brazil regarding property tax: in spite of the high tax burden on standard Brazilian development, there is still a huge potential for resource generation that is not explored in many Brazilian cities, especially for property tax — the most traditional and worldwide source used to inance local governments.
his study assessed Brazilian municipalities’ usage and potential for collecting IPTU in order to obtain, by comparing municipalities, opportunities to increase their revenue. A simple and unique methodology was used, attributing “degrees of truth” in relative terms. A fairer analysis was conducted by classifying municipalities in groups according to their population before applying the methodology.
Other methodologies could be adapted and applied in this study for the same purpose. Addi-tionally, using the same method, other choices could have been made in terms of attributing weights and establishing variables, choices that would possibly lead to other classiication among the cities, especially on their potential to collect IPTU. However, it is important to highlight the efort of the study to build a consistent and coherent analytical framework for data analysis.
Findings conirm what analysts and even municipal leaders had already pointed out: the majority of Brazilian municipalities do not use their potential for collecting IPTU — a fact that tends to be more critical in smaller municipalities, which depend on resources from other spheres of govern-ment. Finally, the innovation of this study was to use comparative analysis between cities in order to measure this potential.
indicators, results at the municipal level could be diferent), and that the proposed classiication may change the positioning of most municipalities (the choice of classiication may vary according to the analyst’s preferences).
Exploring IPTU’s potential in a minimally compatible way with other Brazilian taxes, including property tax, is an action that should not be taken only to obtain greater revenue potential — as explained by Afonso (2014). Moreover, it can and should be used for regulatory purposes and for urban policy purposes in each city.
REFERENCES
AFONSO, José Roberto. Financiamento da Inovação
Urbana. In: LAZZARINI, Sergio. Arquiteto do futuro:
inanciamento da inovação urbana, novos modelos. São Paulo: BEI, 2014. p. 72-92.
AFONSO, José Roberto; ARAÚJO, Érika A.;
NÓ-BREGA, Marcos A. R. he urban property tax (IPTU)
in Brazil: an analysis of the use of the property tax as a revenue source by Brazilian municipalities. Lincoln Institute of Land Policy, Working Paper, 2012. Available at: <www.lincolninst.edu/pubs/ dl/2285_1624_Afonso_WP13JA2.pdf>. Accessed on: 10 Dec. 2015.
AFONSO, José Roberto; CASTRO, Kleber P. A dii-culdade para inanciamento municipal via imposto sobre propriedade urbana No Brasil. In: JORNADAS IBERO-AMERICANAS DE FINANCIAMENTO LOCAL, III, 2014, São Paulo. São Paulo: Fundação Instituto Fernando Henrique Cardoso, Aug. 2014. p. 1-20.
AFONSO, José Roberto; SOARES, Julia M.;
CASTRO, Kleber P. Avaliação da estrutura e do
desempenho do sistema tributário brasileiro: livro
branco da tributação brasileira. Documento para discussão IDB-DP-265, Banco Interamericano de Desenvolvimento. Brasília, 2013. Available at: <www. iadb.org/wmsfiles/products/publications/docu-ments/37434330.pdf>. Accessed on: 11 Nov. 2015. ANDERSON, Theodore W.; DARLING, Donald A. Asymptotic theory of certain goodness-of-it
criteria based on stochastic processes. he Annals of
Mathematical Statistics, v. 23, n. 2, p. 193-212, 1952. BAHL, Roy. Property tax reform in developing and transition countries. Washington: Usaid, 2009. Avai-lable at: <http://pdf.usaid.gov/pdf_docs/Pnadw480. pdf>. Accessed on: 4 Jul. 2017.
BALIAMOUNE-LUTZ, Mina. On the measurement of human well-being: fuzzy set theory and Sen’s capa-bility approach. Tóquio: United Nations University: World Institute of Development Research, 2004. WIDER, Research Paper n. 2.004/16. Available at: <https://core.ac.uk/download/files/153/6483894. pdf>. Accessed on: 10 Dec. 2015.
BARROS, Ricardo P.; CARVALHO, Mirela;
FRAN-CO, Samuel. Pobreza multidimensional no Brasil.
Texto para Discussão n. 1227 — Ipea. 2006.
Avai-lable at: <http://repositorio.ipea.gov.br/bitstre-am/11058/1688/1/TD_1227.pdf>. Accessed on: 10 Dec. 2015.
CARVALHO, Maristela; KERSTENETZKY, Celia L.; DEL VECCHIO, Renata. Uma aplicação da teoria dos conjuntos fuzzy na análise da pobreza: o caso das regiões metropolitanas do Sudeste bra-sileiro — 2000. In: ENCONTRO NACIONAL DE ECONOMIA, ANPEC, XXXV, 2007, Recife. p. 22. Available at: <www.anpec.org.br/encontro2007/ artigos/A07A001.pdf>. Detailed information about the Annals: <https://ideas.repec.org/s/anp/en2007. html>.
CASTRO, Kleber P.; KERSTENETZKY, Celia L.; DEL-VECCHIO, Renata. Pobreza fuzzy multidi-mensional: uma análise das condições de vida na Zona Oeste do Rio de Janeiro — 1991 e 2000. In: SIMPÓSIO BRASILEIRO DE PESQUISA OPERA-CIONAL, 42., 2010, Bento Gonçalves.
CECHINI, Kerlyng et al. Brazilian automotive
industry in the nineties. MPRAPaper, Munich, n.
41197, set. 2012. Available at: <https://mpra.ub.uni-muenchen.de/41197/1/MPRA_paper_41197.pdf>. Accessed on: 8 Dec. 2015.
CHIAPPERO-MARTINETTI, Enrica. A multidi-mensional assessment of well-being based on sen’s
functioning approach. Rivista Internazionale di
Scienze Sociali, n. 2, p. 207-239, 2000.
DE CESARE, Claudia M.; MARÍN, José Francisco L. Impuestos a los patrimonios en América Latina.
Macroeconomía del Desarrollo, n. 66, 2008.
Avai-lable at: <http://repositorio.cepal.org/bitstream/ handle/11362/5433/1/S0800387_es.pdf>. Accessed on: 4 Jul. 2017.
DINIZ, Marcelo B.; DINIZ, Marcos M. Um indi-cador comparativo de pobreza multidimensional a partir dos objetivos do desenvolvimento do milênio.
Economia Aplicada, v. 13, n. 3, p. 399-423, 2009.
FONSECA, Oswaldo L. H. Aplicação de métodos de
análise espacial e da teoria dos conjuntos nebulosos em estudos sobre pobreza. Dissertation (Master degree in Engineering) — Universidade Federal do Rio de Janeiro, Rio de Janeiro, 2003.
GUEDES, José Rildo M. Tributos imobiliários: carga
Avai-lable at: <www.ibam.org.br/media/arquivos/estudos/ tributos_imobil.pdf>. Accessed on: 20 Nov. 2015.
LELLI, Sara. Factor analisys vs. fuzzy sets theory:
assessing the inluence of diferent techniques on Sen’s functioning approach. Center for Economic Studies, K. U. Leuven, 2001. Available at: <https:// feb.kuleuven.be/eng/ew/discussionpapers/Dps01/ Dps0121.pdf>. Accessed on: 10 Dec. 2015.
LOPES, Helger M. Análise de pobreza com
indica-dores multidimensionais: uma aplicação para Brasil e Minas Gerais. Dissertation (Master degree in Economy) — Centro de Desenvolvimento e Plane-jamento Regional, Universidade Federal de Minas Gerais, Belo Horizonte. 2003.
OTTONELLI, Janaina; MARIANO, Jorge Luiz. Po-breza multidimensional nos municípios da Região
Nordeste. Rev. Adm. Pública, Rio de Janeiro, v. 48,
n. 5, p. 1253-1279, Sept./Oct. 2014.
RECEITA FEDERAL DO BRASIL. Carga tributária
no Brasil 2014: análise por tributos e bases de inci-dência. Brasília: RFB/CETAD. out. 2015. Available at: <https://idg.receita.fazenda.gov.br/dados/receitadata/
estudos-e-tributarios-e-aduaneiros/estudos-e-estatis- ticas/carga-tributaria-no-brasil/29-10-2015-carga-tributaria-2014>. Accessed on: 4 Jul. 2017.
SEPULVEDA, Cristian; VAZQUES, Jorge. M.
Proper-ty taxation in Latin-America: an assessment and op-tions for reform. he Economic Commission for Latin America and the Caribbean (Eclac). Relaciones inter-gubernamentales y descentralizaciónen América Lati-na. Santiago de Chile, nov. 2009. Available at: <hwww. researchgate.net/proile/Jorge_Martinez-Vazquez/ publication/265541538_Property_Taxation_in_La-tin-America_An_Assessment_and_Options_for_ Reform/links/5525380c0cf201667be64544.pdf>. Accessed on: 20 Nov. 2015.
SHAPIRO, Samuel S.; WILK, Martin B. An analysis of variance test for normality (complete samples).
Biometrika, Oxford, v. 52, n. 3/4, p. 591-611, 1965.
SIMÕES, Rodrigo F. Complexos industriais no
espaço: uma análise de fuzzy cluster. Centro de De-senvolvimento e Planejamento Regional. Texto para discussão, n. 209, Belo Horizonte, 2003. Available at: <www.cedeplar.ufmg.br/pesquisas/td/TD%20209. pdf>. Accessed on: 8 Dec. 2015.
ZADEH, Lotfy A. Fuzzy sets. Information and
Con-trol, v. 8, p. 338-353, 1965.
Kleber Pacheco de Castro
PhD Student in Economics at the Post-Graduate Program in Economic Sciences of the Universidade do Estado do Rio de Janeiro. E-mail: [email protected].
José Roberto Rodrigues Afonso