IntroductIon
The magnetostrictive properties of materials and their magnetoelastic effects have been subject of study for appli-cations in several types of sensors, such as the ones for sen-sing force, magnetic ield, viscosity, density, luid low rate, elastic modulus of materials, humidity, gas, chem-bio agents in liquids, and blood coagulation [1].
Amorphous ferromagnetic alloys and iron/rare-earth alloys are frequently used in magnetostrictive/ magnetoelas-tic sensors. Ferrites with cobalt in their composition have been pointed out as alternative magnetostrictive materials for this application because of their lower cost and better corrosion resistance compared to iron-based alloys. Howe -ver, the low mechanical resistance of these ceramic mate -rials may be a disadvantage in some cases. The use cermets’
Processing and characterization of a ni-co ferrite for sensor applications
(Processamento e caracterização de uma ferrita Ni-Co para
aplicações em sensores)
V. L. O. Brito1,2, S. A. Cunha2, F. F. Araújo3, J. P. B. Machado4, M. R. Silva5, C. B. Nunes6 1Instituto de Estudos Avançados, USP, S. José dos Campos, SP, Brazil
2Programa de Pós-Graduação em Ciências e Tecnologias Espaciais, 3Programa de Pós-Graduação em Engenharia Aeronáutica e Mecânica,
Instituto Tecnológico de Aeronáutica, S. José dos Campos, SP, Brazil
4Laboratório Associado de Materiais e Sensores, Instituto Nacional de Pesquisas Espaciais, S. José dos Campos, SP, Brazil
5Departamento de Física e Química, Universidade Federal de Itajubá, Itajubá, MG, Brazil 6Escola de Engenharia de Lorena, Universidade de S. Paulo, Lorena, SP, Brazil
Abstract
Ni-Co ferrites are magnetostrictive ceramics that have potential application in magnetostrictive/ magnetoelastic sensors, as well as in magnetoelectric composites. Ni-rich Ni-Co spinel ferrite samples were processed by the ceramic method and bulk samples were sintered at 1350 oC in the solid state and at 950 oC with Bi
2O3 liquid phase. The sintered samples were characterized by light microscopy, scanning electron microscopy, Raman spectroscopy, vibrating sample magnetometry and capacitance dilatometry. With Bi2O3 additions as small as 0.6 mol% it was possible to sinter the Ni-Co ferrite at 950 oC, obtaining high-density samples; however, such liquid-phase sintered samples presented iron oxide particles. The studied samples presented magnetoelastic sensitivities very close to CoFe2O4, with signiicantly lower magnetic hysteresis. The results thus indicate that the magnetic properties of the samples analyzed are suitable for applications in magnetomechanical sensors.
Keywords: ferrites, magnetoelastic sensors, magnetostriction, magnetic ceramics.
Resumo
Ferritas Ni-Co são cerâmicas magnetostritivas que possuem potencial de aplicação em sensores magnetostrictivos/ magnetoelásticos, bem como em compósitos magnetoelétricos. Ferritas espinélio do tipo Ni-Co com alto teor de Ni foram processadas por meio do método cerâmico e amostras foram sinterizadas no estado sólido a 1350 oC e via fase líquida a 950 oC com adição de Bi
2O3. As amostras sinterizadas foram caracterizadas por meio de microscopia óptica, microscopia eletrônica de varredura, espectroscopia Raman, magnetometria de amostra vibrante e dilatometria de capacitância. Utilizando-se pequenas adições de Bi2O3, na proporção de 0,6% molar, foi possível sinterizar a ferrita Ni-Co a 950 oC, obtendo-se amostras de alta densidade relativa; no entanto, estas amostras sinterizadas via fase líquida apresentaram partículas de óxido de ferro na microestrutura. As amostras produzidas apresentaram sensibilidade magnetoelástica próxima à da esperada para CoFe2O4, com histerese magnética signiicativamente menor. Os resultados
obtidos indicam que as propriedades magnéticas das amostras analisadas são adequadas para aplicações em sensores magnetomecânicos.
et al. [4] to study the performance of Ni and Ni-Co ferrite in a magnetic ield sensor and the best results were obtained for the Ni-Co ferrite. Ni-Co ferrite has also been pointed out as a material for use as anode material in lithium ion batteries [8].
Ferrite synthesis by means of chemical methods has made possible to obtain high-purity materials, with controlled par-ticle size and morphology. There are many works about the synthesis of nanometric Ni-Co ferrites [9, 10]. These develop-ments in the nanotechnology area are extremely important for these materials application advancement. On the other hand, the study of the traditional ceramic processing route is still important due to the suitability of large scale materials pro-cessing. Ferrites usually require sintering temperatures higher than 1200 oC but the possibility of sintering in temperatures lower than 1000 oC favors co-iring in electronic devices fa-brication [11]. Until now, numerous processing methods have been proposed to reduce the required sintering temperatures to obtain ferrites with highest mass density. The use of addi-tives such as Bi2O3, V2O5 and copper substitutions are proce-dures that result in ferrites with high mass density using low sintering temperatures [12-14]. The presence of a liquid phase during sintering enhances diffusion and exerts capillary for-ces, favoring the densiication at a lower sintering temperature compared to the temperature required for high densiication without the liquid phase. The liquid-phase sintering of Ni-Co ferrites, using 5 wt.% Bi2O3 as the sintering additive, has been studied [2]. The authors obtained samples with mass densities as high as 4.9 g/cm3 with sintering at 950 oC for 2 h in air. However, there are very few works dealing with the effect of liquid-phase sintering on the magnetostriction of ferrites. This is important since the magnetostriction of ferrites is very sen-sitive to the microstructural changes that result from variations in both sintering and processing parameters [14, 15]. Also, it is known that secondary phases affect the magnetostrictive pro-perties of ferrites [16, 17] and liquid-phase sintering generally introduces second phases in the microstructure of ceramics.
In this work, Ni-Co ferrite samples were liquid-phase sintered at low temperature and with small Bi2O3 additions (sintered at 950 oC with 0.6 mol% Bi
2O3). The microstruc-ture and the magnetic properties of the samples were com-pared to those obtained from samples sintered in the solid state at 1350 oC, which is within the usual temperature ran-ge for solid-state ferrite sintering.
EXPErIMEntAL ProcEdurE
Two batches of Ni-Co ferrite were fabricated by the
ce-uniaxially pressed at 50 MPa and subsequently at 300 MPa in an isostatic press.
The pellets were sintered at 1350 oC for 6 h (SSS) and the pellets with additives to obtain liquid-phase were sintered at 950 oC for 24 h (LPS). The densities of the sintered samples were evaluated by the Archimedes method. The crystal struc-tures of the powders in calcined state and in a subsequently heat-treated one at 950 oC/24 h were evaluated by X-ray dif-fraction (XRD).
The microstructures of the sintered samples were evalua-ted in a scanning electron microscope (SEM) equipped with energy dispersive X-ray spectrometer. The samples were pre-pared by a sequence of grinding and polishing steps, followed by thermal etching.
The chemical homogeneity of the microstructures of both SSS and LPS samples was also evaluated by micro-Raman spectroscopy with an argon laser (λ = 514.5 nm) of 8 mW.
Magnetostriction measurements were carried out in sam-ples cut from the sintered pellets. The dimensions of the samples were 3.977 mm × 2.509 mm × 2.421 mm (SSS) and 3.083 mm × 2.364 mm × 2.090 mm (LPS). The measurement method was capacitance dilatometry, described in detail el-sewhere [18]. Magnetization measurements were performed in the same cut samples by vibrating-sample magnetometry (VSM). Magnetostriction was measured in parallel and per-pendicular directions to the applied ield.
rESuLtS And dIScuSSIon
The results of the AAS quantitative analysis of the cal-cined powders are shown on Table I. The batches presented similar Co content but the SSS batch presented a higher Fe:Ni ratio.
Element Fe Ni Co Ni:Co:Fe
Batch
for LPS 47.1±0.8 21.4±0.4 3.04±0.20 0.90:0.13:1.97 Batch
for SSS 48.0±2.1 18.5±1.0 3.32±0.08 0.80:0.14:2.06
Table I - Results of AAS analysis (wt.%) of each element in the calcined powders and calculated Ni:Co:Fe atomic pro-portions.
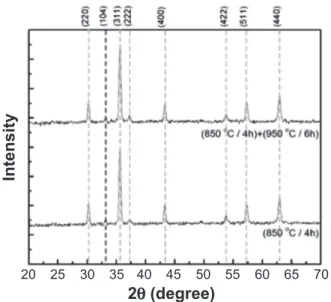
The X-ray diffraction patterns of the SSS batch after calci-nation and calcicalci-nation followed by heat treatment are shown on Fig. 1. The peak expected for the (104) plane of hematite (α-Fe2O3 – rhombohedral) was detected in both powders, indi-cating that the reactions in solid state to form the spinel phase were not complete [19]. The calculated lattice parameters of the spinel phases were 8.343 Å for the calcined powder and 8.331 Å for the powder that was subsequently heat treated.
The densities measured were 4.90 g/cm3 for the SSS sample and 5.02 g/cm3 for the LPS sample; LPS thus increa-sed the density of the material, with a sintering temperature 400 oC lower.
Figs. 2 and 3 show SEM images of the microstructures
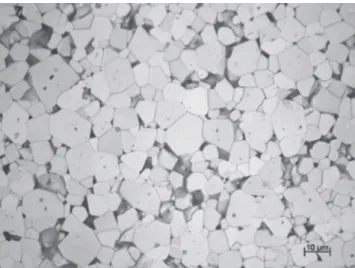
of the SSS and LPS samples; the average grain sizes, esti-mated from these igures by a linear intercept method [20] were 3 µm for the LPS sample and 5 µm for the SSS sample. The LPS process resulted in a microstructure with pore-free grains, with porosity located at grain boundaries; the crys-tallized liquid phase appears as ilms and particles located at grain boundaries. The grain size of the SSS sample is fairly uniform and the intragranular porosity is very small: the po-rosity of the sample is predominantly intergranular.
The EDX spectrum shown in Fig. 4 was taken from a white intergrain particle observed in the LPS sample in Fig. 3. This result suggests that this phase, rich in bismu-th, has a high concentration of the Bi2O3 additive, as well as small amounts of impurities coming from the raw mate-rials. However, due to the small thickness of these intergrain phases, much lower than 5 mm, which is the electron beam average size in SEM, there is the inluence of the ferrite ba-ckground on the measurement that do not allow to obtain a measurement only of the isolated intergrain phase.
The EDX analysis in the centers of the ferrite grains of the LPS sample revealed two composition types: a major
Figure 3: SEM image of the LPS sample.
[Figura 3: Imagem obtida em microscópio eletrônico de varredura da amostra sinterizada via fase líquida.]
Figure 1: X-ray diffraction patterns of powders from the SSS batch. The red line indicates the peak that corresponds to the (104) plane of hematite (JCPDS ile 89-0599) and the green lines indicate the typical peaks of the spinel phase.
[Figura 1: Difratogramas de raios X dos pós calcinados utiliza
-dos nas amostras sinterizadas no estado sólido. A linha vermelha
indica o pico correspondente ao plano (104) da hematita (JCPDS
89.0599) e as linhas verdes indicam os picos típicos da fase es-pinélio.]
20
2q (degree)
Intensity
40 60
30 50 70
25 35 45 55 65
Figure 2: SEM image of the SSS sample.
[Figura 2: Imagem obtida em microscópio eletrônico de varredura da amostra sinterizada no estado sólido.]
Figure 4: Results of EDX analysis of one of the white particles observed in Fig. 3.
[Figura 4: Resultados da análise por EDX de uma das partículas
0.8:0.1:2.1 for the spinel Ni-Co phase in both SSS and LPS samples.
Figs. 5 and 6 show light microscopy images of the sinte-red samples. It was observed that the LPS sample’s micros-tructure was constituted of few and sparsely distributed whi-te grains surrounded by a major phase, constituwhi-ted of grey grains. The presence of such white phase was not observed in the SSS sample. The Raman spectra of the LPS sample were taken from three grains of each type.
Figs. 7 to 9 show Raman spectra of the LPS and SSS samples, taken from the centers of selected grains.
The spectra of Figs. 7 and 8, for SSS and LPS samples, presented essentially the same pattern, which is typical of spinel Ni ferrites [21, 22]. In the case of the spectra of Fig.
Figure 7: Raman spectra of the SSS sample. The sharper peaks are marked in red.
[Figura 7: Espectros Raman obtidos na amostra sinterizada no
es-tado sólido. Os picos mais agudos estão marcados em vermelho.]
Element Ni-Co spinel grain Co-free grain
Ni 11.91 3.76
Co 1.76 0.00
Fe 30.79 34.75
O 55.54 61.47
Bi 0.00 0.01
Ni:Co:Fe 0.80:0.12:2.08 0.29:0.00:2.71
Table II - Composition obtained from EDX analyses of the grains from the microstructure of the LPS sample (at.%). [Tabela II - Composição obtida por EDX (percentual atômi -co) de grãos da microestrutura da amostra sinterizada via fase líquida.]
Element Ni Co Fe O
Average 9.254 1.694 24.123 64.929
Std. deviation 0.251 0.108 0.369 0.494
Table III - Results from the EDX analysis of the SSS sam-ple (at.%).
[Tabela III - Resultados (em percentual atômico) da análise
de EDX da amostra sinterizada no estado sólido.]
Figure 5: Optical microscopy image of the LPS sample’s micros-tructure. The arrows indicate the two types of grains from which the Raman spectra were taken: phase 1, grey grains; phase 2, white grains.
[Figura 5: Imagem obtida por microscopia óptica da microestrutu-ra da amostmicroestrutu-ra sinterizada via fase líquida. As setas indicam os dois tipos de grãos nos quais foi realizada a análise por espectroscopia Raman: fase 1, grãos cinza; fase 2, grãos brancos.]
Figure 6: Optical microscopy image of the SSS sample’s micros-tructure.
[Figura 6: Imagem, obtida por microscopia óptica, da microestru-tura da amostra sinterizada no estado sólido.]
100
Raman shift (cm-1)
Intensy
500
300 700 900
100
Raman shift (cm-1)
Intensy
500
300 700 900
200 400 600 800 1000
9, taken from the white phases observed in optical micros-cope of the LPS sample (Fig. 5), the peaks numbered 1 to 5 match well with the phase α-Fe2O3 (hematite) [23, 24]. However, the peak number 6 has an average value of 655 cm-1 of the Raman shift, which is close to the range of 663-706 cm-1 range that is known to be the strongest mode of Fe3O4 (magnetite) [25]. In addition, no spinel ferrite peak vestiges were observed in those white grains. These results thus indicate that the white grains are constituted of iron oxi-de, corroborating the previous chemical analyses, XRD and EDX experiments.
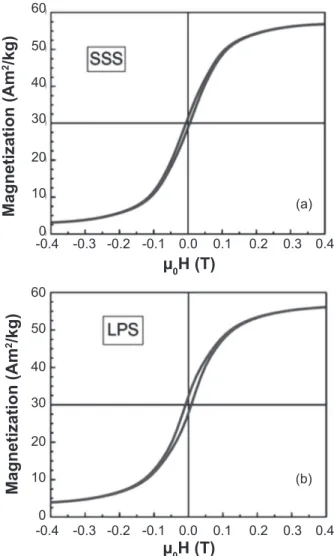
Figs. 10a-b and 11 show the results from the magnetiza-tion measurements of the sintered samples. The parameters obtained from such data are shown on Table IV. The
satura-tion magnetizasatura-tion values of both samples were similar and the slightly higher coercivity of the LPS sample may be at-tributed to: the smaller grains (higher grain boundary area)
Figure 8: Raman spectra of the grey grains observed in the LPS sample. The sharper peaks are marked in red.
[Figura 8: Espectros Raman dos grãos cinza observados na
amos-tra sinterizada via fase líquida. Os picos mais agudos estão nume
-rados.]
Figure 9: Raman spectra of the white grains observed in the LPS sample. The sharper peaks are numbered.
[Figura 9: Espectros Raman dos grãos brancos observados na
amostra sinterizada via fase líquida. Os picos mais agudos estão
numerados.]
100
Raman shift (cm-1)
Intensy
500
300 700 900
200 400 600 800 1000
Figure 10: (a) Hysteresis curve of the LPS sample; (b). Hysteresis curve of the SSS sample.
[Figura 10: (a) Curva de histerese magnética da amostra sinteri-zada via fase líquida (a) e sinterisinteri-zada no estado sólido (b).]
-0.4 -0.4
µ0H (T)
Magnetization (Am
2 /kg)
-0.2 -0.2
0.0 0.0
-0.3 -0.3
-0.1 -0.1
0.1 0.1
0.3 0.3
0.2 0.2
0.4 0.4
60
(b) 40
20 50
30
10
0
µ0H (T)
Magnetization (Am
2/kg)
60
(a) 40
20 50
30
10
0
Figure 11: Initial magnetization curves.
[Figura 11: Curvas de magnetização inicial.]
µ0H (T)
Magnetization (Am
2 /kg)
0.2
0.0 0.4 0.6 0.8 1.0 1.2 1.4
60
(b) 40
20 50
30
10
of the sample, increasing the pinning effect on the magnetic domains’ walls; the presence of non-magnetic second phase particles, such as diamagnetic α-Bi2O3 and antiferromagne-tic α-Fe2O3. This factor may have also contributed to the sli-ghtly lower saturation magnetization of this sample.
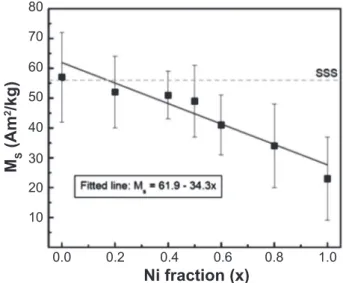
The Ms values reported by other authors for NixCo 1-x-Fe2O4 vary within a wide range, depending on the fabrica-tion route. For example, Ni0.5Co0.5Fe2O4 has benn obtained by means of mechanical alloying and their samples presen-ted a large variation of Ms, as a function of the annealing temperature after milling [26]. Additionally, Table V shows Ms values of chemically synthesized NixCo1-xFe2O4 ferrites from different sources [6, 7, 10, 27, 28]; all these works show a tendency of Ms increasing values with the raise of cobalt content. In Fig. 12, a plot of Ms as a function of Ni content “x” in NixCo1-xFe2O4, elaborated with the data pre-sented on Tab. V, shows clearly that the Ms values obtained in the present work (dashed line) approach the average of pure cobalt ferrite and are within the range reported for NixCo1-xFe2O4 with x ≤ 0.5. The slight iron excess of the ferrite, as veriied in the EDX analysis, probably contribu-ted to this result.
According to Fig. 13, the trends reported in literature for
Figs. 14-15 show the magnetostriction curves of the sin-tered samples and Table VI shows some parameters extrac-ted from these curves.
Fig. 16 shows the magnetoelastic sensitivity (S) curves, calculated by differentiating the magnetostriction curves,
Figure 12: Graphical representation of the Ms values reported in lite-rature for NixCo1-xFe2O4. The dashed line indicates the Ms obtained in this work for the SSS sample.
[Figura 12: Representação gráica dos valores de Ms reportados na
literatura para NixCo1-xFe2O4. A linha tracejada indica o valor de Ms da amostra sinterizada no estado sólido obtida neste trabalho.]
x Ref.[27] Ref.[7] Ref.[28] Ref.[10] Ref.[6]
0 66 37 70 56
-0.1 65 - 69 -
-0.2 58 37 65 50
-0.3 - - 63 -
-0.4 - 45 60 47
-0.5 35 - 57 - 54
0.6 29 34 55 42 47
0.7 - - 52 - 42
0.8 15 27 51 36 40
0.9 - - 47 - 25
1.0 14 13 45 30 12
Table V - Saturation magnetization values [A.m2/kg] of che-mically synthesized NixCo1-xFe2O4 reported by different au-thors. The data have been approximated to integers.
[Tabela V - Valores de magnetização de saturação [A.m2/
kg] reportados por diferentes autores para amostras de NixCo1-xFe2O4 sintetizadas por meio químico. Os dados fo -ram aproximados para números inteiros.]
80
MS
(Am
2 /kg)
Ni fraction (x)
60
40
20 70
50
30
10
0.0 0.2 0.4 0.6 0.8 1.0
Figure 13: Values reported for MR/Ms parameter of NixCo1-xFe2O4.
[Figura 13: Valores do parâmetro MR/Ms reportados para NixCo1-xFe2O4.]
MS
(Am
2 /kg)
Ni fraction (x)
60
40
20 50
30
10
0
and Tables VII and VIII show the moduli of the maximum magnetoelastic sensitivities observed. The LPS sample pre-sented the lowest magnetoelastic sensitivity at low ields, but it is the most sensitive sample for μ0H between
0.10-0.17T, approximately. It is important to mention that the de-rivative of both magnetostriction and magnetization curves are affected by the samples’ geometry and dimensions, but the dimensions of both samples evaluated here are similar enough to allow a qualitative comparison between their magnetoelastic sensitivities.
The excess iron detected in the EDX analysis may have different effects on the magnetic properties of the ferrite. For example, the saturation magnetization of the ferrite may be increased when the excess iron forms magnetite (Fe3O4), because this phase has a relatively high saturation magne-tization (around 90 A.m2/kg [29]). Moreover, Ni-Co ferrite and magnetite magnetostrictions have opposite signs in the direction parallel to the magnetic ield, namely, Ni-Co
fer-Figure 16: Modulus of the magnetoelastic sensitivities of the sintered samples.
[Figura 16: Módulo da sensibilidade magnetoelástica das amostras sinterizadas.]
Figure 14: Magnetostriction curves of the SSS sample: parallel (λ//) and perpendicular (λ^) to the magnetic ield.
[Figura 14: Curvas de magnetostricção da amostra sinterizada no
estado sólido: direção paralela (λ//) e perpendicular (λ^) ao campo magnético.]
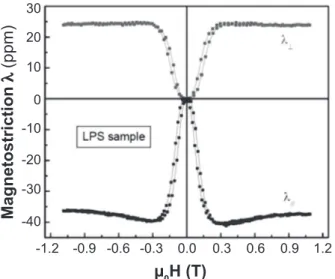
Figure 15: Magnetostriction curves of the LPS sample: parallel (λ//)
and perpendicular (λ^) to the magnetic ield.
[Figura 15: Curvas de magnetostricção da amostra sinterizada via fase líquida: direção paralela (λ//) e perpendicular (λ^) ao campo magnético.]
80
Magnetization (Am
2/kg)
µ0H (T)
60
40
20 70
50
30
10
-1.2 -0.9 -0.6 -0.3 0.0 0.3 0.6 0.9 1.2
30
Magnetostriction
l
(ppm)
µ0H (T)
10
-10
-30 20
0
-20
-40
-1.2 -0.9 -0.6 -0.3 0.0 0.3 0.6 0.9 1.2
480
Magnetoelastic sensitivy “S”(ppm/T) µ0H (T)
360
60 420
300
240
180
120
0
0.00 0.05 0.10 0.15 0.20 0.25 0.30 0.35
Table VI - Saturation magnetostrictions and saturation ields obtained from Figs. 14-15.
[Tabela VI - Valores de magnetostricção de saturação e
campos magnéticos de saturação, obtidos das Figs. 14-15.]
Sample (λ//)s (λ^)s µ0H at
saturation
SSS -35 ppm 23 ppm 0.287 T
LPS -40 ppm 24 ppm 0.353 T
Table VII - Maximum magnetoelastic sensitivities (Sm)// and corresponding μ0H values.
[Tabela VII - Sensibilidades magnetoelásticas máximas
(Sm)// e valores de μ0H correspondentes.]
Sample (Sm)//
[ppm/T] μ[T]0H
LPS 341 0.096
SSS 463 0.068
Sample (Sm)^
[ppm/T] μ[T]0H
LPS 158 0.165
SSS 242 0.108
Table VIII - Maximum magnetoelastic sensitivities (Sm)^ and corresponding μ0H values.
[Tabela VIII - Sensibilidades magnetoelásticas máximas
suggest that the Ni-rich Ni-Co ferrite here studied may be more sensitive than CoFe2O4 at low magnetic ields. When associated to a piezoelectric material, forming a magnetoe-lectric composite [5, 30], the good electromagnetic [3] and magnetostrictive properties of Ni-Co ferrites make them candidates for applications in high-frequency tunable devi-ces, for example.
concLuSIonS
The Ni-rich Ni-Co spinel ferrite samples presented mag-netoelastic sensitivities very close to that of CoFe2O4, with signiicantly lower magnetic hysteresis than that ferrite. The MR/Ms ratios were lower than the values reported in litera-ture for NixCo1-xFe2O4 ferrites. Liquid-phase sintering with Bi2O3 slightly increased the magnetic hysteresis and had little effect on the magnetostriction values; however, the magnetoelastic sensitivity of the liquid-phase sintered sam-ple was lower than that obtained in the solid-state sintered sample. Liquid-phase sintering at 950 oC for 24 h resulted in chemically heterogeneous samples, with the presence of iron oxides. Because of its relatively high magnetoelastic sensitivity and low magnetic hysteresis, the ferrite is a can-didate for application in magnetoelastic sensors and magne-toelectric composites.
AcKnoWLEdGMEntS
The authors acknowledge the support given by the following people/institutions: the Brazilian agen-cies FAPESP (Procs. 2009/09524-7, 2012/01448-2 and 2011/21258-0), CNPq (504282/2010-7) and CAPES for the inancial support; students M. S. Hieda (Instituto Tecnoló-gico de Aeronáutica, Brazil) and M. B. S. Dias (University of S. Paulo, Brazil) for obtaining the microstructure images; Materials Division of the Institute for Aeronautics and Spa-ce, Brazil, for the chemical and SEM analysis.
rEFErEncES
[1] C. A. Grimes, S. C. Roy, S. Rani, Q. Cai, Sensors 11 (2011) 2809-2844.
[2] Y. Chen, J. E. Snyder, C. R. Schwichtenberg, K. W. Dennis, R. W. McCallum, D. C. Jiles, IEEE Trans. Magn. 35, 5 (1999) 3652-3654.
[3] K. C. Chan, X. T. Liew, L. B. Kong, Z. W. Li, G. Q. Lin, J. Amer. Cer. Soc. 91, 12 (2008) 3937-3942.
Lett. 8, 2 (2013) 68-69.
[10] J. Xiang, Y. Chu, X. Shen, G. Zhou, Y. Guo, J. Colloid Interf. Sci. 376 (2012) 57-61.
[11] T. Kikuchi, Y. Okazaki, K. Ikeda, JFE Tech. Rept. 6 (2005) 29-34.
[12] O. Mirzaee, A. Shafyei, M. A. Golozar, H. Shokrollahi, J. Alloy. Compd. 461 (2008) 312-315.
[13] D. Sakellari, V. Tsakaloudi, E.K. Polychroniadis, V. Zaspalis, J. Am. Ceram. Soc. 2 (2008) 366-371.
[14] V. L. O. de Brito, S. A. Cunha, L. V. Lemos, C. Bormio Nunes, Sensors 12 (2012) 10086-10096.
[15] I. C. Nlebedim, J. E. Snyder, A. J. Moses, D. C. Jiles, J. Magn. Magn. Mater. 322 (2010) 3938-3942.
[16] I. C. Nlebedim, N. Ranvah, P. I. Williams, Y. Melikhov, F. Anayi, J.E. Snyder, A. J. Moses, D. C. Jiles, J. Magn. Magn. Mater. 321 (2009)2528-2532.
[17] I. C. Nlebedim, A. J. Moses, D. C. Jiles, J. Magn. Magn. Mater.343 (2013) 49-54.
[18] C. T. Santos, Evaluation of magnetostriction and microstructural characterization of Fe-Sn and Fe-V alloy,
M.Sc. Diss., Escola de Engenharia de Lorena, USP, Lorena, SP, Brazil (2008).
[19] A. Goldman, Modern ferrite technology. New York:
Springer, 2nd ed. (2006) p. 158.
[20] K. J. Kurzydlowski, B. Ralph, The quantitative description of the microstructure of materials, Boca Raton:
CRC Press, (1995) p. 275
[21] J. R. Gonçalves, J. Barbosa, P. Sá, J. A. Mendes, A. G. Rolo, B. G. Almeida, Phys. Status Solidi 11-12 (2010) 2720-2723.
[22] R. Benrabaa, H. Boukhlouf, A. Löfberg, A. Rubbens, R. N. Vannier, E. Bordes-Richard, A. Barama, J. Nat. Gas Chem. 21 (2012) 595-604.
[23] M. V. Reddy, T. Yu, C. H. Sow, Z. X. Shen, C. T. Lim, G. V. Subba Rao, B. V. R. Chowdari, Adv. Funct. Mater.17 (2007) 2792-2799.
[24] E. Caudron, A. Tfayli, C. Monnier, M. Manfait, P. Prognon, D. Pradeau, J. Pharmaceut, Biomed. Analysis 54 (2011) 866-868.
[25] O. N. Shebanova, P. Lazor, J. Solid State Chem. 174 (2003) 424-430.
[26] A. Azizi, H. Yoozbashizadeh, A. Yourdkhani, M. Mohammadi, J. Magn. Magn. Mater. 322 (2010) 56-59. [27] K. Maaz, W. Khalid, A. Mumtaz, S. K. Hasanain, J. Liu, J. L. Duan, Physica E 41 (2009) 593-599.
[29] R. J. Harrison and A. Putnis, Am. Mineral. 80 (1995)
213-221. [30] S. Bhame, cobalt ferrite, Saarbrüken: Lambert Acad. Publ. (2011).Oxide magnetostrictive materials based on