Materials Research, Vol. 8, No. 2, 121-124, 2005 © 2005
*e-mail: [email protected]
Fracture Toughness Measurements of LPS-SiC: A Comparison
of the Indentation Technique and the SEVNB Method
Kurt Streckera*, Sebastião Ribeiroa, Michael-Johannes Hoffmannb
aDepartamento de Engenharia de Materiais DEMAR-FAENQUIL,
Polo Urbo-industrial, Gleba AI-6, s/n, 12600-000 Lorena - SP, Brazil
bInstitut für Keramik im Maschinenbau, Universität Karlsruhe,
Haid-und-Neu-Str. 7, D-7131Karlsruhe, Germany7, D-7131Karlsruhe, Germany
Received: November 23, 2003; Revised: February 3, 2005
Many methods are currently used to measure the fracture toughness of ceramic materials. Methods based on crack-length measurements of cracks introduced into the sample surface by the Vicker’s indentor have the advantage that they are easy to use, but are very unreliable due to subcritical crack growth and the difficulty in determining the exact length of the cracks. Furthermore, depending on the crack shape there are many equations to calculate KIc. Other methods like the Chevron Notch or Single Edge Pre-cracked Beam (SEPB) are often difficult to execute or expensive. The simple and inexpensive Single-Edge-V-Notched Beam (SEVNB) on the other hand gives reliable values of fracture toughness of ceramic materials. In this method a saw cut is tapered to a sharp V-notch using a razor blade sprinkled with diamond paste. Thus, it is possible to introduce a sharp crack with a notch width of less than 20 micrometers, necessary to conduct valid tests. In this investigation, fracture toughness measurements on LPS-SiC materials carried out by the indentation technique and the SEVNB method have been compared.
Keywords:fracture toughness measurement, indentation technique, SENVB method
1. Introduction
The appeal of ceramics as structural materials is based on their light weight combined with their high temperature resistance, high hardness, chemical inertness and elevated wear resistance. A major goal of current ceramic research and development is to produce tough, strong ceramics that perform reliably. The fracture toughness of ceramics is still poor, compared to that of metals and composites. Precise design methodologies and modeling are therefore necessary to help predict the performance of ceramics. Such modeling requires statistically valid data about fracture toughness, wear, strength and hardness.
Fracture toughness values are used extensively to characterize the fracture resistance of ceramics and brittle materials1-9. The frac-ture of brittle ceramics is usually controlled by the mode I fracfrac-ture toughness. Simple dimensional analysis of a body containing a crack of length 2a and subject to an applied stress shows that the stress intensification at the crack tip KI is:
K1 = .Y. a1/2 (1)
Where KI is the stress-intensity factor and Y is a dimensionless con-stant that depends on sample geometry and crack configuration. Frac-ture toughness of brittle materials is considered a material parameter. At a critical stress intensity level, KIc, fracture will occur.
There is no standard specimen type for determining fracture toughness of engineering ceramics, although numerous test tech-niques are available10-14. The choice of technique is determined by the type of information needed. Specimen geometry, preparation and fabrication history are critical to correlate test specimen behavior with actual component fracture toughness.
A method that is frequently used to determine fracture toughness is the so-called indentation fracture, IF, method10,11,15,16. Interest in this method stems from its simplicity and the small volume of mate-rial required to conduct KIc measurements. A Vickers indentation is
implanted onto a flat ceramic surface and cracks develop around the indentation with their lengths in inverse proportion to the toughness of the material. By measuring crack lengths, it is possible to estimate KIc. It must be noted that under small indentation loads, only small Palmqvist cracks form, see Figure 1. The median vent cracks are used for fracture toughness computations.
Anstis et al.10 employed a simplified two-dimensional fracture mechanics analysis and obtained:
KIc = .
C P
H E
0 0016 /
/
O
3 2 1 2
b l (2)
where P is the load in Newtons, C0 is the crack length from the center of the indent to the crack tip in meters, E is the Young’s modulus in GPa and H is the Vickers hardness in GPa.
The Palmqvist crack model equation can also be used to compute fracture toughness if only shallow cracks form. According to Niihara17 the following equation is valid if c/a < 3.5:
KIc = . .H a. . H E
c a
0 018 / 1
. /
1 2
0 4 1 2
-b l b l (3)
The major difficulties in determining reliable and comparable fracture toughness values are determining the type of cracks formed and measurement of the precise crack length.
122 Strecker et al. Materials Research
as the SEVNB (Single-Edge-V-Notch Beam) method, to distinguish it from the SENB method, and relates to basic work conducted by Awaji and Sakaida20.
In this investigation, the fracture toughness of LPS-SiC materials has been measured by the indentation fracture-IF and the SEVNB methods and compared.
2. Experimental Procedure
2.1. Sample preparation
Two types of SiC ceramics were prepared by liquid phase sin-tering using 10 wt.(%) of AlN-Y2O3, as additive, at molar ratios of 2:3 (A) and 4:1 (A80), respectively. The sample compositions are listed in Table 1.
The powder batches were obtained by attrition milling, drying and sieving. Green bodies of approximately 40 x 60 x 6 mm3 were obtained by uniaxial pre-pressing and cold isostatic pressing under 400 MPa. Sample sintering was done in a graphite resistance heated furnace at a temperature of 2080 °C, for 1 hour under flowing nitrogen, using the powder bed technique. Some samples were further heat treated at 2000 °C for 4 hours. After sintering the samples were cut into bending bars of approximately 3 x 4 x 50 mm3, ground and polished.
2.2. Sample characterization
The theoretical density of the sintered samples was calculated by the rule of mixture, while the bulk density was measured by the immersion method in distilled water, using Archimedes principle.
The microstructures of the sintered samples were examined by scanning electron microscopy. Samples with surfaces that were polished and plasma etched with a mixture of CF4 and O2, in the proportion 4:2, for 2 hours were used.
To evaluate mechanical properties, the hardness of the samples was determined from Vickers indentations obtained with a load of 10 kg for 10 seconds. Vickers hardness HV10 was computed from Equation 4:
. .
HV
d P
10=1 85442 (4)
where HV represents the Vickers hardness, P the applied load and d the diagonal of the indentation mark.
The cracks that originated from the Vickers indentations were also used to compute the fracture toughness by the IF method, using Equation 3 proposed by Niihara. For the Young’s modulus E, a value of 400 GPa was assumed.
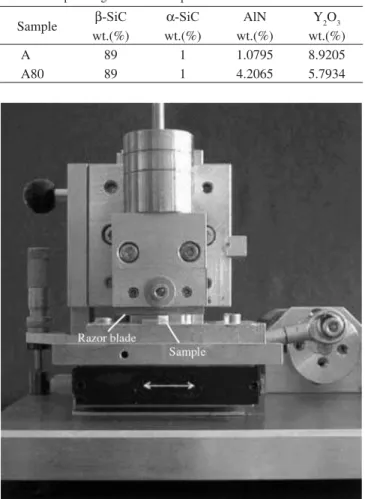
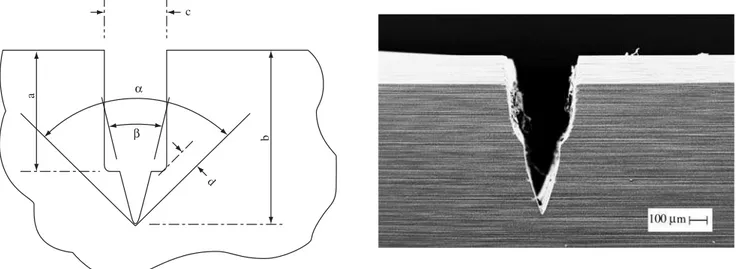
Fracture toughness measurements were also conducted using the SEVNB method. First a cut was introduced by a diamond saw and this notch was tapered by a razor blade with 3 m diamond paste.
The equipment used is shown in Figure 2. Thus, a sharp notch with small tip radius was produced, as shown in Figure 3.
Fracture toughness was determined from the residual bending strength of the bars with the V-notch and by using the following relations, Equations 5-7:
. .
. .
( )
.
. ( )
. .
K a Y
B W
F W
S S a
Y
2 1 3
.
Ic
1 2
1 5
v
a
= =
-- (5)
W a
a= (6)
. .
( )
( . . . ) . . ( ) Y 1 9887 1 326
1
3 49 0 68 1 35 1 2
2
a
a
a a a a
= -
-+
- + - (7)
where KIc represents fracture toughness, the 4-point bending strength, F the fracture load, B the specimen thickness, W the speci-men width, S1 the outer span distance, S2 the inner span distance, a the average V-notch length, the relative V-notch depth and Y the stress intensity shape factors.
Furthermore, the 4-point bending strength was determined using 25 samples of each composition and sinter condition.
3. Results and Discussion
The results of bulk density and relative density of the sintered samples are listed in Table 2. It can be seen that the sintered samples attained high final relative densities. Only sample A-4, sintered at 2080 °C for 1 hour and further heat treated at 2000 °C for 4 hours revealed a lower density. This observation is a consequence of reac-tions between Y2O3 and SiC, producing volatile compounds, as well as evaporation of SiC. This effect was not observed in the samples A80, probably due the lower Y2O3 content.
The microstructures of the samples are shown in Figure 4. It can
Table 1. Sample designation and composition.
Sample -SiC -SiC AlN Y2O3
wt.(%) wt.(%) wt.(%) wt.(%)
A 89 1 1.0795 8.9205
A80 89 1 4.2065 5.7934
Vol. 8, No 2, 2005 Fracture Toughness Measurements of LPS-SiC: A Comparison of the Indentation Technique and the SEVNB Method 123
Table 2. Bulk and relative density of the sintered samples.
Sample Sinter Condition Theoretical density Bulk density Relative density
(temp., time) (g/cm3) (g/cm3) (%)
A 2080, 1 hour 3.3236 3.313 99.64
A-4 2080, 1 hour + 2000, 4 hours 3.3236 2.948 88.68
A80 2080, 1 hour 3.2870 3.251 98.90
A80-4 2080, 1 hour + 2000, 4 hours 3.2870 3.267 99.38
Figure 4. Microstructures of sample a) A; b) A-4; c) A80; and d) A80-4. A
B
Figure 3. Notch produced by a cut with a diamond saw and tapered with a razor blade.
(a)
(b)
(c)
124 Strecker et al. Materials Research
be seen that the microstructures of the two samples, with different composition, A and A80, differ quite significantly. While samples with composition A had large and equiaxed grains, samples A80 had much smaller elongated grains. The differences in the microstructures are due to the different AlN additive content in the samples. It is known that higher N contents in the liquid phase retard the - to -SiC phase transformation, and also influence grain growth significantly. While grain growth is observed in samples with both compositions during the heat treatment, compare Figures 4a and 4b, and Figures 4c and 4d, relative growth is less in samples with high AlN content, A80. Furthermore, increased porosity in sample A-4, Figure 4b, is also clearly observed, consistent with the density measurements listed in Table 2.
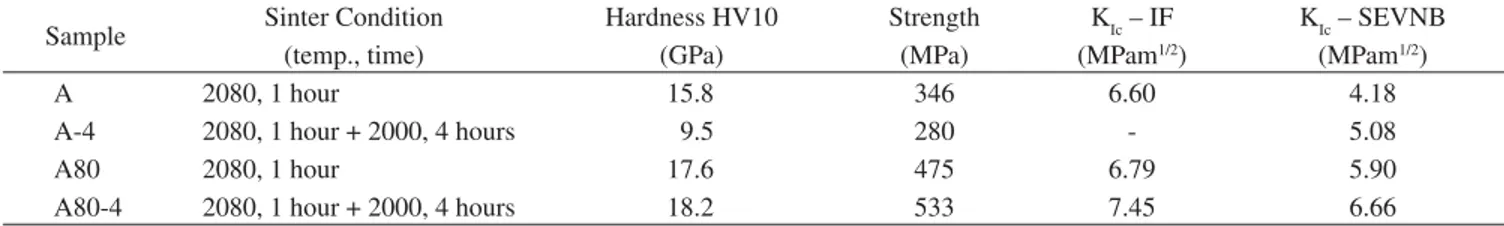
The hardness, 4-point bending strength and fracture toughness as determined by the IF method as well as the SEVNB method are summarized in Table 3. With respect to hardness of the samples, it can be concluded that the AlN rich A80 samples exhibited higher hardness. The lower hardness and strength of sample A-4, compared to sample A, is due to the higher porosity caused by formation of volatile compounds during the heat treatment. Meaningful results of fracture toughness of A4 samples could not be obtained by the indentation method, because the cracks formed were often branched or the crack length could not be determined.
The fracture toughness results reveal that the toughness of the heat-treated samples is higher than that of the as-sintered samples because of the grain growth. Furthermore it can be seen that the fracture toughness of the AlN rich samples, A80, are consistently higher than that of samples A, which is due to the more elongated grains in samples A80. The results of fracture toughness determined by the IF method are higher than those determined by the SEVNB method. This could reflect the difficulty in determining the exact crack length in the IF method, which is usually underestimated, and results in increased fracture toughness values. On the other hand, the results obtained by the SEVNB method show trends that are similar to those obtained by the IF method, because the notch introduced in the bending bars are well defined, and give reliable results.
4. Conclusions
From the results presented here, it can be concluded that increased AlN contents lead to increased hardness, strength and especially higher fracture toughness, because of the lower porosity and elongated microstructure in liquid phase sintered silicon carbide ceramics.
Regarding the fracture toughness measurements, it can be ob-served that the IF method led to consistently higher fracture tough-ness values compared to the results obtained by the SEVNB method, due probably to underestimation of the real crack length. Because of precise control of the introduced V-notch in the samples for the SEVNB method, the fracture toughness values are more reliable and reflect the material’s true property. Differences in the microstructure of the samples are reflected in the fracture toughness determined by both methods, indicating that the IF method can be used for internal comparison, but care has to be taken if results from different sources are to be compared.
References
1. Freimann, SW, Brittle Fracture Behavior of Ceramics. American Ceramic Society Bulletin. 1988; 67(2):392-402.
2. Evans, AG, Bradt, RC, Hasselman, DPH, Lange, FF. Fracture Mechanics Determinations.Fracture Mechanics of Ceramics, Concepts, Flaws, and Fractography. 1973; 1:17-47.
3. Anderson, RM. Testing Advanced Ceramics. Advanced Materials Processing. 1989; 3:31.
4. Pabst, RF, Kromp, K, Popp, G. Fracture Toughness-Measurement and Interpretation.Proceedings British Ceramic Society. 1982; 32: 89-94. 5. Paris, P C., Sih, G C. Fracture Toughness, Testing and Its Applications,
STP 381. American Society for Testing and Materials, 1965.
6. Evans, AG, Davidge, RW. The Strength and Oxidation of Reaction Sin-tered Silicon Nitride. Journal Materials Science. 1970;5:314-320. 7. Irwin, GR, Paris, PC. Fundamental Aspects of Crack Growth and Fracture,
Fracture III, H. Liebowitz, Ed., Academic Press; 1971. p. 2-7. 8. Fuller, ER., Thomson, RM., Bradt, RC, Hasselman, DPH, Lange, FF.
Lattice Theories of Fracture. Fracture Mechanics of Ceramics, v. 4, Ed., Plenum Press; 1978.
9. Wu, CC, Rice, M, RW, Becher, PF. The Character of Cracks in Fracture toughness Measurements of Ceramics, STP 745, Fracture Mechanics for Ceramics, Rocks and Concrete. American Society for Testing and Material. 1982; 127 p.
10. Anstis, GR, Chantikul, P, Lawn, BR, Marshall, DP. A critical Evaluation of Indentation Techniques for Measuring Fracture Toughness: I, Direct Crack Measurements. Journal American Ceramic Society. 1981; 64(9): 533-538.
11. Chantikul, P, Anstis, GR, Lawn, B., Marshall, DB. A critical Evaluation of Indentation Techniques for Measuring Fracture Toughness: II, Strength Method.Journal American Ceramic Society. 1981; 64(9): 539-543. 12. Salem, JA, Shannon, JL. Fracture Toughness of Si3N4 Measured With
Short Bar Chevron-Notched Specimens. Journal Materials Science. 1987; 22; 312-324.
13. Munz, D., Bubsey, R. T., Shannon, J. L. Fracture Toughness Determina-tion of Al2O3 Using Four Point Bend Specimens with Stright-Through and Chevron Notches. Journal American Ceramic Societ. 1980; 63 (5-6): 300-305.
14. Wu, SX. Stability and Optimum Geometry of Chevron Notched Three Point Bend Specimens. International Journal of Fracture. 1984; 26(2): R43-47.
15. Evans, A. G. Fracture Toughness, the Role of Indentation Techniques, STP678.American Society for Testing and Materials. 1979; p. 113. 16. Lawn, BR, Marshall, DB. Hardness, Toughness and Brittleness: An
Indentation Analysis. Journal American Ceramic Societ. 1979; 62(7-8): 347-351.
17. Niihara, K, Morena, R, Hasselman, DPH. Evaluation of KIc of brittle solids by the indentation method with low crack-to-indent ratios. Journal Materials Science Letters. 1982; 1:13-16.
18. Primas, R, Gstrein, R. ESIS TC 6 Round Robin on Fracture Toughness, EMPA report no. 155088, EMPA. Dübendorf: Switzerland; 1995. 19. Nishida, T., Hanaki, Y., Pezotti, G. Effect of Notch-Root Radius on the
Fracture Toughness of a Fine-Grained Alumina. Journal American Ce-ramic Society. 1994; 77(6):606-608.
20. Awaji, H., Sakaida, Y. V-Notch Technique for Single-Edge Notched Beam and Chevron Notch Methods. Journal American Ceramic Society. 1990; 76(11):3522-3523.
Table 3. Vickers hardness, 4-point bending strength and fracture toughness determined by the IF and SEVNB method.
Sample Sinter Condition Hardness HV10 Strength KIc – IF KIc – SEVNB
(temp., time) (GPa) (MPa) (MPam1/2) (MPam1/2)
A 2080, 1 hour 15.8 346 6.60 4.18
A-4 2080, 1 hour + 2000, 4 hours 9.5 280 - 5.08
A80 2080, 1 hour 17.6 475 6.79 5.90