*e-mail: [email protected]
1. Introduction
The use of renewable fuels, as biomass, has become attractive these days due to enhanced interest in global climate change. From the ironmaking perspective, the most promising renewable reducing agent scenario is based on use of charcoal in blast furnace. The replacement ratio of fossil-based reducing agents achieved with charcoal is the highest, thus leading to the largest decrease in fossil-based coke consumption1.
Charcoal is particularly interesting for Brazil due to its tropical climate and large areas for planting. This country has the world’s largest steel industry based on charcoal blast furnace2. Presently, the pig iron production based on this reducing agent is limited to Brazil and Paraguay, where furnace sizes and production are limited by the relatively low compression resistance of charcoal3.
Of the 10 million t of charcoal produced annually in Brazil, almost 70% is allotted to steel and pig iron manufacture to producing 7 million t of raw steel. About 34% of charcoal output goes to integrated steel mills and 66% to independent producers4. Unfortunately, the charcoal production by independent producers of pig iron is still quite rudimentary. Beyond the CO2 gas emissions there is also generation of large amounts of charcoal ines, which might become environmental liability. So, these charcoal ines from carbonization process should take a correct destination.
Biomass fuels, such as charcoal, are considered environmentally friendly for several reasons. First, there is no net increase in CO2 as a result of burning biomass fuel because biomass consumes the same amount of CO2 from atmosphere during its growth which is released during combustion. Most biomass fuels have very little or no sulfur, which is interesting from point of view of ironmaking.
Typically, woody biomass contains very little nitrogen on mass basis as compared to coal5.
Pulverized coal injection (PCI) is one of the most effective technologies to reduce blast furnace coke consumption. It consists in fuel injection by a lance in tuyeres area of blast furnace. PCI can replace up to 40–50% of the coke required for the blast furnace, which could lead to a signiicant decrease in pig iron cost due to the considerable difference in price between coking and non-coking coal6. The main injector currently used is coal, but the lexibility of PCI process allows an expansion of fuels used in ironmaking, especially in blends with coal7-11.
A high combustibility is essential for a fuel for PCI. Moreover, the char (unburnt coal) generated should be highly reactive to CO2, so that is possible its consumption in the blast furnace stack, generating gas for iron reduction6,8,12. This study purposes the use of charcoal for injection in coke-based blast furnaces, since this fuel is already injected into charcoal-based blast furnaces. This way, the use of coke and CO2 emissions in ironmaking would be reduced. The work aimed to evaluate the combustibility (or reactivity to air) and reactivity to CO2 of binary blends of charcoal ines and coals with purpose to PCI. Furthermore, it was also attempted to identify the reasons for the different behavior of coals.
2. Material and methods
The selected fuels for this study were three typical PCI coals of different ranks and origins identiied as A (Colombian), B (Russian), and C (Australian), and Brazilian charcoal ines from wood carbonization, named as CC. These samples were prepared by quartering and crushing according to ASTM D 2013-0313. Characterization was performed by proximate analysis (ABNT NBR 828914, NBR 829015 and NBR 829316), ultimate analysis (ASTM D 5373-0817), gross
Combustibility and reactivity of coal blends and charcoal ines aiming use in ironmaking
Claudia Caroline Teixeira Barbieria*, Eduardo Osórioa, Antonio Cezar Faria Vilelaa
aIron and Steelmaking Laboratory – LASID/PPGE3M, Technology Center, Federal University of Rio Grande
do Sul – UFRGS, Av. Bento Gonçalves, 9500, P.O. Box 15021, 91501-970, Porto Alegre, RS, Brazil
Received: November 20, 2015; Revised: February 15, 2016; Accepted: March 11, 2016
Charcoal is a very important reducing agent in Brazil, the world’s largest steel industry based on charcoal blast furnace. Charcoal generates large amounts of charcoal ines during its production and processing. A good alternative for harnessing this fuel is the injection into coke-based blast furnaces via PCI process (Pulverized Coal Injection), a key technology for reducing use of coke in ironmaking. This study aimed to evaluate the combustibility and reactivity to CO2 of binary blends of charcoal ines and coals with purpose to PCI. Moreover, it was also attempted to identify the reasons for the different behavior of coals. The work was carried out by thermogravimetric analysis (TGA). The proportions of charcoal used were 10, 20 and 50% in mass. Charcoal showed the highest combustibility and reactivity among tested fuels and the blends formulated had higher combustibility and reactivity than single coals.
caloriic value (ASTM D 5865-0418), Free Swelling Index – FSI (ASTM D 720-9119) and Particle Size Distribution (PSD) by laser diffraction20. The results generated in the particle size measurements consist of parameters D10, D50 and D90. D10 has been deined as the diameter where 10% of the population lies below this value. Similarly, 50% of the distribution lies below the D50 and 90% of the population lies below the D90. Parent coals were also characterized by petrographic analysis (maceral and vitrinite relectance) (ISO 7404/3-8421 and ISO 7404/5-8422, respectively). Blends were characterized by proximate analysis (ABNT NBR 828914, ABNT NBR 829015 and ABNT NBR 829316).
Thermogravimetric Analysis (TGA) have been used to assess coal performance mainly on the basis of their lexibility and well-controlled conditions and because they provide an inexpensive, rapid and simple method for revealing trends in behavior23-27. Although reactivity may be reliably and eficiently determined by this technique, no standard testing method has been established. Consequently, while a comparison of qualitative trends arising from coal properties may be made, no meaningful comparison of quantitative results between different researchers or industrial analysts is possible28.
Coal combustion performance is often estimated through relevant temperatures extracted from TGA combustion proiles, which are deined as the irst derivate of the weight loss curve (DTG) obtained usually from testing at air atmosphere. Temperatures Ti (initiation temperature or temperature, at which the weight loss reaches one ifth of the maximum reactivity), Tp (peak temperature, at which maximum reactivity occurs) and Tb (burnout temperature, at which weight loss ceases) was determined as shown in elsewhere26,29. Combustibility of coals can be provided by the peak temperature and the lower this temperature, the greater the combustibility of the coal29-31. This was the parameter used to compare the differences in the thermal behavior in the present work.
Coal preparation for combustibility and reactivity to CO2 tests by TGA was done by grounding and sieving to a 90 µm particle top size in agate mortar. Charcoal ines used in this study were in a particle size lower than 1 mm because of their higher reactivity compared to coal32. Binary blends coal-charcoal ines were prepared by adding 10, 20 and 50% in mass of charcoal and then homogenized for 30 minutes on a Wagner’s shaking machine Marconi MA 160.
Combustibility tests were carried out on a thermoanalyzer Netzsch STA 409 PC Luxx. Experimental conditions were established based on previous works26,33. Samples of 30 mg were spread on an alumina dish crucible (17 mm diameter) and heated from 40 to 1000 °C at a heating rate of 30 °C min−1 under air at a low rate of 100 mL/min. Results were expressed by the equation R = -1/w0 (dw/dt), where R is the reaction rate or reactivity, w0 is the initial weight of the sample ash-free and dw/dt is the instantaneous sample weight. Reactivity here deined is named apparent reactivity as opposed to intrinsic reactivity, which is corrected for the speciic surface area.
For reactivity to CO2 tests the reactivity at 50% conversion was adopted as the comparison parameter 23,24,34. Conversion was calculated according to the equation X = (w0 – w)/ (w0 – wa),
where X is conversion, w0 is initial devolatilized weight, wa is weight of ashes (dry basis) and w is the weight in the time in which the conversion is evaluated. Samples were analyzed in duplicate and weights were corrected for buoyancy effects. Experimental conditions were also established based on previous works7,8. The irst step consisted in char production by pyrolysis of coals, charcoal and blends. Samples of 30 mg were spread on an alumina dish crucible (17 mm diameter) and heated from 40 to 1000 °C at a constant rate of 30 °C min−1 under nitrogen at a low rate of 100 mL/min. Chars were kept in these conditions for 10 minutes to ensure the release of volatile matter and stabilization of weight. Afterwards, the gas was changed to CO2, at the same low, starting the gasiication reaction (Boudouard reaction) in an isotherm at 1000 ºC, which was inished after a new stabilization of weight.
For morphology and porosity assessment, chars were produced on the thermoanalyzer mentioned. The procedure consisted in heating of the fuels at 1000 ºC from 40 to 1000 °C at a constant rate of 30 °C min−1 under nitrogen at a low rate of 100 mL/min. Chars were attached on double stick carbon tape suitable for Scanning Electron Microscopy (SEM) and metallized with gold. Morphological examinations by SEM were performed on a Zeiss EVO50 microscope.
Speciic surface area of chars was assessed by mesopore and micropore surfaces areas using BET35 and DR36 methods, respectively. BET is performed in N2 at 77 K, while DR uses CO2 at 273 K. Both adsorptives have limitations for determining the porosity of microporous carbons, as coals. Nitrogen at 77 K is known to be subject to very slow diffusion in small pores, while at 273 K CO2 is not able to ill larger micropores and also may have additional interactions with carbon37. So, these techniques can be considered complementary ones. The equipment used was a NOVA 2200e surface area and pore size analyzer. Chars were outgassed under vacuum prior to gas adsorption experiments in order to eliminate moisture and condensed volatiles for better adsorbate accessibility. Samples were held for 20 h at 350 ºC, a temperature well below the char preparation temperature and, therefore, expected to preserve the char structure.
3 Results and discussion
3.1 Samples characterization
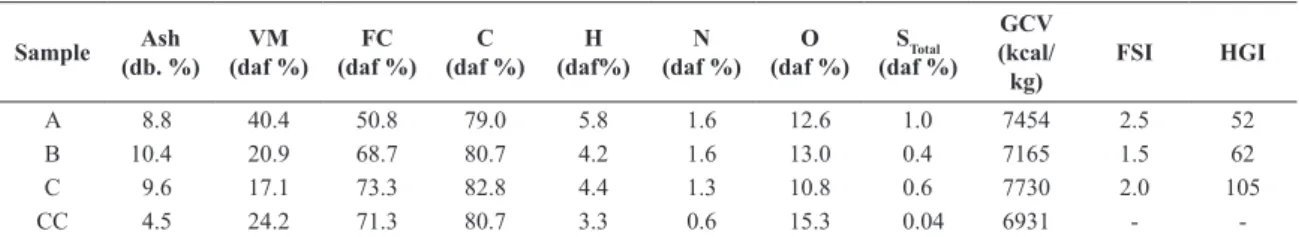
Samples identiication and results from chemical/physical analysis of single fuels are shown in Table 1. Coals were arranged in Table 1 in descending order of volatile matter. As the ash content limit generally accepted is 10% (wt), all the coals are suitable for injection in this regard, being the coal B slightly over this limit. Ash content of woody biomass is between 0.5 and 2% in most species, however there was a possible contamination of the charcoal used in this study during its production and processing, leading to higher ash content (4.5%).
sulfur also causes SOx emissions. All the coals attended this speciication of 1%. Besides charcoal has low nitrogen content, showing potential to emit less NOx on its burning5. As seen in Table 1, the gross caloriic values range from 6931 to 7730 kcal/kg, lying on the range for injection39.
FSI test was carried out just for coals because charcoal does not undergo carboniication but carbonization therefore does not have binding properties. Coals tested showed weak binding properties on FSI test, a positive aspect for PCI. Coal A has the highest Free Sweeling Index (FSI 2.5). However, in low rank coals, as in this case, this high FSI might be related to the low viscosity of the mass which allows easy escape of volatile matter, causing swelling. Coal A has the lowest HGI (value 52), typical for low rank coals6, which are harder to grind. Coals commonly used in PCI present HGI above 5038.
The particle size distribution of the samples by laser diffraction is given in Table 2. If dimensions of particles tend to extend over a short diameters interval (and thus particles have similar dimensions) the PSD is narrow, which is expressed by a low value for D90/ D10. For PCI, a narrow PSD is the best because reactivity depends on particle size. Non-sphericity of particles usually results in widening of the PSD20. This can be conirmed on Table 2 by a high D90/ D10 value for CC, a material characterized by part of their particles in shape of splinters. The great amount of particles larger than the value established (1 mm) for CC (90% below 1466.83 μm) is because the passage of these particles through the sieve depended on their orientation (if vertical or horizontal). Among coals, coal A, with the lowest HGI (52) and therefore the hardest, shows larger particles (78.75 µm), as expected. This sample was the most homogeneous regarding particle size probably because its greater dificulty in grinding. However, the lowest particle sizes (57.86 µm) weren’t found for the softest coal, C (HGI 105) but for coal B (HGI 62).
Petrographic analysis are used to determinate the rank and the maceral composition of a coal. Macerals are deined as microscopically recognizable organic constituents of coal and they are divided into three groups: vitrinite, liptinite and inertinite. Rank is the degree of maturity of a coal, usually determined the relectance of vitrinite – Rr (%)40 and it is the main parameter for coal classiication. Petrographic analysis were performed on a Leica DM 6000M microscope and the results are shown on Table 3.
Petrographic analysis revealed that coals B and C, currently in use in industry for injection purposes, are in fact blends. This possibility of detecting blends that only petrography provides is very valuable from an industrial point of view,
because justiies an unexpected behavior of fuels that would be considered isolated coals but are indeed blends. Blends were detected by different groups of vitrinite. For those samples, B and C, Rr (%) given in Table 3 is the average relectance of all groups of vitrinite present whereas the maceral content showed is the total. Coal A is considered subbituminous A (Rr = 0.62), coal C is a blend of high volatile bituminous (R1 = 0.83), medium volatile bituminous (R2 = 1.27) and low volatile bituminous (R3 = 1.83). Coal B is composed of subbituminous A (R1 = 0.64), medium volatile bituminous (R2 = 1.19), semi-anthracite (R3 = 2.51) and meta-anthracite (R4 = 4.06). It should be highlighted that anthracites burn with dificulty, which for injection into blast furnaces is problematic due the large amounts of char generated. Coals B and C have high inertinite content. In general for combustion inertinites are less reactive than vitrinites in a coal because of its aromatic chemical structure41. Coal A showed the highest liptinite content, in accordance with its high volatile matter content.
Table 4 shows the results for blends characterization carried out by proximate analysis.
According to Table 4, as the proportion of CC increased, there was a trend to reduce the ash content. Blends contained Table 1. Chemical/physical characterization of single fuels
Sample Ash
(db. %) VM (daf %)
FC (daf %)
C (daf %)
H (daf%)
N (daf %)
O (daf %)
STotal (daf %)
GCV
(kcal/
kg) FSI HGI
A 8.8 40.4 50.8 79.0 5.8 1.6 12.6 1.0 7454 2.5 52
B 10.4 20.9 68.7 80.7 4.2 1.6 13.0 0.4 7165 1.5 62
C 9.6 17.1 73.3 82.8 4.4 1.3 10.8 0.6 7730 2.0 105
CC 4.5 24.2 71.3 80.7 3.3 0.6 15.3 0.04 6931 -
-VM: volatile matter; db: dry-free basis; daf: dry-ash-free; FC: ixed carbon; GCV: Gross Caloriic Value; FSI: Free Swelling Index; HGI: Hardgrove Index
Table 2. Particle size distribution (PSD) of the fuels tested
Sample DMean D90 (μm) D50 (μm) D10 (μm) D90/ D10
A 41.80 78.75 39.30 6.32 12.46 B 27.64 57.86 23.83 2.41 24.01 C 29.82 69.95 22.73 2.03 34.46 CC 596.13 1466.83 392.65 21.78 67.35 DMean: Mean diameter; DX: diameter where X% of the population lies below the value showed; D90/ D10: PSD width.
Table 3. Petrographic analysis of coals
A B C
Rr (%) 0.62 1.59* R1: 0.64 R2: 1.19 R3: 2.51 R4: 4.06
1.35* R1: 0.83 R2: 1.27 R3: 1.83
Vitrinite (% v) 73.0 65.8** 62.1** Liptinite (% v) 12.0 2.4** 0.6** Inertinite (% v) 9.4 30.0** 32.1** Minerals (% v) 4.8 3.2** 5.2**
Others 0.8 -
up to 10% ash, itting in the appropriate range for injection. Regarding ixed carbon, coal A showed a relationship of direct proportionality according to the content of CC added. For coal A, high volatile, the addition of CC caused reduction of volatile matter content of the blends. This is a positive point as this coal shows a volatile matter content slightly above 40%, limit established for coals to injection.
3.2 Combustibility tests
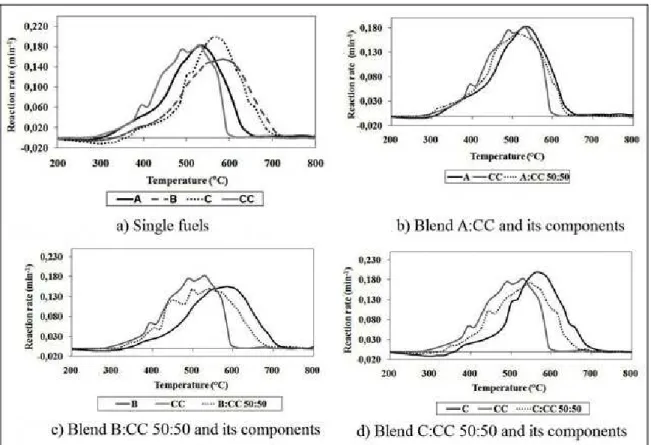
Figure 1 shows combustion proiles of single fuels and blends 50:50, which were chosen for representation because they are the ones that showed the greatest differences in relation to the proiles of single fuels. Table 5 gives the characteristics temperatures obtained from all combustion proiles. To better understanding, discussions will be based jointly in Figure 1 and Table 5.
It is possible notice in Figure 1a, 1b, 1c and 1d negatives reaction rates before the combustion onset. This is commonly
attributed to an increase in weight caused by oxygen chemisorption in the carbon structure25,29. Oxygen chemisorption was more pronounced in coals and practically was not seen on charcoal (Figure 1a), possibly because particle size of charcoal is bigger than particle size of coals. Charcoal shows the lowest Tp of all samples, therefore this is the sample with the highest combustibility. Among coals, low rank coal (A) has the highest combustibility, with the lowest Tp (539 °C). Coal B (high rank) has the least combustibility, in agreement with the literature30, which demonstrate that with increasing rank the combustion proile shifts to higher temperature.
Combustibility order according to the criterion of the lowest Tp is CC > A > C > B. The lower combustibility of coal B is explained by anthracites in its composition, which burn hardly because their structure highly graphitized, expressed by their higher vitrinite relectance. As was said previously, a coal for PCI have to show high combustibility, generating the least amount of char for avoid operational problems in
Table 4. Blends characterization by proximate analysis
A:CC 90:10
A:CC 80:20
A:CC 50:50
B:CC 90:10
B:CC 80:20
B:CC 50:50
C:CC 90:10
C:CC 80:20
C:CC 50:50
Ash (db. %)
8.8 8.5 7.4 9.8 9.3 7.7 9.9 9.1 7.9
VM (daf %)
37.5 35.7 32.3 21.2 21.4 22.7 17.5 18.9 20.0
FC (daf %)
53.7 55.8 60.3 69.0 69.3 69.6 72.6 72.0 72.1
VM: volatile matter; db: dry-free basis; daf: dry-ash-free; FC: ixed carbon
the blast furnace. Regarding to coals which are in fact blends (B and C), coal B has vitrinites with lower relectance (0.64), then it starts burning before coal C, which contains vitrinites with higher relectance (0.83). It is also observed that Tb is the highest for coal B, being in agreement with the presence of anthracites already mentioned.
Combustion proiles and relevant temperatures of blends reveal a decrease in peak temperature with the addition of charcoal, indicating a higher combustibility. This can be attributed to a combined effect of volatile combustion from charcoal and coal pyrolysis. Biomass pyrolysis starts earlier coal pyrolysis5 and, therefore, the volatiles released from charcoal would enhance the surrounding coal devolatilization. This behavior was also observed on a study of sawdust-coal co-iring developed by Abbas et al.42. The authors explain that this early ignition of biomass is a key factor in the earlier completion of volatile combustion and the consequential improvement in particle burnout.
3.3 Reactivity to CO
2tests
As mentioned earlier, the reactivity parameter used in this study was reactivity at 50% conversion (R50%). Figure 2 shows the reactivities to CO2 curves of chars of single fuels and blends in the ratio 50%-50% in mass as function of time. Although the plot is shown only for the 50:50 blends, the discussion will be based on all formulated blends. Values of reactivity at 50% conversion and the time for achieve it are contained in Table 6.
According to Table 6, charcoal char has the highest reactivity among the fuels. This higher reactivity was expected because of high porosity characteristic of charcoal char, which means a larger surface area available for reaction5. For
Table 5. Relevant temperatures of samples
Sample Ti (°C) Tp (°C) Tb (°C)
CC 381 510 598
A 382 539 642
A:CC 90:10 376 526 635
A:CC 80:20 374 519 616
A:CC 50:50 369 517 631
B 424 589 710
B:CC 90:10 412 580 712
B:CC 80:20 403 560 705
B:CC 50:50 382 543 680
C 455 561 698
C:CC 90:10 421 554 684
C:CC 80:20 419 561 678
C:CC 50:50 394 547 664
Figure 2. Reactivities to CO2 curves of single fuels and blends in the ratio 50:50
Table 6. Reactivities to CO2 of chars at 50% conversion and time to achieve this conversion
Sample R50% (min
-1) t
50% (min)
CC 0.0592 7.8
A 0.0165 48.7
A:CC 90:10 0.0366 10.5
A:CC 80:20 0.0395 9.9
A:CC 50:50 0.0466 8.6
B 0.0175 23.1
B:CC 90:10 0.0179 22.0
B:CC 80:20 0.0178 21.3
B:CC 50:50 0.0261 14.5
C 0.0130 26.2
C:CC 90:10 0.0148 23.3
C:CC 80:20 0.0176 19.7
PCI a high reactivity like this will result in less char leaving the raceway. Among coals, char from coal A has the lowest reactivity, contrary to which would be expected due to its low rank. The very long time this coal took to reach R50% may be related to its Free Swelling Index (FSI), which was the highest. The high rank of coal C is consistent with its low reactivity, as well as long time to reach 50% conversion is in accordance with its high inertinite content.
Still according to Table 6, the descending order for reactivity to CO2 is CC > B > A > C. Charcoal char is much more reactive than any of the fuels tested. Blends with coal A showed highest reactivities, consistent with its low rank. Coal C, high rank, also shows notable reactivity gain by adding CC. A very interesting detail is that the low reactivity of coal
A only manifests itself in single coal. In any proportion of CC added the reactivity increases considerably. One possible explanation would be the fact that charcoal, being an inert material to agglutination, prevents agglomeration of coal during pyrolysis. This way, the surface of char particles generated would be more exposed to gasiication.
3.4. Morphology and porosity
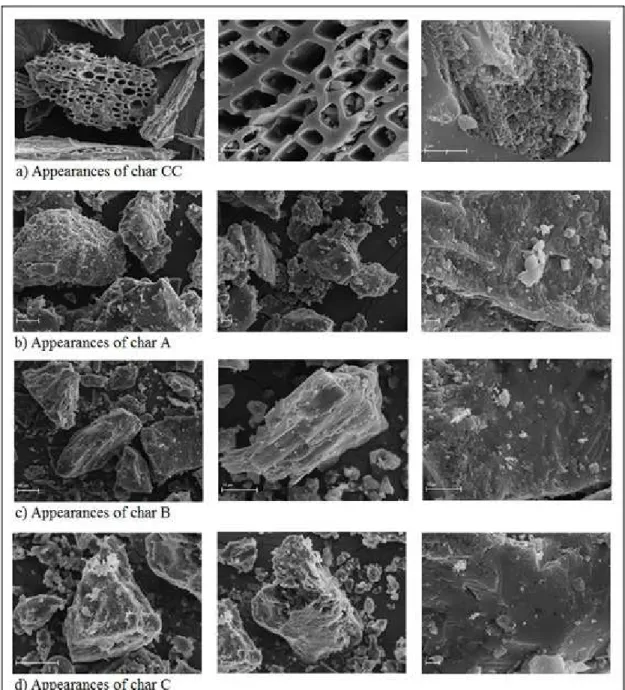
Figure 3 illustrates the morphology of the chars obtained at SEM analysis.
It can be seen on Figure 3a that the char CC is highly porous and maintains the original ibrous structure of vegetal, which explains its higher combustibility and reactivity to CO2. There are no signiicant observable morphological
differences between coal chars (Figures 3b, 3c and 3d). They are characterized by massive structures, which can be attributed to the low heating rate of TGA. At low heating rates the volatiles are released at a slow rate escaping through existing pores or cracks, avoiding abrupt fragmentation and ruptures that occur at high heating rates as that found in a blast furnace. For seeing signiicantly differences on chars structures would be necessary higher heating rates, which could be achieved by a PCI injection rig or a drop tube furnace. In these conditions, considering the higher volatile matter content of coal A (40.4%) and its higher FSI (2.5) we should have cenospherical chars, which consist of spherical particles with thin walls and voids resulting of quick release of volatile matter.
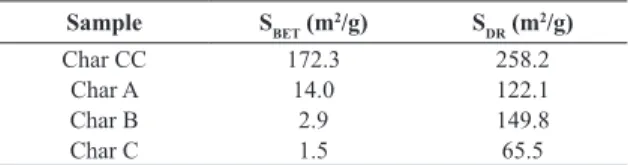
Table 7 contains the values of speciic surfaces areas of meso- (SBET) and micropores (SDR). These techniques, as mentioned before, can be considered complementary ones.
Porosity is an important factor for PCI because it affects the accessibility of O2 or CO2 to the internal char surfaces. SBET areas were lower than SDR areas, conirming that the most of the pores of coal are closed to nitrogen at 77 K but accessible to CO2 at 273 K43. Char CC areas are the highest, in agreement with the higher combustibility and reactivity to CO2 observed in Tables 5 and 6. In addition, chars with similar SBET and SDR surface areas are believed to have larger pores44, which can be viewed on SEM images for char CC (Figure 3a). Chars A, B and C show high SDR areas and low SBET areas, indicating an extensive micropore network. Char C areas are the lowest because the rank of parent coal is the lowest and regarding this we could expected the combustibility and reactivity to CO2 followed the same trend. However, due to the presence of anthracites in coal B this was the sample that showed the lowest combustibility and reactivity to CO2. Among coal chars, char A areas are the highest (parent coal shows the highest rank) in agreement with the higher combustibility of parent coal. But for reactivity to CO2 we didn’t found the highest value. This unexpected behavior is probably related to other factors, such as inluence of mineral matter.
Table 7. Speciic surfaces areas of the chars related to meso- (SBET ) and microporosity (SDR)
Sample SBET (m
2/g) S
DR (m 2/g)
Char CC 172.3 258.2
Char A 14.0 122.1
Char B 2.9 149.8
Char C 1.5 65.5
SBET: speciic surface area determined on N2 isotherms by the BET method; SDR: speciic surface area determined on CO2 isotherms by the DR method.
4. Conclusions
The main conclusions of this study are summarized as follows:
• charcoal ines showed extremely low sulfur content (0.04%), low ash content (4.5%) and medium volatile matter content (24.2%), positive aspects for PCI; • coals B and C, currently in use in industry for injection
into blast furnaces, are in fact coal blends, which was only possible to be detected by petrographic analysis. Coal B is a blend of sub-bituminous A coal, bituminous medium volatile coal, semi-anthracite and meta-anthracite. Coal C is composed of bituminous high, medium and low volatile;
• binary blends of coals and charcoal in ratios 10, 20 and 50% of charcoal would be considered satisfactory for PCI;
• combustibility order of single fuels is CC - 1 mm (Tp: 510 ºC) > A - 90 µm (Tp: 539 ºC) > C - 90 µm (Tp: 561 ºC) > B - 90 µm (Tp: 589 ºC);
• reactivity to CO2 order of single fuels is CC - 1 mm (R50%: 0.0592 min-1) > B - 90 µm (R
50%: 0.0175 min -1)
> A - 90 µm (R50%: 0.0165 min-1) > C - 90 µm (R 50%: 0.0130 min-1).
5. Acknowledgements
The authors thank CNPq for inancial support to the project.
6. References
1. Suopajärvi, H, Pongrácz E, Fabritius, T. The potential of using biomass-based reducing agents in the blast furnace - A review of thermochemical conversion technologies and assessments related to sustainability. Renewable and Sustainable Energy Reviews. 2013;25(45): 511-528. DOI: 10.1016/j.rser.2013.05.005
2. Centro de Gestão e Estudos Estratégicos (CGEE). Roadmap tecnológico para produção, uso limpo e eiciente do carvão mineral nacional 2012 a 2035 [Internet]. Brasília: Ministério da Ciência, Tecnologia e Inovação (MCTI); 2012. [cited 2015 Jun 19]. Available from: http://www.cgee.org.br
3. Feliciano-Bruzual C, Mathews J. Bio-PCI A renewable reductant for blast furnaces - CO2 mitigation potential and economical assessment. In: 42º Seminário de Redução de Minério de Ferro e Matérias-primas. Anais. Rio de Janeiro; 2012. p.1913-1927.
4. Medeiros JX. Charcoal-fueled steel production in Brazil: an exercise in environmental valuation. In: Natural resources valuation and policy in Brazil: methods and cases. New York: Columbia University Press; 1999. p. 85-112.
5. Sami, M, Annamalai, K, Wooldridge, M. Co-firing of coal and biomass fuel blends. Progress in Energy and Combustion Science. 2001;27:171-214.
6. Kalkreuth, W, Borrego, AG, Alvarez, D, Menendez, R, Osório, E, Ribas, M. et al. Exploring the possibilities of using Brazilian subbituminous coals for blast furnace pulverized fuel injection.
Fuel [Internet]. 2005[cited 2014 Nov 21];84:763-772. Available from: http://citeseerx.ist.psu.edu/viewdoc/download?doi=10.1 .1.472.9072&rep=rep1&type=pdf
7. Osório E, Gomes ML, Vilela AC, Kalkreuth W, Almeida MA, Borrego AG, et al. Evaluation of petrology and reactivity of coal blends for use in pulverized coal injection (PCI). International Journal of Coal Geology. 2006;68(1-2):14-29. doi:10.1016/j. coal.2005.11.007
8. Machado JG, Osório E, Vilela AC. Reactivity of Brazilian coal, charcoal, imported coal and blends aiming to their injection into blast furnaces. Materials Research. 2010;13(3):287-292.
10. Sahu SG, Mukherjee A, Kumar M, Adak A, Sarkar P Biswas S, et al. Evaluation of combustion behaviour of coal blends for use in pulverized coal injection (PCI). Applied Thermal Engineering.
2014;73(1):1014-1021. doi:10.1016/j.applthermaleng.2014.08.071
11. Du SW, Chen WH, Lucas JA. Pretreatment of biomass by torrefaction and carbonization for coal blend used in pulverized coal injection. Bioresource Technology. 2014;161:333-339.
12. Gomes ML, Osório E, Vilela AC. Thermal analysis evaluation of the reactivity of coal mixtures for injection in the blast furnace.
Materials Research. 2006;9(1):91-95.
13. American Society for Testing and Materials – ASTM. ASTM D 2013 – 03Standard Practice for Preparing Coal Samples for Analysis. West Conshohocken, PA: ASTM; 2003.
14. Associação Brasileira de Normas Técnicas - ABNT. NBR 8289: carvão mineral – Determinação do teor de cinzas. Rio de Janeiro: ABNT; 1983.
15. Associação Brasileira de Normas Técnicas - ABNT. NBR 8290: carvão mineral – Determinação do teor de matérias voláteis.
Rio de Janeiro: ABNT; 1983.
16. Associação Brasileira de Normas Técnicas - ABNT.NBR 8293: carvão mineral – Determinação do teor de umidade. Rio de Janeiro: ABNT; 1983.
17. American Society for Testing and Materials – ASTM. ASTM D 5373. Standard Test Methods for Instrumental Determination of Carbon, Hydrogen, and Nitrogen in Laboratory Samples of Coal. - 08. West Conshohocken, PA ASTM; 2008.
18. American Society for Testing and Materials – ASTM. ASTM D 5865-04.Standard Test Method for Gross Caloriic Value of Coal and Coke. West Conshohocken, PA: ASTM; 2004.
19. American Society for Testing and Materials – ASTM. Standard Test Method for Free-Swelling Index of Coal. ASTM D 720-91.
West Conshohocken, PA: ASTM; 1971.
20. Merkus, HG. Particle size measurements: fundamentals, practice, quality. New York: Springer Science & Business Media; 2009. Vol. 17
21. International Organization for Standardization – ISO. ISO 7404/3-1984.Methods for the petrographic analysis of bituminous coal and anthracite – Part 3: Method of determining maceral group composition. Vernier, Geneva: ISO; 1984.
22. International Organization for Standardization – ISO. ISO 7404/5-1984.Methods for the petrographic analysis of bituminous coal and anthracite – Part 5: Method of determining microscopically the relectance of vitrinite. Vernier, Geneva: ISO; 1984. 23. Alonso MJ, Borrego AG, Alvarez D, Menéndez R. A reactivity
study of chars obtained at different temperatures in relation to their petrographic characteristics. Fuel Processing Technology.
2001;69(3):257-272. doi:10.1016/S0378-3820(00)00146-6
24. Ollero P, Serrera A, Arjona R, Alcantarilla,S. Diffusional effects in TGA gasification experiments for kinetic determination. Fuel.
2002;81(15):1989-2000. doi:10.1016/S0016-2361(02)00126-6
25. Biswas S, Choudhury N, Sarkar P, Mukherjee A, Sahu SG, Boral P, et al. Studies on the combustion of blends of Indian coals by TGA and Drop Tube Furnace. Fuel Processing Technology.
2006;87(3):191-199. doi:10.1016/j.fuproc.2005.05.002
26. Osório E, Ghiggi ML, Vilela AC, Kalkreuth WD, Borrego AG. Non isothermal combustion of coal blends in a thermobalance as seen by optical microscopy. Thermochimica Acta. 2008;475(1):1-7. doi:10.1016/j.tca.2008.06.002
27. Pohlmann JG, Osório E, Vilela AC, Borrego AG. Reactivity to CO2 of chars prepared in O2/N2 and O2/CO2 mixtures for
pulverized coal injection (PCI) in blast furnace in relation to char petrographic characteristics. International Journal of Coal Geology. 2010;84(3-4):293-300. doi:10.1016/j.coal.2010.10.008
28. Shaw KJ, Beamish BB, Rodgers,KA. Thermogravimetric analytical procedures for determining reactivities of chars from New Zealand coals. Thermochimica Acta. 1997;302(1-2):181-187.
29. Alonso MJ, Borrego AG, Alvarez D, Kalkreuth W, Menéndez R. Physicochemical transformations of coal particles during pyrolysis and combustion. Fuel. 2001;80(13):1857-1870. doi:10.1016/S0016-2361(01)00071-0
30. Haykiri-Açma H, Ersoy-Meriçboyu A, Küçükbayrak S. Combustion reactivity of different rank coals. Energy Conversion and Management. 2002;43(4):459-465. doi:10.1016/S0196-8904(01)00035-8
31. Ulloa C, Borrego AG, Helle S, Gordon AL, García, X. Char characterization and DTF assays as tools to predict burnout of coal blends in power plants. Fuel. 2005;84(2-3):247-257. doi:10.1016/j.fuel.2004.08.008
32. Barbieri CC. Estudos de misturas de carvões e biomassa visando a combustão em alto-forno. [Dissertaçao]. Porto Alegre: Universidade Federal do Rio Grande do Sul; 2013.
33. Kalkreuth W, Lunkes KM, Oliveira J, Ghiggi ML, Osório E, Souza K, et al. The lower and upper coal seams of the Candiota
Coalield, Brazil - Geological setting, petrological and chemical
characterization, and studies on reactivity and beneficiation related to their combustion potential. International Journal of Coal Geology. 2013;111:53-66. doi:10.1016/j.coal.2012.09.013
34. Borrego AG, Alvarez D, Menéndez R. Effects of inertinite content in coal on char structure and combustion. Energy & Fuels. 1997;11(3):702-708.
35. Brunauer S, Emmett P, Teller EJ. Adsorption of gases in multimolecular layers. Journal of the American Chemical Society.1938;60(2):309–315. DOI: 10.1021/ja01269a023
36. Dubinin MM, Radushkevich LV. Equation of the characteristic curve of activated charcoal. Proceedings of the National Academy of Sciences, USSR. 1947;55:331–335.
37. Feng B, Bhatia SK. Variation of the pore structure of coal chars
during gasiication. Carbon. 2003;41(3):507-523.
38. Hutny WP, Giroux L, MacPhee JA, Price J T. Quality of coal for blast furnace injection. In: Blast Furnace Injection Symposium. Proceedings.Cleveland, Ohio; 1996. p. 1-31.
39. Carpenter AM. Use of PCI in blast furnaces. London, UK: IEA Clean Coal Centre; 2006.
40. Carpenter AM. Coal Quality assessment – The validity of empirical tests. London, UK: IEA Clean Coal Centre; 2002.
41. Milligan, JB, Thomas, KM, Crelling, JC. Temperature-programmed combustion studies of coal and maceral group concentrates. Fuel. 1997;76(13):1249-1255. DOI: 10.1016/ S0016-2361(96)00236-0
42. Abbas T, Costen P, Kandamby NH, Lockwood FC, Ou JJ. The influence of burner injection mode on pulverized coal and biomass co-fired flames. Combustion and Flame. 1994;99(3):617-625.
43. Amarasekera G, Scarlett MJ, Mainwaring DE. Micropore size distributions and specific interactions in coals. Fuel.
1995;74(1):115-118. doi:10.1016/0016-2361(94)P4341-X