A STUDY ON COAL BLENDING FOR REDUCING
NO
xAND N2O LEVELS DURING FLUIDIZED BED
COMBUSTION
D. BOAVIDA1, P. ABELHA1, I. GULYURTLU1, B. VALENTIM2, and M. J. LEMOS DE SOUSA2*
1
DEECA-INETI, Edifício J, Estrada do Paço do Lumiar 22, 1649-038 Lisboa, Portugal
2
Departamento e Centro de Geologia (GIPEGO) da Universidade do Porto, Praça de Gomes Teixeira, 4099-002 Porto,
Portugal
The objective of the study was to investigate the effect of blending on the emissions of NOx and N2O during the fluidized bed combustion of five coals with different levels of nitrogen, volatile
matter, and fixed carbon contents, and diverse coal and char petrographic composition.
The devolatilization chars were produced in a fluidized bed combustor. Using the petrographic analyses of the coals, sixteen coal blends were made to carry out the combustion tests.
The combustion of individual coals and the sixteen blends was carried out in an electrically heated atmospheric fluidized bed combustor.
The emissions of NOx reached maximum values at a bed temperature around 1173 K and de-creased with lower combustion temperatures. The amount of nitrous oxide formed dede-creased, for all five coals, as the bed temperature increased from 1053 to 1303 K. These trends are consistent with the observed experimental data obtained by other researchers. It was observed that for ratios of 1.3 to 1.6 of fixed carbon to volatile matter, both NOx and N2O emission levels were minimal and,
out-side this range, both oxides showed a sharp increase in their formation/emissions. The coal blends were also found to show similar trends with increasing the bed temperatures.
The results serve to establish the relative importance of volatile and fixed carbon reactivity and coal and char petrography, which is believed to significantly contribute to devolatilization mecha-nisms and char reactivity.
Keywords: NOx; N2O; coal blends; fluidized bed combustion (FBC)
INTRODUCTION
It is inevitable that permitted levels of emissions concerning the release of the ox-ides of nitrogen from utility coal-fired boilers will become more stringent with
*Address all correspondence to Prof. M. J. Lemos de Sousa, mlsousa@fc.up.pt.
time. Simple modifications involving the combustion geometry or mode of firing do not result in reductions that could satisfy the pending legislation in the future. The most common method available to operators that has proved to be effective in this respect is reagent injection, but this also has disadvantages, such as re-stricted temperature operation, complications like NH3 slip, cost, and so on.
Al-though the implementation of primary and secondary measures, such as fuel blending and deep fuel staging (reburn), respectively, cannot individually meet the future levels for emissions. Nevertheless, their combined use could prove to be effective and could satisfy environmental requirements with the advantage of being more suitable with the boiler operation than the reagent injection.
Coal blending is a technique very much utilized in coal boilers using pulver-ized fuel (pf). The main purpose of its use is primarily to minimize the adverse effects of fouling and slagging observed in the boilers resulting from the behavior of coal ash. In addition, because fouling and slagging are particularly more seri-ous with coals containing high sulfur, the blending of coals in pf systems has the objective of reducing the extent of fouling and slagging with a simultaneous re-duction in SO2 release. Furthermore, the blending could also improve the ignition characteristics and coal reactivity.
In most cases, the blends of distinct rank coals with those of lower rank did not appear to result in significant improvement in combustion efficiency (Lee and Whaley, 1983; Vleeskens, 1983; Artos and Scaroni, 1993; Rubiera et al., 1999a). Nevertheless, Rubiera et al. (1999a) verified that the ignition of high volatile coals might enhance the burning of a higher rank coal.
The pf work undertaken by Rozendal et al. (in Maier et al., 1994) and Maier et al. (1994) and those of TGA (Thermogravimetric) and DTF (drop tube furnace) by Rubiera et al. (1999b) revealed that blending high volatile coals with low volatile coals could reduce NOx emissions, due to the release of higher
quan-tities of volatile species in the flame zone.
Nevertheless, the application of the use of coal blending in FBC systems is very recent and its objective is related more to the control of NOx emissions. As
the combustion temperature in FBC is lower than that of pf, the ash behavior is different and the capture of SO2 during the combustion in FBC somewhat alters the gas composition of the flue gases. Consequently, the fouling and slagging ob-served in FBC involve different mechanisms which could also be controlled with coal blending. Presently, most of the coal blending work is still at the R&D phase with very little industrial applications.
The present study aimed at determining the effects of coal blending on the emissions of NOx and N2O from fluidized bed combustion and correlating them
with petrographical characterization of the coal.
FUEL CHARACTERISTICS
Analyses of Coals
Proximate and ultimate analyses
The origin, rank, proximate and ultimate analyses, and also the fuel and N/C ra-tios of the individual coals are given in Table I.
Petrographic analyses
Each coal and sample was crushed below 1mm and embedded in resin in order to prepare a classical particulate block, subsequently polished and labeled. The method is in accordance with ISO Standard 7404-2.
The equipment used was a MPVC Leitz microscope with magnifications up to 500×, and the MPVGEOR computer program. With the objective of studying the coal composition three analyses were performed:
1. Vitrinite reflectance, in accordance with ISO 7404-5;
2. Maceral group composition, in accordance with ISO 7404-3.
TABLE I Coal characterization: rank, proximate and ultimate analyses
Samples Puertollano, C1 Sasol, C2 Carbocol, C3 C coal, C4 Ashland, C5
Rank1 HVbit. HVbit. HVbit. HVbit. HVbit. Origin Spain S.Africa Colombia S.Africa USA Proximate (db2, wt%; daf3, wt%)
Ash2 46.0 10.2 8.9 16.5 14.0
Volatile matter3 47.7 35.9 42.4 27.8 39.3
Fixed Carbon3 52.3 64.1 57.7 72.2 60.7
Ultimate (daf3, wt%)
Carbon 76.3 80.5 82.0 79.0 84.9
Hydrogen 5.0 5.0 5.8 4.4 5.1
Nitrogen 2.2 2.1 1.6 1.7 1.5
Sulphur 1.7 0.8 0.9 0.6 1.1
Oxygen4 14.8 11.7 9.7 14.2 7.4
Fuel ratio (FC/VM) 1.1 1.8 1.4 2.6 1.6
N/C5 2.8 2.6 1.9 2.1 1.8
1in accordance with ASTM D 388 and Damberger
et al. (1984).
2db-dry basis
3daf-dry ash free
4by difference
3. Microlithotypes, carbominerites, and minerite composition, in accordance with ISO 7404-4.
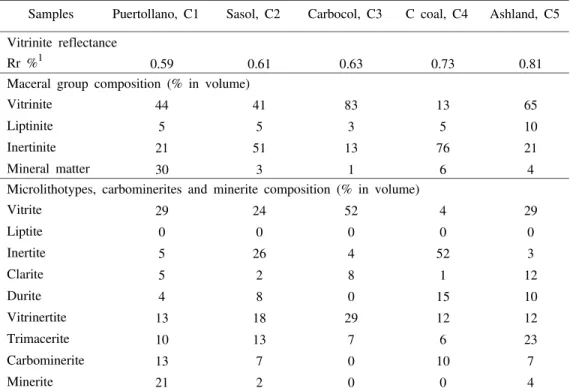
The results of the coal petrographic analyses are presented in Table II. Puertollano coal has a vitrinite mean random reflectance (Rr) of 0.59%, is vitrinite rich, with a significant amount of inertinite and mineral matter. Liptinite is not abundant but it is nevertheless frequent and dominated by megaspores (Table II).
Sasol coal has an Rr of 0.61%. Due to the large amounts of vitrinite (col-lotelinite) and inertinite (semifusinite) the microlithotypes vitrite and inertite are the most representative (Table II).
The Carbocol coal is very rich in vitrinite and has an Rr of 0.63%. Inertode-trinite is finely dispersed on viInertode-trinite and causes a large vitrinertite volume (Table II).
C coal has an Rr of 0.73%, however, the vitrinite reflectance measurements revealed a large dispersion of values (ranging between 0.55% and 1.00%, with a standard deviation of 0.10) which is an indicator of a blend. This coal is also in-ertinite rich.
178 D.BOAVIDA et al.
TABLE II Coal petrography: vitrinite mean random reflectance, maceral group composition, and microlithotypes, carbominerites and minerite composition
Samples Puertollano, C1 Sasol, C2 Carbocol, C3 C coal, C4 Ashland, C5
Vitrinite reflectance
Rr %1 0.59 0.61 0.63 0.73 0.81
Maceral group composition (% in volume)
Vitrinite 44 41 83 13 65
Liptinite 5 5 3 5 10
Inertinite 21 51 13 76 21
Mineral matter 30 3 1 6 4
Microlithotypes, carbominerites and minerite composition (% in volume)
Vitrite 29 24 52 4 29
Liptite 0 0 0 0 0
Inertite 5 26 4 52 3
Clarite 5 2 8 1 12
Durite 4 8 0 15 10
Vitrinertite 13 18 29 12 12
Trimacerite 10 13 7 6 23
Carbominerite 13 7 0 10 7
Minerite 21 2 0 0 4
Ashland coal has an Rr of 0.81%. Vitrinite is dominant which contributes to high volumes of vitrite. Trimacerite amounts to 23% due to the large volume of liptinite (10%) (Table II).
Petrographic Analyses of Chars
Chars were obtained from coal devolatilization in a fluidized bed reactor with 80 mm of internal diameter and 500 mm height. The inert carrier gas used in all tests was N2. During the volatile release, CO and CO2 amounts were measured with nondispersive infrared analyzers and, when the analyzers could no longer de-tect these gases, the heating was switched off while maintaining the N2 flow. Chars were produced at four temperatures (973 K, 1073 K, 1173 K, and 1273 K) and at a heating rate of ca. 104 K/s. Fluidized bed systems usually operate over a temperature range of 1073 to 1123 K and coal particles entering the bed, upon heating and depending on their residence times in the bed and their sizes, could attain temperatures varying from 973 to 1273 K which consequently influence the formation of chars (La Nauze, 1985).
1Tenuisphere
2Crassisphere
3Tenuinetwork
4Crassinetwork
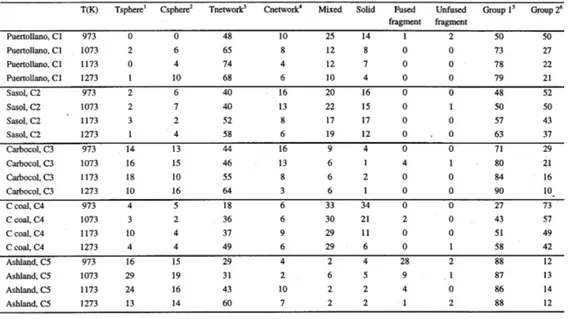
5high porous chars: tenuispheres+crassispheres+tenuinetworks+fused fragments
6mean to low porous chars: crassinetworks+mixed+solid+unfused fragments
The petrographic observations were performed in a Leitz microscope with a 25× oil objective, which permits the identification of the particles according to their shape and mosaic texture.
The procedure used for point-counting was as follows: at each location if the crosswire, landed on the carbonaceous material of a char particle, the particle was classified and counted. This procedure ensures that the particles counted represent the total volume of the char material (Álvarez et al., 1997).
The detailed char classification was adopted from Álvarez et al. (1997) and the reclassification in Group I and Group II was made in accordance with Bailey (1994) and Diessel (1998) as follows: Group I chars are characterized by high macroporosity (i.e., visible under the microscope), generally in excess of 50%; and Group II chars consist of medium to low porosity chars.
The main results of the char petrography are presented in Table III.
COMBUSTION TESTS EXPERIMENTS
Experiment Procedures
Five single coals (Tables I and II) were burned in a fluidized bed reactor. Later, based on the petrological characterization of coals by the University of Porto and the combustion tests results obtained from INETI, fifteen coal blends given below were prepared, in accordance with ISO Standard 1988, at INETI:
Combustion tests of coals and blends were carried out in an electrically heated fluidized bed with 80 mm internal diameter and 500 mm height (Figure 1). The inert bed material was constituted of silica sand with a particle average size of 370 µm.
The operating conditions were:
• Bed weight (g): 400
• Fluidization air pressure (Pa): 1.013⋅105
• Fluidization airflow rate (dm3/min): 14
• Coal feed rate (g/min): 1.2
• Coal particle sizes (µm): 500-1000
The combustion temperature was varied in the range of 1053 to 1323 K, and controlled automatically by a Eurotherm controller. The bed temperature was con-tinuously monitored with a thermocouple type K.
The combustion gases, after being filtered and dried, were continuously ana-lyzed at the exit of the combustor, with specific analyzers, which were previously calibrated. Paramagnetic method was employed for O2 measurements and the non-dispersive infrared technique was used for measuring the amounts of CO, CO2
and N2O. The NOx and SO2 measurements were carried out with a
chemilumi-nescense and pulsed fluorescent analyzer, respectively.
Results and Discussion
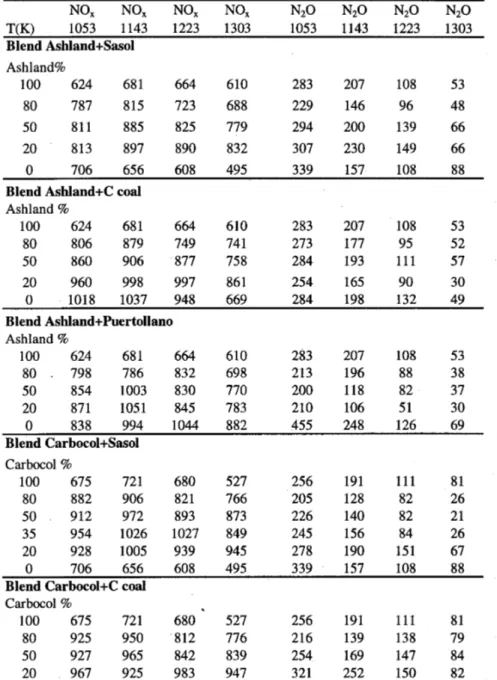
The results of the emissions of NOx and N2O from the combustion trials of sin-gle coals and blends are presented in Table IV.
Combustion of the single coals
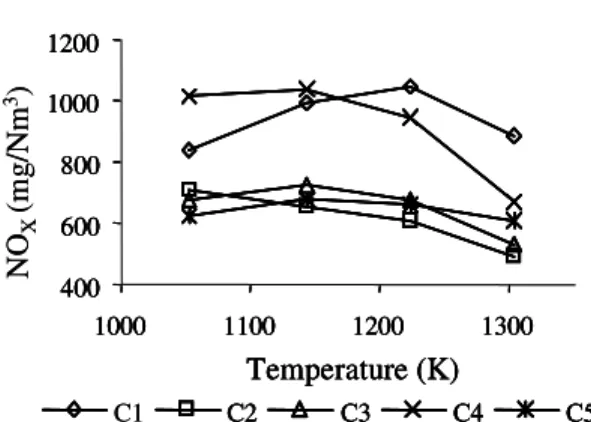
The NOx and N2O emissions obtained from the combustion of the five single coals are given in Figures 2 and 3.
The NOx emissions were found to increase from 1053 K to 1173 K, with
the exception of Sasol coal (C2). Relatively high emissions of NOx at lower
tem-5 4
3
2 7
6
1
peratures (1053 to 1143 K) were observed with C Coal (C4) and Puertollano coal (C1) that produced the highest NOx emissions at 1223 K. At 1223 to 1303 K,
NOx emission decreased in all coals. The high reactivity of C Coal (C4) for NOx
formation could be attributed to the presence of high inertinite amounts compared with other coals, and considering that it has a fuel-N content about the same as Carbocol (C3) and Ashland (C5) coals which produced one third less NOx but are poor in inertinite. It is more difficult to correlate the behavior of Sasol coal (C2)
182 D. BOAVIDA et al.
with its petrological composition. It is a coal with high fuel-N content and with about the same amounts of vitrinite and inertinite.
The increase in NOx with temperature is already well established (Jonhsson,
1993; Hayhurst and Lawrence, 1996) and could be due to both higher reaction rates of oxidation of fuel-N to NOx and thermal destruction of N2O, either di-rectly or indidi-rectly by favoring the reactions leading to the formation of NOx. Nevertheless, the reduction in NOx at higher temperatures could result from the destruction of NOx by char becoming very significant, as previous studies showed
that the NOx-char reaction had relatively high activation energy and the reaction
seemed to be favored at temperatures above 1173 K (Abelha et al., 1999). Con-sidering the fact that vitrinite rich coals produced highly porous chars (Table III), the reduction of NOx in the interior of particles could become significant, thus giving rise to a decrease in NOx. In fact, with Ashland and Carbocol, both rich
400 600 800 1000 1200
1000 1100 1200 1300 Temperature (K)
C1 C2 C3 C4 C5
400 600 800 1000 1200
1000 1100 1200 1300 Temperature (K)
NO
X
(m
g/
N
m
3)
C2 C3 C4 C5
400 600 800 1000 1200
1000 1100 1200 1300 Temperature (K)
C1 C2 C3 C4 C5
400 600 800 1000 1200
1000 1100 1200 1300 Temperature (K)
NO
X
(m
g/
N
m
3)
C2 C3 C4 C5
FIGURE 2 NOx emissions versus temperature, for the five single coals.
0 100 200 300 400 500
1000 1100 1200 1300
Temperature (K)
C1 C2 C3 C4 C5
0 100 200 300 400 500
1000 1100 1200 1300
C1 N2
O(
m
g/
N
m
3 )
0 100 200 300 400 500
1000 1100 1200 1300
Temperature (K)
C1 C2 C3 C4 C5
0 100 200 300 400 500
1000 1100 1200 1300
C1 N2
O(
m
g/
N
m
3 )
in vitrinite, the reduction started at about 1143 K. At these high temperatures, the gas phase reaction of NOx with CO catalyzed by the relatively porous char is found to become important, thus leading to the reduction in NOx emissions.
It was observed that there was a dependency between the amounts of NOx and N2O released and the fuel ratio (Fixed Carbon/Volatile Matter) and fuel N/C ratio. At 1053 K, as can be seen in Figures 4 and 5, at low fuel ratios, most of fuel-N appeared to be released with volatiles and then was oxidized to form NOx.
This could be the reason why there was a high amount of NOx formed. This was
184 D. BOAVIDA et al.
)XHO UDWLR )&90
12 ;& RUU 2 PJ 1P 1 2 & RUU 2 PJ 1P
12[ &RUU PJ1P 12 &RUU PJ1P
)XHO UDWLR )&90
12 ; & RUU 2 PJ 1P 1 2 & RUU 2 PJ 1P
12[ &RUU PJ1P 12 &RUU PJ1P
)XHO UDWLR )&90
12 ;& RUU 2 PJ 1P 1 2 & RUU 2 PJ 1P
12[ &RUU PJ1P 12 &RUU PJ1P
)XHO UDWLR )&90
12;&RUU PJ1P 12 &RUU PJ1P
NO X Co rr . -6% O 2 (m g /Nm
3) 2NO
C o rr . -6 % O 2 (m g /Nm 3 )
)XHO UDWLR )&90
12 ;& RUU 2 PJ 1P 1 2 & RUU 2 PJ 1P
12[ &RUU PJ1P 12 &RUU PJ1P
)XHO UDWLR )&90
12 ; & RUU 2 PJ 1P 1 2 & RUU 2 PJ 1P
12[ &RUU PJ1P 12 &RUU PJ1P
)XHO UDWLR )&90
12 ;& RUU 2 PJ 1P 1 2 & RUU 2 PJ 1P
12[ &RUU PJ1P 12 &RUU PJ1P
)XHO UDWLR )&90
12;&RUU PJ1P 12 &RUU PJ1P
NO X Co rr . -6% O 2 (m g /Nm
3) 2NO
C o rr . -6 % O 2 (m g /Nm 3 )
FIGURE 4 NOx and N2O emissions versus fuel ratio (fixed carbon/volatile matter) for T = 1053 K, for the five single coals.
1& 12 ; &RUU 2 PJ1P 1 2 &RUU 2 PJ1P
12[ &RUU PJ1P 12 &RUU PJ1P
1&
12;&RUU PJ1P 1
2 &RUU PJ1P
NO X Co rr . -6 % O 2 (m g/ N m
3) 2NO C
or r. -6% O 2 (m g/ N m 3 ) 1& 12 ; &RUU 2 PJ1P 1 2 &RUU 2 PJ1P
12[ &RUU PJ1P 12 &RUU PJ1P
1&
12;&RUU PJ1P 1
2 &RUU PJ1P
NO X Co rr . -6 % O 2 (m g/ N m
3) 2NO C
or r. -6% O 2 (m g/ N m 3 )
FIGURE 5 NOx and N2O emissions versus nitrogen/carbon ratio (N/C) for T = 1053 K, for the
probably controlled by temperature only. As the fixed carbon content of the fuel increased, the NOx formation appeared to be more controlled by char oxidation and the heterogeneous reactions started to play an important role, and a transition could take place in which the presence of volatile still evolving might have caused an atmosphere not so rich in oxygen close to the char oxidation which could first lead to a decrease in NOx formed (Thomas, 1997). As the fixed carbon
content increased, more fuel-N remained in the char, and less volatiles were pre-sent, the oxidation of char became dominant and produced higher quantities of NOx and this resulted in an increase in the NOx formation. It was observed that for fuel ratio of 1.55 the lowest amount of NOx formed. A similar behavior was observed for N2O and it appeared that the volatile-N could contribute, very sig-nificantly, to the formation of N2O as Figure 4 illustrates. At fuel ratios above
1.75, the N2O started to decrease which suggests that the char reduction of N2O
became important.
For N2O emissions at 1053 K, the N/C ratio was found to correlate well with the amounts formed as shown in Figure 5. At this temperature, the N2O emissions were the highest as expected (Davidson, 2000) and the increased fuel-N content, leading to a rise in N/C ratio, strongly favored the formation of N2O. This may be due to the fact that at higher N/C ratios, more nitrogen was released as volatile-N and was then oxidized in the gas phase to N2O (Pels et al., 1993; Hämäläinen and Aho, 1995). The NOx amount was first found to increase with
N/C ratio up to 2.1, then to start decreasing until N/C = 2.7 and finally beyond this value to increase again. This could be due to the fact the volatile-N oxidation might first favor more the formation of N2O at the expense of NOx. Only at very
1&
12[ &RUU PJ1P 12 &RUU PJ1P
12[ &RUU PJ1P 12 &RUU PJ1P
12[ &RUU PJ1P 12 &RUU PJ1P
12[ &RUU PJ1P 12 &RUU PJ1P
12[ &RUU PJ1P 12 &RUU PJ1P
12[ &RUU PJ1P 12 &RUU PJ1P
12[ &RUU PJ1P 12 &RUU PJ1P
12;&RUU PJ1P 12 &RUU PJ1P
NO X Co rr . -6% O 2 (m g /N m
3) 2N
O Co rr . -6% O 2 (m g /N m 3 ) 1&
12[ &RUU PJ1P 12 &RUU PJ1P
12[ &RUU PJ1P 12 &RUU PJ1P
12[ &RUU PJ1P 12 &RUU PJ1P
12[ &RUU PJ1P 12 &RUU PJ1P
12[ &RUU PJ1P 12 &RUU PJ1P
12[ &RUU PJ1P 12 &RUU PJ1P
12[ &RUU PJ1P 12 &RUU PJ1P
12;&RUU PJ1P 12 &RUU PJ1P
NO X Co rr . -6% O 2 (m g /N m
3) 2N
O Co rr . -6% O 2 (m g /N m 3 )
FIGURE 6 NOx and N2O emissions versus nitrogen/carbon ratio (N/C) for T = 1223 K, for the
high N/C ratios, the oxidation of volatile-N could result in the formation of fur-ther NOx.
At temperatures above 1053 K, a similar pattern of dependency for both NOx and N2O on the ratios of both fuel and N/C was observed which suggests that the oxidation of fuel-N released in volatiles may dominate the formation and destruction of both oxides of nitrogen, and the precursor responsible for the reac-tion could be HCN. Nevertheless, some reducreac-tion by char most likely occurred (Jonhsson, 1993; Rodriguez-Mirasol et al., 1994; Thomas, 1997). As shown in Figure 6, at 1223 K the N2O curve had the same shape as that of NOx, possibly
because of competing reactions between the destruction of N2O and those leading to its formation. The influence of inertinite present in C Coal (Table 1) is very clear, as both NOx and N2O values were high at relatively lower N/C ratio. At very high N/C ratios (above 2.7), the N2O formed increased which could be due to the fact that the fuel-N concentration was high enough to enhance the forma-tion of N2O to overcome those factors responsible for its disappearance (Thomas,
1997; Winter et al., 1996).
Combustion of the blends
All the blends showed similar pattern for the release of NOx as shown in Figures 7 to 10, and presented the same trend as the parent coals. The amounts of NOx
formed increased with temperature up to about 1173 K and then started to de-crease.
In the case of blends that were made of Ashland + C Coal, and Carbocol + C Coal (Figures 7 and 8), involving one coal rich in inertinite (C Coal) and two others rich in vitrinite (Ashland and Carbocol), at temperatures above 1203 K the blends produced NOx emissions even higher than those obtained individually for
186 D. BOAVIDA et al.
Ashland + C coal
500 700 900 1100
0 20 40 60 80 100 120
Ashland %
1053 K 1143 K 1223 K 1303 K
NO
X
(m
g/
Nm
3)
Ashland + C coal
500 700 900 1100
0 20 40 60 80 100 120
Ashland %
1053 K 1143 K 1223 K 1303 K
NO
X
(m
g/
Nm
3)
Ashland + C coal
500 700 900 1100
0 20 40 60 80 100 120
Ashland %
1053 K 1143 K 1223 K 1303 K
NO
X
(m
g/
Nm
3)
the two parent coals. Additionally, NOx and N2O emissions increased with the percentage of C Coal in the blend.
The blends, which involved Ashland + Sasol, and Carbocol + Sasol (Figures 9 and 10), were found to produce, for all temperatures, greater NOx amounts than
those obtained during the combustion of each parent coal individually. At higher temperatures, the production of N2O was also greater when blends were burned. The Sasol coal has about equal amounts of both inertinite and vitrinite, which means that chars produced from this coal are fairly porous. Considering that this coal was found to produce large quantities of N2O when burned alone, this sug-gests that most of nitrogen groups released were CN groups, as ammonia does not give rise to N2O (Jonhsson, 1993: Aho et al., 1993; Goel et al., 2002). Dur-ing the combustion of blends, it appears that the CN pool was very much en-riched originating from both parent coals, thus producing larger NOx in all
Carbocol + C coal
500 700 900 1100
0 20 40 60 80 100 120
Carbocol %
1053 K 1143 K 1223 K 1303 K
NO
X
(m
g/
Nm
3 )
Carbocol + C coal
500 700 900 1100
0 20 40 60 80 100 120
Carbocol %
1053 K 1143 K 1223 K 1303 K
NO
X
(m
g/
Nm
3 )
FIGURE 8 NOx emissions versus Carbocol % for blend Carbocol + C coal.
Ashland + Sasol
400 600 800 1000
0 20 40 60 80 100 120
Ashland %
1053 K 1143 K 1223 K 1303 K
NO
X
(m
g/
N
m
3 )
Ashland + Sasol
400 600 800 1000
0 20 40 60 80 100 120
Ashland %
1053 K 1143 K 1223 K 1303 K
NO
X
(m
g/
N
m
3 )
temperatures, and N2O even up to 1223 K. This could be expected because all the coals have high volatile content and tend to produce porous chars that could facilitate the release of volatiles. This rich CN pool could be assumed to result in NOx in such manner that the char reduction was not sufficient to bring down the levels of NOx formed.
The blend Ashland + Puertollano showed a similar behavior to that of Ash-land coal burned alone as NOx emissions first increased up to 1143 K and then
started to decrease, as shown in Figure 11. Nevertheless, the levels of NOx in the
temperature range 1053 to 1143 K were higher for blends than for parent coals. Above 1143 K, the amount of NOx formed remained between the values obtained during the individual combustion of each coal. The Puertollano coal was found to give rise to very high N2O levels when burned alone, producing highest N2O
188 D. BOAVIDA et al.
Carbocol + Sasol
450 650 850 1050
0 20 40 60 80 100 120
Carbocol%
1053 K 1143 K 1223 K 1303 K
NO
X
(m
g/
Nm
3 )
Carbocol + Sasol
450 650 850 1050
0 20 40 60 80 100 120
Carbocol%
1053 K 1143 K 1223 K 1303 K
NO
X
(m
g/
Nm
3 )
FIGURE 10 NOx emissions versus Carbocol % for blend Ashland + Sasol.
NO
X
(mg/
Nm
3 )
Ashland+ Puertollano
500 700 900 1100
0 20 40 60 80 100 120
Puertollano %
1053 K 1143 K 1223 K 1303 K
NO
X
(mg/
Nm
3 )
Ashland+ Puertollano
500 700 900 1100
0 20 40 60 80 100 120
Puertollano %
1053 K 1143 K 1223 K 1303 K
emissions at 1143 K. The rapid decrease of N2O with temperature is consistent with other works (Jonhsson, 1993; Davidson, 2000). Nevertheless, the blend Ash-land + Puertollano resulted in N2O levels, for all temperatures and mixtures, be-tween those of parent coals. This could suggest that the CN groups were somewhat diluted by volatiles released from Ashland coal and the gas phase reac-tions involving CN groups, particularly at high temperatures, gave rise to the for-mation of ammonia groups which were subsequently oxidized to NOx.
Furthermore, at temperatures above 1143 K, the char reduction of both NOx and
N2O may become significant, thus keeping the levels between individual values of each coal in the blend.
CONCLUSIONS
Combustion results of blends showed that the emission levels of NOx observed
were, on the whole, higher than expected, based on the linear correlation from the proportional amounts of parent coals in the mixture of the blend.
The blending did not cause reduction in NOx values over the temperature
range usually used in fluidized beds, that is 1073 to 1123 K. In fact, in most cases, NOx increased, possibly due to the enrichment of precursors responsible for NOx formation, originating from both coals making up the blend and the char oxidation.
In all series of blends studied for N2O emissions the temperature effect was
dominant, namely in the reduction of the N2O emissions. It was also clear that N2O was very much influenced by the nature of nitrogenous groups, as Sasol and Puertollano coals gave rise to very high N2O levels at 1053 K, almost reaching 50% of NOx formed. Blending, however, did not result in great reductions in N2O levels over the usual temperature range of operation in fluidized beds, i.e., 1073 to 1123 K.
Both the nature of nitrogenous groups released with volatiles and char reac-tivity contribute to both formation and destruction of NOx and N2O. It is believed
that the char reactivity increased with temperature, which could be the main route for the reduction of NOx at high temperatures. The char reactivity is dependent on the petrological composition of coal and vitrinite coals provide more porous chars, which could also facilitate the release of volatiles during combustion.
Acknowledgments
References
Abelha, P., Boavida, D., Gulyurtlu, I., and Cabrita, I. (1999). The emissions of SO2, NOx and N2O
during the combustion of coal blends in a fluidized bed reactor, Proc. of the 15th Intl. Conf.
Fluidized Bed Combustion, paper FBC99-00183, ASME, Savannah, Georgia.
Aho, M.J., Ha..ma..la..inen, J.P., and Tummavuori, J.L. (1993). Conversion of peat and coal nitrogen through HCN and NH3 to nitrogen oxides at 800oC. Fuel, vol. 72, pp. 837–841.
Álvarez, D., Borrego, A.G., and Menéndez, R. (1997). Unbiased methods for the morphological de-scription of char structures. Fuel, vol. 76, pp. 1241–1248.
Artos, V. and Scaroni, W. (1993). T.g.a. and drop-tube reactor studies of the combustion of coal blends. Fuel, vol. 72, pp. 927–933.
Bailey, J. (1994). Predicting unburnt coal and tracing coal components in thermal blends. White paper of the Working Group on Environmental Applications of Coal Petrography, 46th
An-nual Meeting of the Intl. Committee for Coal and Organic Petrology (ICCP), Oviedo, pp. 17–
18.
Damberger, H.H., Harvey, R.D., Ruch, R.R., and Thomas Jr., J. (1984). Coal characterization. In
The Science and Technology of Coal and Coal Utilization, eds. B. R. Cooper and W. A.
Ellingson. New York, London: Plenum Press, chap. 2.
Davidson, R.M. (2000). How coal properties influence emissions. IEA Coal Res., CCC/28. Diessel, C.F.K. (1998). Technological Applications. In G.H. Taylor, M. Teichmüller, A. Davis,
C.F.K. Diessel, R. Littke, and P. Robert, Organic Petrology, Berlin, Stuttgart:
Gebru..der Borntraeger, chap. 9.
Goel, S., Molina, A., and Sarofim, A. F. (2002). Factors Influencing the Time-Resolved Evolution of NO, HCN, and N2O during Char Oxidation at Fluidized Bed Conditions. Energy & Fuels,
vol. 16, pp. 823–830.
Ha..ma..la..inen, J. and Aho, M. (1995). Effect of fuel composition on the conversion of volatile solid fuel-N to N2O and NO. Fuel, vol. 74, 12, pp. 1922–1924.
Hayhurst, A. and Lawrence, A. (1996). The amounts of NOx and N2O formed in a fluidized bed
combustor during the burning of coal volatiles and also of char. Combustion and Flame, vol.
105, pp. 341–357.
Jonhsson, J.E. (1993). Formation and reduction of nitrogen oxides in fluidized-bed combustion.
Fuel, vol. 73, 9, pp. 1398–1415.
La Nauze, R. (1985). Fundamentals of coal combustion in fluidized beds. Chem. Eng. Res. Des., vol. 63, pp. 3–31.
Lee, G.K. and Whaley, H. (1983). Modification of combustion and fly-ash characteristics by coal blending. Journal of the Institute of Energy, pp. 190–197.
Maier, H., Spliethoff, H., Kicherer, A., Fingerle, A., and Hein, K.R.G. (1994). Effect of coal blend-ing and particle size on NOx emission and burnout. Fuel, vol. 73, 9, pp. 1447–1452.
Pels, J., Wojtowich, M., and Moulijn, J. (1993). Rank dependence of N2O emission in fluidized bed
combustion of coal. Fuel, vol.72, pp. 373–379.
Rodriguez-Mirasol, J., Ooms, A., Pels, J., Kapteijn, F., and Moulijn, J. (1994). NO and N2O
decom-position over char at fluidized bed combustion conditions. Combustion and Flame, vol. 99,
pp. 499–507.
Rubiera, F., Esteban, R., Arenillas, A., and Pis, J.J. (1999a). Effect of blending different rank coals on NOx emissions. In Prospects for Coal Science in the 21st Century, vol. 1, eds. B.Q. Li and Z.Y. Liu. China: Shanxi & Technology Press, pp. 1501–1504.
Rubiera, F., Fuente, E., Arenillas, A., and Pis, J.J. (1999b). A study on the combustion behavior of coal blends. In Prospects for Coal Science in the 21st Century, vol. 1, eds. B.Q. Li and Z.Y.
Liu. China: Shanxi & Technology Press, pp. 531–534.
Thomas, K.M. (1997). The release of nitrogen oxides during char combustion. Fuel, vol. 76, 6, pp.
457–473.
Vleeskens, J.M. (1983). Effect of Coal Properties on the Fluidized Bed Combustion Efficiency of Single Coals and Blends. Netherlands Energy Research Foundation, Publ. ref. ECN–133. Winter, F., Wartha, C., Loffler, G., and Hofbauer, H. (1996). The NO and N2O formation
mecha-nism during devolatilization and char combustion fluidized bed conditions. Proc. of the 26th