www.nat-hazards-earth-syst-sci.net/10/239/2010/ © Author(s) 2010. This work is distributed under the Creative Commons Attribution 3.0 License.
and Earth
System Sciences
Using RST approach and EOS-MODIS radiances for monitoring
seismically active regions: a study on the 6 April 2009 Abruzzo
earthquake
N. Pergola2,1, C. Aliano1, I. Coviello2, C. Filizzola2, N. Genzano1, T. Lacava2, M. Lisi1, G. Mazzeo1, and V. Tramutoli1,2
1University of Basilicata, Department of Engineering and Physics of the Environment, Potenza, Italy
2National Research Council, Institute of Methodologies for Environmental Analysis (IMAA), Tito Scalo (PZ), Italy Received: 31 October 2009 – Accepted: 14 January 2010 – Published: 11 February 2010
Abstract.In the last few years, Robust Satellite data analysis Techniques (RST) have been proposed and successfully ap-plied for monitoring major natural and environmental risks. Among the various fields of application, RST analysis has been used as a suitable tool for satellite TIR surveys in seis-mically active regions, devoted to detect and monitor thermal anomalies possibly related to earthquake occurrence. In this work, RST has been applied, for the first time, to thermal in-frared observations collected by MODIS (Moderate Resolu-tion Imaging Spectroradiometer) – the sensor onboard EOS (Earth Observing System) satellites - in the case of Abruzzo (Italy) earthquake occurred on 6 April 2009 (ML∼5.8). First achievements, shown in this work, seem to confirm the sen-sitivity of the proposed approach in detecting perturbations of the Earths emission thermal field few days before the event. The reliability of such results, based on the analysis of 10 years of MODIS observations, seems to be supported by the results achieved analyzing the same area in similar obser-vation conditions but in seismically unperturbed periods (no earthquakes withML≥5) that will be also presented.
1 Introduction
Since the eighties, a growing number of studies (see for ex-ample Gorny et al., 1988; Qiang and Dian, 1992; Tronin, 1996; Qiang et al., 1997; Tronin et al., 2002; Ouzounov and Freund, 2004) have reported the appearance of space-time anomalies in TIR (Thermal Infra-Red) satellite imagery be-fore (from weeks to days) severe earthquakes.
In order to explain the appearance of anomalously high TIR records near the place and the time of earthquake
oc-Correspondence to:N. Pergola (pergola@imaa.cnr.it)
currence, different authors attributed their appearance to the increase of green-house gas (such as CO2, CH4, etc.) emis-sion rates, to the modification of ground water regime (see Hamza, 2001) and/or to the increase of convective heat flux (Qiang et al., 1991; Tronin, 2000). Other, more complex models have been proposed, that include the increase of near surface temperature, among the other expected pre-seismic phenomena (e.g. Pulinets et al. 2002, 2006, 2007; Ouzounov and Freund, 2004).
However, such a claimed correlation has been considered, up to now, with some cautions by scientific community. The main problems of the mentioned studies were the lack of a rigorous definition of anomalous TIR signal fluctuations, the absence of a convincing testing step based on a valida-tion/confutation approach and the scarce attention paid to the possibility that other causes (e.g. meteorological) different from seismic activity could be responsible for the observed TIR variations.
Starting from these considerations, a different approach called Robust Satellite Techniques (RST; Tramutoli 2005, 2007) - initially named RAT (Robust AVHRR Techniques, Tramutoli, 1998) – was proposed to investigate possible rela-tions between earthquake occurrence and space-time fluctu-ations of Earth’s emitted TIR radiation observed from satel-lite.
240 N. Pergola et al.: Assessing of monitoring TIR anomalies of the Abruzzo earthquake The RST approach has been already tested for the analysis
of several earthquakes (Aliano et al., 2007, 2008a, b, c; Cor-rado et al., 2005; Di Bello et al., 2004; Filizzola at al., 2004; Genzano et al., 2007, 2009; Tramutoli et al., 2001b, 2005) occurred in different continents (Europe, Asia, America and Africa), in various geo-tectonic settings (compressive, exten-sional and transcurrent) and with a wide range of magnitudes (from 4.0 to 7.9).
In this paper, for the first time RST approach is applied to data acquired by MODIS, the optical sensor aboard po-lar EOS satellites (Terra and Aqua), over Italy. 10 years of MODIS data have been processed and RST products ana-lyzed, in particular, in correspondence of the Abruzzo earth-quake (6 April 2009,ML∼5.8). Results obtained by RST at the time of this earthquake will be compared with those ob-tained by an identical analysis (confutation) performed for the same area in a different, quite sesimically unperturbed (i.e. characterized by the absence of earthquakes of similar magnitude over the same area) year, in order to verify the presence/absence of anomalous space-time TIR transients in presence/absence of significant earthquakes in similar obser-vation conditions.
2 A robust estimator of thermal anomalies
The RST approach is a general methodology of satellite data analysis already successfully applied to monitor major natu-ral and environmental hazards, such as: volcanoes (Pergola et al., 2001, 2004a, b; Tramutoli et al., 2001c; Di Bello et al., 2004; Bonfiglio et al., 2005; Marchese et al. 2006; Filiz-zola et al., 2007); floods (Tramutoli et al., 2001a; Lacava et al., 2005, 2006); forest fires (Cuomo et al., 2001; Mazzeo et al., 2007), etc. RST was applied to seismically active areas monitoring, firstly in the case of the disastrous 1980 Irpinia-Basilicata earthquake (Di Bello et al., 2004; Tramu-toli et al., 2001b), then was successfully tested in several cases: Athens, 7 September 1999 (Filizzola et al., 2004); Izmit, 17 August 1999 (Tramutoli et al., 2005); Gujarat, 26 January 2001 (Genzano et al., 2007), Boumerdes/Thenia, 21 May 2003 (Aliano et al., 2007); Hector Mine, 16 October 1999 (Aliano et al., 2008a), Umbria-Marche, October 1997 (Aliano et al., 2008b), Mestia Tianeti, 23 October 1992 (Gen-zano et al., 2009) and various events occurred in Greece and Turkey, May and June 1995–1996 (Corrado et al., 2005).
RST is based on a preliminary multi-temporal analysis of several years (from 4 to 10 depending on the availability of historical data-sets) of homogeneous satellite TIR records, co-located in the space-time domain, devoted to character-ize the TIR signal (in terms of its expected value and natural variability range) for each pixel of the satellite image to be processed. On this basis, anomalous TIR patterns are iden-tified as a deviation from those “normal” conditions, using a specific index, RETIRA (Robust Estimator of TIR
Anoma-lies, Filizzola et al., 2004; Tramutoli, 2005), to be computed on the image at hand as in Eq. (1):
⊗1T(r,t )=
1T (r,t )−µ1T(r)
σ1T(r) (1) where:
r≡(x,y)represents location coordinates of the pixel cen-tre on a satellite image;
t is the time of image acquisition with t∈τ, whereτ de-fines the homogeneous domain of satellite imagery collected in the same time-slot of the day and period (month) of the year;
1T ≡(r,t ) is the value of the difference between the punctual value of brightness temperature T (r,t )at the lo-cationr≡(x,y)and at the acquisition timet and its spatial averageT (t )(i.e.1T =T (r,t )−T (t ))computed on the in-vestigated area considering only cloud-free locations, all be-longing to the same, land or sea, class (i.e. considering only sea pixels ifr is located on the sea and only land pixels if it is located on the land). Note that the choice of such a differential variable1T (r,t )instead ofT (r,t )is expected to reduce possible contributions (e.g. occasional warming) due to day-to-day and/or year-to-year climatological changes and/or season time-drifts;
µ1T(r)time average value of1T (r,t )at the locationr≡
(x,y)computed on cloud free records belonging the selected data set (t∈τ);
σ1T(r)standard deviation of1T (r,t )at the locationr≡
(x,y)computed on cloud free records belonging the selected data set (t∈τ).
By this way⊗1T(r,t )gives the local excess of the current
1T (r,t )signal compared with its historical mean value and weighted by its historical variability at the considered loca-tion. Both,µ1T(r)andσ1T(r), are computed, once and for all, for each locationr, processing several years of histori-cal satellite records acquired in similar observational condi-tions. They are two reference images describing the normal behaviour of the signal and of its variability at each loca-tionrin observational conditions as similar as possible to the ones of the image at hand. The difference1T (r,t )−µ1T(r) then represents the Signal (S) to be investigated for its pos-sible relation with seismic activity. It is always evaluated by comparison with the corresponding natural/observational Noise (N), represented byσ1T(r)which describes the over-all (local) variability of S including over-all (natural and obser-vational, known and unknown) sources of its variability, as historically observed at the same site in similar observational conditions (sensor, time of day, month, etc.). This way, the relative importance of the measured TIR signal (or the inten-sity of anomalous TIR transients) can naturally be evaluated in terms ofS/Nratio by the RETIRA index.
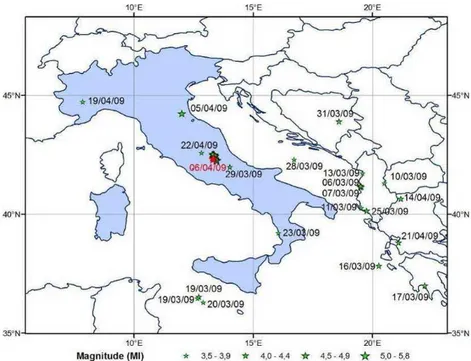
Fig. 1.Seismic events withML>3.5 occurred in March and April 2009. Red star indicates the main shock of Abruzzo earthquakes
(INGV, 2009).
its implementation on different satellite sensors to monitor seismic areas can be found in Tramutoli et al. (2005), Aliano et al. (2008a) and in others above mentioned papers.
As said before, in this work we apply the RST to the thermal data acquired by MODIS, the multispectral (36 bands in the optical range of the electromagnetic spec-trum) radiometer aboard EOS-Terra since November 1999 and EOS-Aqua since June 2002. More in detail: we have used the data acquired by MODIS TIR channel 31 (10.780– 11.280 µm) at 1 km of spatial resolution, so that theT in Eq. (1) is the brightness temperature measured by MODIS at these wavelength. A full data-set of 10 years of MODIS observations collected in between 24:00 and 02:00 GMT has been processed, combining records acquired by both (EOS-AQUA and EOS TERRA) satellites orbiting with a delay of about three hours each other.
3 The Abruzzo earthquake
The Abruzzo earthquake (ML∼5.8) occurred on 6 April 2009 at 01:32:39 GMT, having its epicentre at 42.334N and 13.334E (INGV, 2009) in central Italy. The mainshock oc-curred as a result of normal faulting on a NW-SE oriented structure in the central Apennines. Since January 2009 the zone has been object of frequent seismic events (Fig. 1) with characteristics of seismic swarm with hundreds of modest en-tity shake. The seismicity was confined in the upper crust and interested an area about 30 km long and strikes in the NW-SE direction, parallel to the Apennine mountain axis and to the main fault structures known in the area.
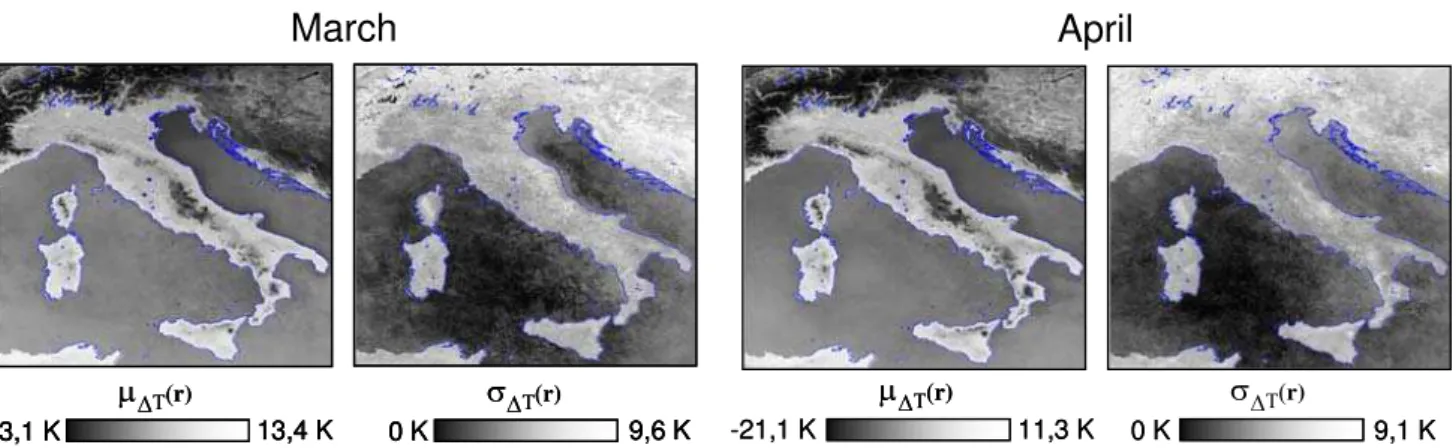
In order to apply the RST processing scheme, ten years of TIR MODIS imagery, all acquired from 2000 to 2009 at around midnight GMT (from 24:00 to 02:00 GMT) during the months of March and April, were used for computing
µ1T(r)andσ1T(r)reference fields shown in Fig. 2. On this basis, RETIRA index has been computed for a set of EOS-MODIS imagery in order to perform the val-idation/confutation analyses. For validation purposes, the months of March and April 2009 have been considered, while, in the confutation analysis, the months of March and April 2008 were selected, being 2008 a seismically “unper-turbed” (i.e. no earthquakes withM≥5, in the same region and in the same months but in a different year) one in the whole used data set.
4 Validation analysis
242 N. Pergola et al.: Assessing of monitoring TIR anomalies of the Abruzzo earthquake
-23,1 K 13,4 K
μΔT(r)
0 K 9,6 K
σΔT(r)
-23,1 K 13,4 K -23,1 K 13,4 K
μΔT(r)
0 K 9,6 K
0 K 9,6 K
σΔT(r)
μ
μ
ΔΔσ
Δ( )
Δ
μ
σ
Δ( )
( )
Δ
⊗
( )
≥
⊗
Δ( )
−
Δ( )
Δ
μ
σ
Δ( )
March
μΔ σΔ
μΔ σΔ
-21,1 K 11,3 K
μ
ΔT(r)-21,1 K 11,3 K
μ
ΔT(r)0 K 9,1 K
0 K 9,1 K
σ
ΔT(r)( )
Δ
μ
σ
Δ( )
( )
Δ
⊗
( )
≥
⊗
Δ( )
−
Δ( )
Δ
μ
σ
Δ( )
April
Fig. 2.Reference fields (time averageµ1T(r)and standard deviationσ1T(r))for the investigated area computed for March and April from
MODIS data acquired in the period 2000–2009 at night-time (24:00–02:00 GMT).
μ
Δσ
Δμ
Δσ
Δμ
μ
ΔΔσ
Δ( )
Δ
μ
σ
Δ( )
( )
Δ
⊗
( )
≥
⊗
Δ( )
−
Δ( )
Δ
μ
σ
Δ( )
29 March 2009 00:25:00 GTM
Fig. 3.Left side: calculation of cloudy coverage over all the MODIS scenes processed for the 2009: grey bars represent the percentage of cloudy pixels over the total number of pixels in the image; red bars represent the percentage of TIR anomalies over the remaining cloud free pixels in the image. Right side: example, on 29 March 2009 scene, of artefacts (spurious TIR anomalies) due to the poorness of cloud-free pixels where RETIRA index can be computed and to the clouds masking quite all the warmest part of the scene (cold spatial average effect, see text).
for sake of simplicity, we will refer to them simply as “TIR anomalies”). As clouds completely mask Earth’s emitted ra-diation in the TIR spectral region, in our analysis clouds af-fected pixels, identified by using OCA (One-channel Cloudy-radiance-detection Approach, Cuomo et al., 2004), have been excluded, as missing data, from whatever further processing and analysis.
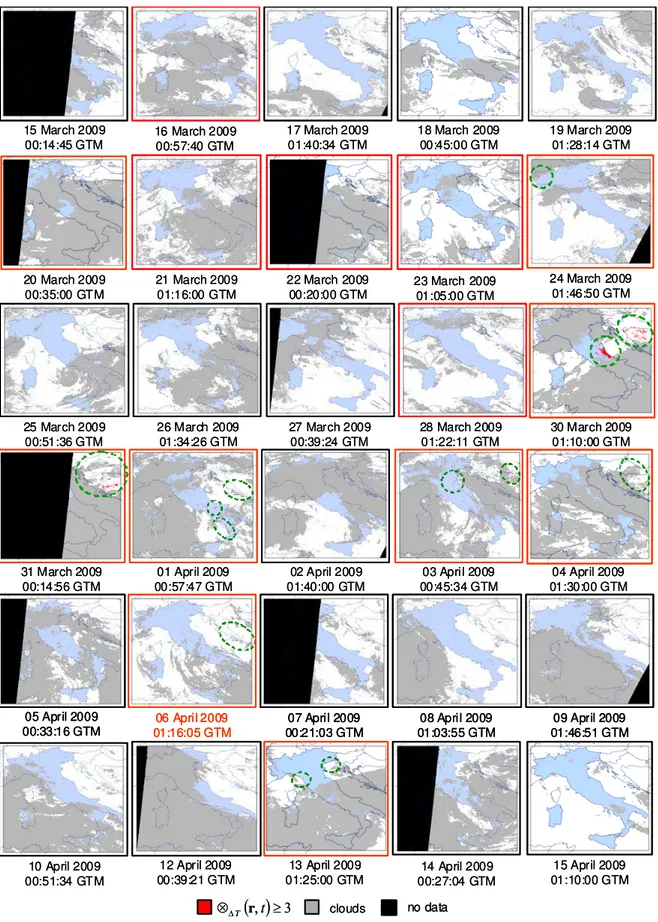
Looking at the sequence of pictures of Fig. 4 it is possible to note that, in this case, pixels with⊗1T(r,t )≥3 appear in the northern part of Italian peninsula on 24 March (in Pied-mont region) and on 3 April (in the Padania plain), while
01 April 2009 00:57:47 GTM
02 April 2009 01:40:00 GTM
03 April 2009 00:45:34 GTM 31 March 2009
00:14:56 GTM
04 April 2009 01:30:00 GTM 01 April 2009
00:57:47 GTM
02 April 2009 01:40:00 GTM
03 April 2009 00:45:34 GTM 31 March 2009
00:14:56 GTM
04 April 2009 01:30:00 GTM
08 April 2009 01:03:55 GTM 07 April 2009
00:21:03 GTM
09 April 2009 01:46:51 GTM 06 April 2009
01:16:05 GTM 05 April 2009
00:33:16 GTM
08 April 2009 01:03:55 GTM 07 April 2009
00:21:03 GTM
09 April 2009 01:46:51 GTM 06 April 2009
01:16:05 GTM 05 April 2009
00:33:16 GTM
08 April 2009 01:03:55 GTM 07 April 2009
00:21:03 GTM
09 April 2009 01:46:51 GTM 06 April 2009
01:16:05 GTM 05 April 2009
00:33:16 GTM
21 March 2009 01:16:00 GTM
24 March 2009 01:46:50 GTM 20 March 2009
00:35:00 GTM
23 March 2009 01:05:00 GTM 22 March 2009
00:20:00 GTM 21 March 2009
01:16:00 GTM
24 March 2009 01:46:50 GTM 20 March 2009
00:35:00 GTM
23 March 2009 01:05:00 GTM 22 March 2009
00:20:00 GTM 15 March 2009
00:14:45 GTM
16 March 2009 00:57:40 GTM
17 March 2009 01:40:34 GTM
19 March 2009 01:28:14 GTM 18 March 2009
00:45:00 GTM 15 March 2009
00:14:45 GTM
16 March 2009 00:57:40 GTM
17 March 2009 01:40:34 GTM
19 March 2009 01:28:14 GTM 18 March 2009
00:45:00 GTM
28 March 2009 01:22:11 GTM 26 March 2009
01:34:26 GTM
27 March 2009 00:39:24 GTM 25 March 2009
00:51:36 GTM
30 March 2009 01:10:00 GTM 28 March 2009
01:22:11 GTM 26 March 2009
01:34:26 GTM
27 March 2009 00:39:24 GTM 25 March 2009
00:51:36 GTM
30 March 2009 01:10:00 GTM
14 April 2009 00:27:04 GTM 10 April 2009
00:51:34 GTM
12 April 2009 00:39:21 GTM
13 April 2009 01:25:00 GTM
15 April 2009 01:10:00 GTM 14 April 2009
00:27:04 GTM 10 April 2009
00:51:34 GTM
12 April 2009 00:39:21 GTM
13 April 2009 01:25:00 GTM
15 April 2009 01:10:00 GTM
( )
, ≥3⊗ΔT
( )
r,t ≥3 clouds no data⊗ΔT rt clouds no data
( )
≥ ⊗Δ( )
≥ ⊗ΔFig. 4.Validation: results of the RETIRA index computation on the investigated area before and after the Abruzzo earthquake (6 April 2009,
ML∼5.8). Pixels with⊗1T(r,t )≥3 are depicted in red. Cloudy locations are depicted in gray. Red boxes identify images with detected
244 N. Pergola et al.: Assessing of monitoring TIR anomalies of the Abruzzo earthquake
( )
, ≥3⊗ΔT r t
( )
, ≥2⊗ΔT r t
( )
, ≥2,5⊗ΔT r t
clouds no data
tectonics lineament
( )
, ≥3⊗ΔT r t
( )
, ≥2⊗ΔT r t
( )
, ≥2,5⊗ΔT r t
clouds no data
tectonics lineament 16 March 2009
00:57:40 GTM
21 March 2009 01:16:00 GTM 20 March 2009
00:35:00 GTM
22 March 2009 00:20:00 GTM 16 March 2009
00:57:40 GTM
21 March 2009 01:16:00 GTM 20 March 2009
00:35:00 GTM
22 March 2009 00:20:00 GTM
24 March 2009 01:46:50 GTM
28 March 2009 01:22:11 GTM 23 March 2009
01:05:00 GTM
30 March 2009 01:10:00 GTM 24 March 2009
01:46:50 GTM
28 March 2009 01:22:11 GTM 23 March 2009
01:05:00 GTM
30 March 2009 01:10:00 GTM
01 April 2009 00:57:47 GTM
03 April 2009 00:45:34 GTM 31 March 2009
01:14:56 GTM
04 April 2009 01:30:00 GTM 01 April 2009
00:57:47 GTM
03 April 2009 00:45:34 GTM 31 March 2009
01:14:56 GTM
04 April 2009 01:30:00 GTM
06 April 2009 01:16:05 GTM
13 April 2009 01:25:00 GTM 06 April 2009
01:16:05 GTM
13 April 2009 01:25:00 GTM
( )
≥ ⊗ΔFig. 5. Validation: as in Fig. 4. Only scenes containing pixels with RETIRA≥3 are reported here. Lower intensity thermal anomalies (RETIRA≥2) are also depicted in different yellow tones.
appreciate the time evolution of the TIR anomalies before observed. Low intensity anomalies (Fig. 5) generally follow the stronger ones depicted in Fig. 4, noticeably enlarging the anomaly area and filling gaps both in the space (among iso-lated anomalous pixels) and time domains.
As already discussed in previous works (Filizzola et al., 2004; Tramutoli et al., 2005), the RETIRA index is intrin-sically not protected from the abrupt occurrence of signal
effect originated by the night time passage of a cloudy sys-tem and/or by particular industrial emissions coming from the Italsider steel plant (the most important in Italy located in Taranto) have been considered among the possible causes of this spatially extended but not time persistent anomaly. Spatial extension and persistence in time are in fact the fur-ther requirements to be satisfied (togefur-ther with relative inten-sity) in order to preliminarily identify significant TIR anoma-lies.
Taking these requirements in mind, four sequences can be discriminated, as also reported in the panels of Fig. 5:
– since 30 March – i.e. 7 days before the main shock of Abruzzo earthquake and a few hours before its strongest foreshock (ML∼4.1) occurred on 30 March at 13:38 UTC – TIR anomalies are visible near seismic epicenters;
– in the following days, these anomalous pixels slowly weaken until they disappear on 4 April (areas bordered by black dashed lines in Fig. 5);
– anomalous pixels with⊗1T(r,t )≥2 affect the Pada-nia plain in correspondence the tectonic lineament, for some days beginning from 21 March until 3 April (areas bordered by purple dashed lines in Fig. 5). A seismic event with magnitude ML∼4.6 occurred in this area (Forl`ı earthquake) on 5 April 2009 (INGV, 2009); – in the Piedmont region, beginning from 16 March up
to 28 March, anomalous values at different levels of in-tensity are present in correspondence of a tectonic linea-ment with variable persistence in the space and time (ar-eas bordered by blue dashed lines in Fig. 5). A seismic event with magnitude ML∼3.9 occurred in this area (Bra earthquake) on 19 April 2009 (INGV, 2009); – also in the Balkan region from 22 March to 6 April
lower intensity anomalies are present with a variable spatial distribution (areas bordered by brown dashed lines in Fig. 5). The regions has been affected by seis-mic events with magnitudeML∼4.2 on 31 March 2009 (INGV, 2009).
5 Confutation analysis
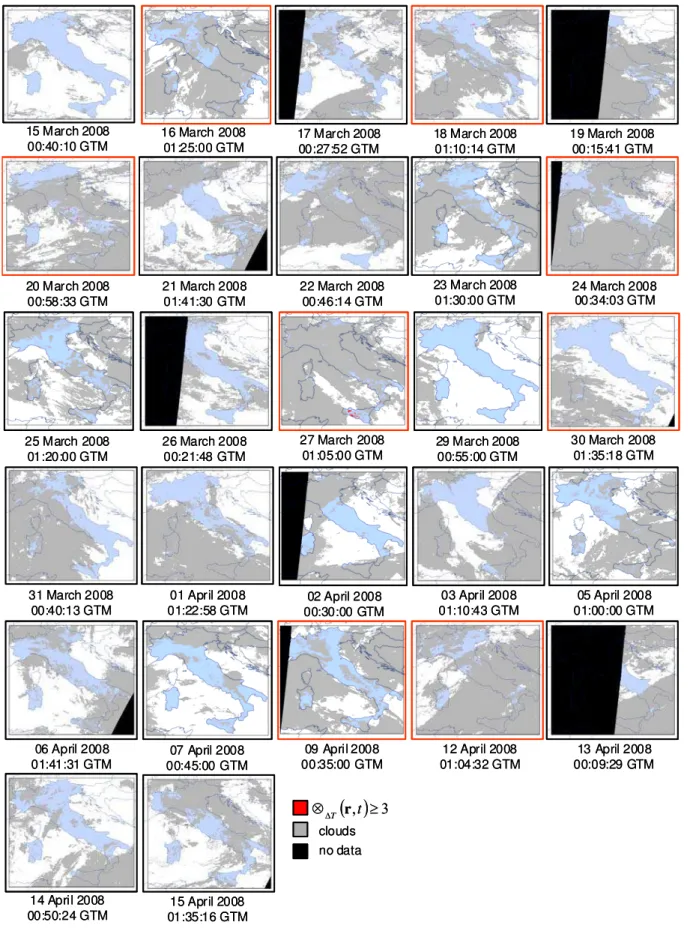
In order to verify the absence of TIR anomalies in a relatively seismically unperturbed period, the confutation phases has been performed by considering the same period (15 March– 15 April) but in a different year (2008). The selection of 2008 for confutation purposes has been done consulting the INGV (2009) seismic catalogue: within the range 2000– 2009 no seismic event with magnitude greater than (or equal to) 5 is reported over the investigated area during the months of March and April 2008 (Fig. 6a). As for the validation step,
the same cut at 3σ (i.e. ⊗1T(r,t )≥3)has been used in or-der to identify thermal anomalies and scenes affected by a wide (>80%) cloudy coverage are not shown at all (Fig. 6b). Figure 7 shown the result of confutation analysis.
It is possible to note that only isolated (16 March in north Italy, 18 March in northeast of Italy, 20 March in central Italy, 24 March in the Balkan region, 27 March in Sicilia island, 30 March in Tyrrhenian sea, 9 April in southern of Italy, and 12 April in Padania plain) and not time persistent (disappearing just in 1 day) anomalous pixels are detected. Other sporadic anomalies (1–2 pixels) are present in some of the remaining scene marked by red boxes in Fig. 7 to indicate that they contain at least 1 pixel with RETIRA>3.
6 Conclusions
In this paper, the RST approach has been applied for the first time to thermal image acquired by MODIS sensor on board EOS satellites, in order to verify the possible space-time re-lationships among TIR anomalies appearance and seismic events occurrence. The Abruzzo earthquake (6 April 2009,
ML∼5.8) has been considered as a test case for validation, while a relatively unperturbed period (no earthquakes with
M≥5) was taken for confutation in the same months (March– April) of a different year (2008). Ten years (2000–2009) of MODIS TIR observations have been analyzed to char-acterize the TIR signal behavior in the absence of signifi-cant seismic activity. The validation/confutation approach puts in relief that spatially extended and time persistent TIR anomalies (with RETIRA≥3) appear in some space-time cor-relation with earthquakes of different magnitude occurred in Italy in the considered period (15 March–15 April) and since seven days before the Abruzzo main shock (April 6th 2009,
ML∼5.8). No similar significant (in terms of relative tensity and space-time persistence) TIR anomalies were in-stead detected during seismically unperturbed periods used for confutation purposes.
The relation between TIR anomalies and earthquake with medium-low magnitude, already found in previous work (e.g. Corrado et al., 2005) appears also confirmed. In fact TIR anomalies persistent in the space-time domain are visi-ble near tectonic feature some days before seismic events of medium-low magnitude (3.9<ML<4.6) occurred in Italy and in the Balkan region in the same period. It should be noted that thermal anomalies of similar relative intensity (S/N≥3) have been never observed by using polar satellites (Aliano et al., 2008a).
Still meteorological clouds seem to limit the potential of such satellite surveys in the TIR spectral regions:
246 N. Pergola et al.: Assessing of monitoring TIR anomalies of the Abruzzo earthquake
σ
⊗
Δ( )
≥
≥
(a)
σ
⊗
Δ( )
≥
≥
(b)
8 April 2008 01:29:07 GTM
Fig. 6. (a)Seismic events (ML≥4) occurred during March–April 2008 (INGV, 2009). (b)Left: calculation of cloudy coverage on all the
scenes processed for 2008: grey bars represent the percentage of cloudy pixels over image; red bars represent the percentage of anomalous pixels over the remaining cloud free pixels in the image; Right: example on 8 April 2008 scene of artefacts (spurious TIR anomalies) due to the poorness of cloud-free pixels where RETIRA index can be computed and to the cloud masking most of the warmest part of the scene (cold spatial average effect, see text).
- by generating artefacts (e.g.cold spatial average effect) related to their relative amount and spatial disposition on the scene;
- by affecting the space-time persistence analysis reduc-ing the number of identifiable persistences.
14 April 2008 00:50:24 GTM
15 April 2008 01:35:16 GTM 14 April 2008
00:50:24 GTM
15 April 2008 01:35:16 GTM 15 March 2008
00:40:10 GTM
17 March 2008 00:27:52 GTM
18 March 2008 01:10:14 GTM
19 March 2008 00:15:41 GTM 16 March 2008
01:25:00 GTM 15 March 2008
00:40:10 GTM
17 March 2008 00:27:52 GTM
18 March 2008 01:10:14 GTM
19 March 2008 00:15:41 GTM 16 March 2008
01:25:00 GTM
20 March 2008 00:58:33 GTM
21 March 2008 01:41:30 GTM
24 March 2008 00:34:03 GTM 22 March 2008
00:46:14 GTM
23 March 2008 01:30:00 GTM 20 March 2008
00:58:33 GTM
21 March 2008 01:41:30 GTM
24 March 2008 00:34:03 GTM 22 March 2008
00:46:14 GTM
23 March 2008 01:30:00 GTM
25 March 2008 01:20:00 GTM
26 March 2008 00:21:48 GTM
30 March 2008 01:35:18 GTM 27 March 2008
01:05:00 GTM
29 March 2008 00:55:00 GTM 25 March 2008
01:20:00 GTM
26 March 2008 00:21:48 GTM
30 March 2008 01:35:18 GTM 27 March 2008
01:05:00 GTM
29 March 2008 00:55:00 GTM
31 March 2008 00:40:13 GTM
01 April 2008 01:22:58 GTM
03 April 2008 01:10:43 GTM 02 April 2008
00:30:00 GTM
05 April 2008 01:00:00 GTM 31 March 2008
00:40:13 GTM
01 April 2008 01:22:58 GTM
03 April 2008 01:10:43 GTM 02 April 2008
00:30:00 GTM
05 April 2008 01:00:00 GTM
06 April 2008 01:41:31 GTM
12 April 2008 01:04:32 GTM
13 April 2008 00:09:29 GTM 07 April 2008
00:45:00 GTM
09 April 2008 00:35:00 GTM 06 April 2008
01:41:31 GTM
12 April 2008 01:04:32 GTM
13 April 2008 00:09:29 GTM 07 April 2008
00:45:00 GTM
09 April 2008 00:35:00 GTM
( )
, ≥3⊗ΔT rt
clouds no data
( )
, ≥3⊗ΔT rt
clouds no data
( )
≥ ⊗ΔFig. 7. Confutation: as in Fig. 4 for the relatively unperturbed year 2008 (no earthquakes withML>5 occurred in the same area and
248 N. Pergola et al.: Assessing of monitoring TIR anomalies of the Abruzzo earthquake
Edited by: P. F. Biagi
Reviewed by: L. Telesca and another anonymous referee
References
Aliano, C., Corrado, R., Filizzola, C., Pergola, N., and Tra-mutoli, V.: Robust Satellite Techniques (RST) For Seismi-cally Active Areas Monitoring: The Case Of 21st May, 2003 Boumerdes/Thenia (Algeria) Earthquake, Proceedings of Mul-titemp 2007, 1–6, doi:10.1109/MULTITEMP.2007.4293042, 2007.
Aliano, C., Corrado, R., Filizzola, C., Genzano, N., Pergola, N., and Tramutoli, V.: TIR Satellite Techniques for monitoring Earth-quake active regions: limits, main achievements and perspec-tives, Ann. Geofis., 51(1), 303–317, 2008a.
Aliano, C., Corrado, R., Filizzola, C., Pergola, N., and Tramutoli, V.: Robust satellite techniques (RST) for the thermal monitoring of earthquake prone areas: the case of Umbria-Marche October, 1997 seismic events, Ann. Geofis., 51, 2/3, 451–459, 2008b. Aliano, C., Corrado, R., Filizzola, C., Genzano, N., Lanorte, V.,
Lisi, M., Martinelli, G., Pergola, N., and Tramutoli, V.: Robust Satellite Techniques for monitoring TIR anomalies in seismo-genic areas, Proceedings of the Second Workshop on the Use of Remote Sensing Techniques for Monitoring Volcanoes and Seis-mogenic Areas, 2008c.
Bonfiglio, A., Macchiato, M., Pergola., N., Pietrapertosa, C., and Tramutoli, V.: AVHRR automated detection of volcanic clouds, Int. J. Remote Sens., 26(1), 9–27, 2005.
Corrado, R., Caputo, R., Filizzola, C., Pergola, N., Pietrapertosa, C., and Tramutoli, V.: Seismically active area monitoring by ro-bust TIR satellite techniques: a sensitivity analysis on low mag-nitude earthquakes in Greece and Turkey, Nat. Hazards Earth Syst. Sci., 5, 101–108, 2005,
http://www.nat-hazards-earth-syst-sci.net/5/101/2005/.
Cuomo, V., Lasaponara, R., and Tramutoli, V.: Evaluation of a new satellite-based method for forest fire detection, Int. J. Remote Sens., 22(9), 1799–1826, 2001.
Cuomo, V., Filizzola, C., Pergola, N., Pietrapertosa, C., and Tra-mutoli, V.: A self-sufficient approach for GERB cloudy radiance detection, Atmos. Res., 72(1–4), 39–56, 2004.
Di Bello, G., Filizzola, C., Lacava, T., Marchese, F., Pergola, N., Pietrapertosa, C., Piscitelli, S., Scaffidi, I., and Tramutoli, V.: Robust Satellite Techniques for Volcanic and Seismic Hazards Monitoring, Ann. Geophys., 47(1), 49–64, 2004.
Filizzola, C., Pergola, N., Pietrapertosa, C., and Tramutoli, V.: Ro-bust satellite techniques for seismically active areas monitoring: a sensitivity analysis on September 7, 1999 Athens’s earthquake, Phys. Chem. Earth, 29, 517–527, 2004.
Filizzola, C., Lacava, T., Marchese, F., Pergola, N., Scaffidi, I., and Tramutoli, V.: Assessing RAT (Robust AVHRR Techniques) per-formances for volcanic ash cloud detection and monitoring in near realtime: The 2002 eruption of Mt. Etna (Italy), Remote Sens. Environ., 107, 440–454, 2007.
Genzano, N., Aliano, C., Filizzola, C., Pergola, N., and Tramutoli, V.: A robust satellite technique for monitoring seismically ac-tive areas: The case of Bhuj-Gujarat earthquake, Tectonophysics, 431, 197–210, 2007.
Genzano, N., Aliano, C., Corrado, R., Filizzola, C., Lisi, M., Pa-ciello, R., Pergola, N., Tsamalashvili, T., and Tramutoli, V.:
As-sessing of the Robust Satellite Techniques (RST) in areas with moderate seismicity, in: Multitemp 2009, Fifth International Workshop on the Analysis of Multitemporal Remote Sensing Im-ages, Mistic, Connecticut, USA, 307-314, 28–30 July 2009. Gorny, V. I., Salman, A. G., Tronin, A. A., and Shilin, B. B.: The
Earth outgoing IR radiation as an indicator of seismic activity, P. Acad. Sci. USSR, 301, 67–69, 1988.
Hamza, V. M.: Tectonic leakage of fault bounded aquifers subject to non-isothermal recharge: A mechanism generating thermal pre-cursors to seismic events. Phys. Earth Planet. In., 126, 163–177, 2001.
INGV (Istituto Nazionale di Geofisica e Vulcanologia): The Ital-ian seismic bullettin, available at: http://iside.rm.ingv.it/iside/ standard/index.jsp, 2009.
Lacava, T., Cuomo, V., Di Leo, E. V., Pergola, N., Romano, F., and Tramutoli, V.: Improving soil wetness variations monitoring from passive microwave satellite data: the case of April 2000 Hungary flood, Remote Sens. Environ., 96/2, 135–148, 2005. Lacava, T., Di Leo, E. V., Pergola, N., and Tramutoli, V.:
Space-time soil wetness variations monitoring by a multi-temporal mi-crowave satellite records analysis, Phys. Chem. Earth, 31, 1274– 1283, 2006.
Mazzeo, G., Marchese, F., Filizzola, C., Pergola, N., and Tramutoli, V.: A Multi-temporal Robust Satellite Technique (RST) for forest fire detection, in: Multitemp 2007, Louven, Belgium, 1-6, doi:10.1109/MULTITEMP.2007.4293060, avail-able at: http://ieeexplore.ieee.org/xpl/tocresult.jsp?isnumber= 4293029\&isYear=2007, 18-20 July 2007.
Marchese, F., Pergola, N., and Telesca, L.: Investigating the tempo-ral fluctuations in satellite Advanced very High Resolution Ra-diometer thermal signals measured in the volcanic area of Etna (Italy), Fluctuations Noise Lett., 6(3), 305–316, 2006.
Ouzounov, D. and Freund, D.: Mid-infrared emission prior to strong earthquakes analyzed by remote sensing data, Adv. Space Res., 33, 268–273, 2004.
Pergola, N., Pietrapertosa, C., Lacava, T., and Tramutoli, V.: Ro-bust satellite techniques for monitoring volcanic eruptions, Ann. Geophys., 44(2), 167–177, 2001.
Pergola, N., Tramutoli, V., and Marchese, F.: Automated detec-tion of thermal features of active volcanoes by means of infrared AVHRR records, Remote Sensing Environ., 93, 311–327, 2004a. Pergola, N., Tramutoli, V., Scaffidi, I., Lacava, T., and Marchese F.: Improving volcanic ash clouds detection by a robust satellite technique, Remote Sens. Environ., 90(1), 1–22, 2004b.
Pulinets, S. A., Boyarchuk, K. A., Hegai, V. V., and Kare-lin, A. V.: Conception and model of seismo-ionosphere-magnetosphere coupling, in: Seismo-Electromagnetics: Lithosphere-Atmosphere-Ionosphere Coupling, edited by: Hayakawa, M. and Molchanov, O. A., Terra Scientific Publish-ing Co., Tokyo, 353–361, 2002.
Pulinets, S. A., Ouzounov, D., Karelin, A. V., Boyarchuk, K. A., and Pokhmelnykh, L.A.: The physical nature of thermal anomalies observed before strong earthquakes, Phys. Chem. Earth, 31, 143– 153, 2006.
Pulinets, S. A., Biagi, P., Tramutoli, V., Legen’ka, A. D., and Depuev, V. K.: Irpinia earthquake 23 November 1980 – Lesson from Nature reviled by joint data analysis, Ann. Geophys., 50(1), 61–78, 2007.
temperature increase precursor of Gonghe earthquake of magni-tude 7.0, Qinghai Province, Geoscience, 6(3), 297–300, 1992. Qiang, Z. J., Xu, X. D., and Dian, C. G.: Thermal infrared anomaly
precursor of impending earthquakes, Chinese Sci. Bull., 36(4), 319–323, 1991.
Qiang, Z. J., Xu, X. D., and Dian, C. G.: Thermal infrared anomaly precursor of impending earthquakes, Pure Appl. Geophys., 149, 159–171, 1997.
Tramutoli, V.: Robust AVHRR techniques (RAT) for environmental monitoring: theory and applications, Earth surface remote sens-ing II, in: Proceedsens-ings of SPIE, 3496, 101–113, 1998.
Tramutoli, V.: Robust Satellite Techniques (RST) for natural and environmental hazards monitoring and mitigation: ten years of successful applications, in: ISP MSRS 2005 Conference Pro-ceedings, Beijing, China, 2005.
Tramutoli, V.: Robust Satellite Techniques (RST) for Natural and Environmental Hazards Monitoring and Mitigation: The-ory and Applications, Proceedings of Multitemp 2007, 1–5, doi:10.1109/MULTITEMP.2007.4293057, 2007.
Tramutoli, V., Claps, P., Marella, M., Pergola, N., Pietraper-tosa, C., and Sileo, C.: Hydrological implications of remotely-sensed thermal inertia, in: Remote Sensing and Hydrology 2000, vol. 267, edited by: Owe, M., Brubaker, K., Ritchie, J., and Rango, A., IAHS Publ., 207–211, 2001a.
Tramutoli, V., Di Bello, G., Pergola, N., and Piscitelli, S.: Robust satellite techniques for remote sensing of seismically active ar-eas, Ann. Geophys., 44(2), 295–312, 2001b.
Tramutoli, V., Pergola, N., and Pietrapertosa, C.: Training on NOAAAVHRR of robust satellite techniques for next genera-tion of weather satellites: an applicagenera-tion to the study of space-time evolution of Pinatubo’s stratospheric volcanic cloud over Europe, in: IRS 2000: Current Problems in Atmospheric Radia-tion, edited by: Smith, W. L. and Timofeyev, Yu. M., VA’ Deepak Publishing, Hampton, 36–39, 2001c.
Tramutoli, V., Cuomo, V., Filizzola, C., Pergola, N., and Pietrap-ertosa, C.: Assessing the potential of thermal infrared satellite surveys for monitoring seismically active areas: The case of Ko-caeli ( ´Yzmit) earthquake, August 17, 1999, Remote Sens. Envi-ron., 96, 409–426, 2005.
Tronin, A. A.: Satellite thermal survey – a new tool for the study of seismoactive regions, Int. J. Remote Sens., 41(8), 1439–1455, 1996.
Tronin, A. A.: Thermal IR satellite sensor data application for earth-quake research in China, Int. J. Remote Sens., 21(16), 3169– 3177, 2000.