Nat. Hazards Earth Syst. Sci., 10, 395–406, 2010 www.nat-hazards-earth-syst-sci.net/10/395/2010/ © Author(s) 2010. This work is distributed under the Creative Commons Attribution 3.0 License.
Natural Hazards
and Earth
System Sciences
A study on the Abruzzo 6 April 2009 earthquake by applying
the RST approach to 15 years of AVHRR TIR observations
M. Lisi1, C. Filizzola2, N. Genzano1, C. S. L. Grimaldi2, T. Lacava2, F. Marchese2, G. Mazzeo1, N. Pergola2,1, and V. Tramutoli1,2
1University of Basilicata, Department of Engineering and Physics of the Environment, Potenza, Italy
2National Research Council, Institute of Methodologies for Environmental Analysis (IMAA), Tito Scalo (PZ), Italy Received: 1 November 2009 – Accepted: 1 February 2010 – Published: 26 February 2010
Abstract. A self adaptive approach (RST, Robust Satellite Technique) has been proposed as a suitable tool for satel-lite TIR surveys in seismically active regions devoted to de-tect and monitor thermal anomalies possibly related to earth-quake occurrence. In this work, RST approach has been applied to 15 years of AVHRR (Advanced Very High Res-olution Radiometer) thermal infrared observations in order to study the 6 April 2009 Abruzzo earthquake. Prelimi-nary results show clear differences in TIR anomalies oc-currence during the periods used for validation (15 March– 15 April 2009) and the one (15 March–15 April 2008) with-out earthquakes with ML≥4.5, used for confutation pur-poses. Quite clear TIR anomalies appears also to mark main tectonic lineaments during the preparatory phases of others, low magnitude(3.9<ML<4.6) earthquakes, occurred in the area in the same period.
1 Introduction
In the past years several studies (see for example Gorny et al., 1988; Qiang and Dian, 1992; Tronin, 1996; Qiang et al., 1997; Tronin et al., 2002; Ouzounov and Freund, 2004) have already reported the appearance of space-time anomalies in TIR (Thermal Infra-Red) satellite imagery before (from weeks to days) severe earthquakes. Such anomalies, located near the place and the time of an earthquake, have been at-tributed to the increase of green-house gas (such as CO2, CH4) emission rates (e.g. Qiang et al., 1991; Tramutoli et al., 2001, 2009, and reference herein), to the modification of ground water regime (e.g. Hamza, 2001), to the increase of convective heat flux (Qiang et al., 1991; Tronin, 2000), to
Correspondence to:M. Lisi ([email protected])
more complex phenomena (e.g. Pulinets et al. 2002, 2006, 2007; Ouzounov and Freund, 2004) all including, among the others pre-seismic effects, the increasing of near surface tem-perature.
Several studies have been published claiming the corre-lation among TIR signal fluctuations and earthquake prepa-ration which were mainly affected by the absence of con-vincing testing steps (based, for instance, on a valida-tion/confutation approach) and/or lacking for whatever atten-tion to the possibility that other causes (e.g. meteorological), different from seismic activity, could be responsible for the observed TIR variations.
Moving also from these evident limits, a different ap-proach, named Robust Satellite Technique (RST; Tramutoli, 2005, 2007) – formerly RAT (Robust AVHRR Technique, Tramutoli, 1998) – was proposed in order to investigate pos-sible relations between earthquake occurrence and space-time fluctuations of Earth’s emitted TIR radiation observed from satellite.
In fact RST approach is based on a statistical definition of “TIR anomalies” and on a suitable method for their iden-tification even in very different local (e.g. related to atmo-sphere and/or surface) and observational (e.g. related to the time/season or satellite view angles) conditions. Since its first implementation, it has been always carried out by using a validation/confutation approach, in order to verify the pres-ence/absence of anomalous space-time TIR transients in the presence/absence of seismic activity.
396 M. Lisi et al.: AVHRR TIR observation during the Abruzzo earthquake In this paper the Abruzzo earthquake (6 April 2009,
ML∼5.8) has been studied by applying the RST approach to 15 years of data acquired (in the TIR spectral band 10.3– 11.3 µm) by AVHRR sensor flying onboard NOAA (Na-tional and Oceanic Atmospheric Administration) satellites. As usual the results obtained by RST analysis at the time of this earthquake (validation) will be compared with the ones obtained by an identical analysis performed over the same area, in similar observational conditions (same period) but in a seismically unperturbed (i.e. without earthquakes of similar magnitude) period (confutation).
2 A robust estimator of thermal anomalies
The RST approach is a general change detection method for satellite data analysis already successfully applied to moni-tor major natural and environmental hazards related to: flood risk (Tramutoli et al., 2001a; Lacava et al., 2005, 2006, 2010); volcanic activity (Pergola et al., 2001, 2004a, b; Tra-mutoli et al., 2001c; Di Bello et al., 2004; Bonfiglio et al., 2005; Marchese et al., 2006; Filizzola et al., 2007); forest fires (Cuomo et al., 2001; Mazzeo et al., 2007), etc. Af-ter its first application to the 1980 Irpinia-Basilicata’s earth-quake (Di Bello et al., 2004; Tramutoli et al., 2001b) RST has been applied to seismically active area monitoring for several other earthquake events: Athens, 7 September 1999 (Filizzola et al., 2004); Izmit, 17 August 1999 (Tramutoli et al., 2005); Gujarat, 26 January 2001 (Genzano et al., 2007), Boumerdes/Thenia, 21 May 2003 (Aliano et al., 2007); Hec-tor Mine, 16 October 1999 (Aliano et al., 2008a), Umbria-Marche, October 1997 (Aliano et al., 2008b), Mestia Tianeti (Georgia) 23 October 1992 (Genzano et al., 2009) and var-ious seismic events occurred in Greece and Turkey, in May and June 1995–1996 (Corrado et al., 2005).
RST is based on a preliminary multi-temporal analysis of several years (from 4 to 10 and more depending on the avail-ability of historical data-sets) of homogeneous satellite TIR records co-located in the space-time domain, devoted to char-acterize the TIR signal (in terms of its expected value and natural variability range) for each pixel of the satellite im-age to be processed. On this basis, anomalous TIR patterns are identified as a deviation from those “normal” conditions, using a specific index, RETIRA (Robust Estimator of TIR Anomalies, Filizzola et al., 2004; Tramutoli, 2005), com-puted on the image at hand as in Eq. (1):
⊗1T(r,t )=
1T (r,t )−µ1T(r)
σ1T(r) (1)
where:
r≡(x,y)represents location coordinates centre of the
con-sidered pixel on satellite image at hand;
t is the time of image acquisition with t∈τ, where
τ defines the homogeneous domain of satellite imagery
collected in the same time-slot of the day and period (month) of the year;
1T (r,t )=T (r,t )−T (t )is the value of the difference
be-tween the punctual value of brightness temperatureT (r,t )at
the locationr≡(x,y)and acquisition timet, and its spatial
averageT (t )computed on the investigated area considering only cloud-free locations, all belonging to the same, land or sea, class (i.e. considering only sea pixels ifr is located on
the sea and only land pixels if it is located on the land). Note that the choice of such a differential variable 1T (r,t )
in-stead ofT (r,t )is expected to reduce possible contributions
(e.g. occasional warming) due to day-to-day and/or year-to-year climatological changes and/or season time-drifts;
µ1T(r) time average value of 1T (r,t ) at the location r≡(x,y)computed on cloud free records belonging the
se-lected data set (t∈τ);
σ1T(r) standard deviation of 1T (r,t ) at the location r≡(x,y)computed on cloud free records belonging the
se-lected data set (t∈τ).
By this way⊗1T(r,t )gives the local excess of the current
1T (r,t )signal compared with its historical mean value and weighted by its historical variability at the considered loca-tion. Both,µ1T(r)andσ1T(r), are computed, once and for
all, for each locationr, processing several years of
histori-cal satellite records acquired in similar observational condi-tions. They are two reference images describing the normal behaviour of the signal and of its variability at each loca-tionrin observational conditions as similar as possible to the
ones of the image at hand. The difference1T (r,t )−µ1T(r)
then represents the Signal (S) to be investigated for its pos-sible relation with seismic activity. It is always evaluated by comparison with the corresponding natural/observational Noise (N), represented byσ1T(r)which describes the
over-all (local) variability of S including over-all (natural and obser-vational, known and unknown) sources of its variability, as historically observed at the same site in similar observational conditions (sensor, time of day, month, etc.). In this way, the relative importance of the measured TIR signal (or the inten-sity of anomalous TIR transients) can naturally be evaluated in terms of S/N ratio by the RETIRA index.
Being independent from a specific sensor/satellite system, RST can easily be exported on different satellite data, and applied to analyze different events in the world. However, a wider and more detailed description of the RST approach and its implementation on different satellite sensors to monitor seismic areas can be found in Tramutoli et al. (2005), Aliano et al. (2008a) and in others above mentioned papers. 3 The case of Abruzzo earthquake
M. Lisi et al.: AVHRR TIR observation during the Abruzzo earthquake 397
^
_
^
_
^
_
^
_
^
_
^
_
^
_
^
_
^
_
^
_
^ _ ^ _ ^ _ ^ _ ^ _ ^ _^_ ^ _ ^ _ ^ _^_ ^ _ ^ _ ^ _ ^ _ ^ _ ^ _ ^ _ ^ _^_ ^ _ ^ _ ^ _ ^ _ ^ _^_^_^_^_ ^ _ ^ _ ^ _ ^ _ ^ _^_^_^_ ^ _ ^ _ ^ _^_^_^_^_ ^ _ ^ _ ^ _ ^ _ ^ _ ^_^_^_^_^_ ^ _ ^ _ ^ _ ^ _^__^^^_^_^_^__^_^__^ ^ _^
_
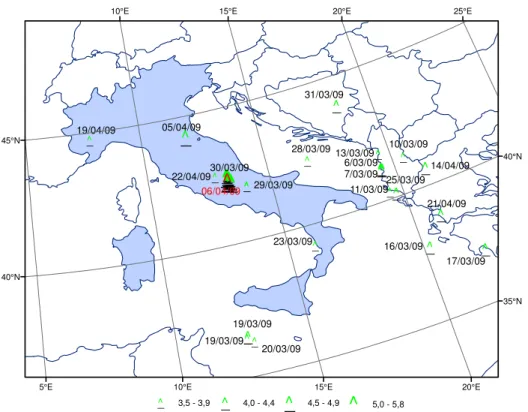
19/04/09 05/04/09 31/03/09 22/04/09 29/03/09 06/04/09 23/03/09 28/03/09 19/03/09 19/03/09 20/03/09 10/03/09 14/04/09 25/03/09 21/04/09 16/03/09 17/03/09 13/03/09 6/03/09 7/03/09 11/03/09 30/03/09 25°E 20°E 20°E 15°E 15°E 10°E 10°E 5°E 45°N 40°N 40°N 35°N ^_ 3,5 - 3,9 ^_ 4,0 - 4,4
^
_
4,5 - 4,9^
_
5,0 - 5,8Fig. 1.Seismic events withML>3.5 occurred in March and April 2009. Red star indicates the main shock of Abruzzo earthquakes (INGV, 2009).
zone has been object of frequent seismic events (Fig. 1) with characteristics of seismic swarm with hundreds of modest en-tity shake. The seismicity was confined in the upper crust and interested an area about 30 km long in the NW-SE strike direction, parallel to the Apennine mountain axis and to the main fault structures known in the area.
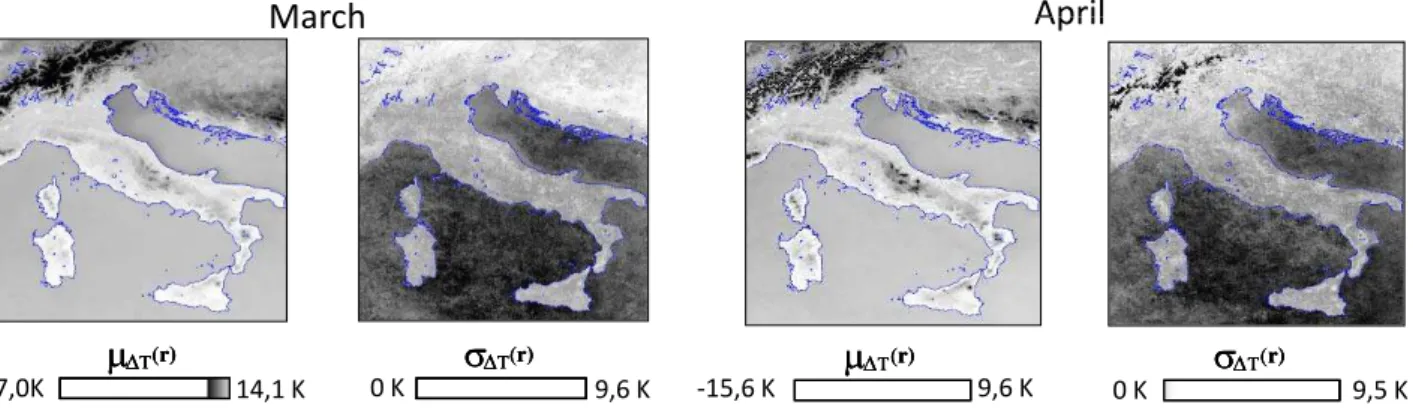
In order to perform the RST analysis on this event, 15 years (from 1995 to 2009) of NOAA-AVHRR data has been analyzed. The navigation of AVHRR data has been performed by SANA (Sub-pixel Automatic Navigation for AVHRR, Pergola and Tramutoli, 2000, 2003). Following RST prescriptions, in order to characterize TIRnormal sig-nal behaviour in the considered area and observation period (15 March–15 April), µ1T(r) andσ1T(r)reference field
(Fig. 2) were computed by using only AVHRR records col-lected:
– in the same time-slot (00:00–02:00 GMT), – during the months of March and April, – in cloud-free conditions.
The RETIRA index has been then computed for all the NOAA/AVHRR images in order to perform the following validation/confutation analyses. For validation purposes, the months of March and April 2009 have been considered, while, in the confutation phase, the analysis has been per-formed considering the months of March and April 2008:
a seismically “unperturbed” year (i.e. no earthquakes with
M≥4.5 in the same region and in the same months) in the considered data set.
4 Validation
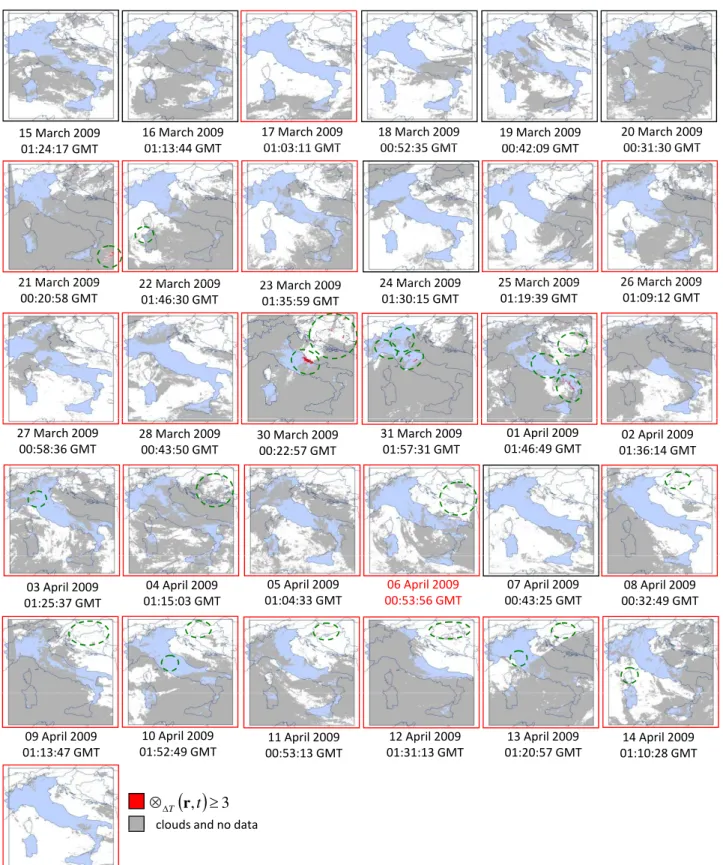
On the basis of these reference fields, TIR anomaly maps have been computed for all AVHRR night-time (00:00÷02:00 GMT) images in the period 15 March– 15 April 2009 (validation phase). Every scene has been pro-cessed but scenes affected by wide cloudy coverage (>80% of the total, like the one collected on 29 March 2009) as well as scenes clearly affected by a cold spatial average effect (Aliano et al., 2008a) due to the computation of RETIRA index on a very few number of cloud-free pixels have been excluded from further analyses (Fig. 3).
Figure 4 shows the results of the RETIRA index (⊗1T(r,t )) computation since 15 March until to 15 April
2009. Pixels with ⊗1T(r,t )≥3 (i.e. 1T (r,t )−µ1T(r)
excess greater than 3σ1T(r)) are depicted in red and
398 M. Lisi et al.: AVHRR TIR observation during the Abruzzo earthquake
March
March
μ
ΔT(r)0 K 9,6 K
σ
ΔT(r)μ
ΔT(r)μ
ΔT(r)σ
σ
ΔΔTT((r)r)14,1 K
‐17,0K ‐
μ
μ
μ
ΔΔΔσ
σ
σ
ΔΔΔch
April
ch
April
μ
Δ
σ
Δμ
Δμ
Δσ
σ
ΔΔ
‐ ‐15,6 K
μ
μ
μ
ΔΔΔTTT(((r)r)r) 9,6 K 0 Kσ
σ
σ
ΔΔΔTTT(((r)r)r) 9,5 KFig. 2.Reference fields (time averageµ1T(r)and standard deviationσ1T(r)) for the investigated area computed for March (left) and April
(right) from AVHRR data acquired in the period 1995-2009 between 00:00 and 02:00 GMT.
μ
Δσ
Δμ
Δμ
Δσ
σ
ΔΔμ
Δσ
Δμ
Δμ
Δσ
σ
ΔΔμ
μ
μ
μ
μ
μ
ΔΔΔΔΔΔσ
σ
σ
σ
σ
σ
ΔΔΔΔΔΔ( )
Δμ
σ
Δ( )
≥
29 March 2009
00:37:27 GMT
Fig. 3. Left side: calculation of cloudy coverage over all the AVHRR scenes processed for the 2009: grey bars represent the percentage of cloudy pixels over the total number of pixels in the image; red bars represent the percentage of TIR anomalies (RETIRA≥3) over the remaining cloud free pixels in the image. Right side: example, on 29 March 2009 scene, of artefacts (spurious TIR anomalies) due to the poorness of cloud-free pixels where RETIRA index can be computed and to the clouds masking quite all the warmest part of the scene (cold spatial average effect, see text).
Looking at the sequence of pictures in Fig. 4 it is possible to note that TIR anomalies (i.e. pixels with⊗1T(r,t )≥3)
appear in the Italian peninsula affecting:
– the north of Italy on 31 March on Piedmont and Veneto region, on 3 April in Padania plain, on 13 April on Apuane Alps,
– the Central Italy on 30 March on East Coast, on 31 March and 10 April on Northern Apennines, on 1 April on Central Apennines,
– the south of Italy at 1 April on the West Coast.
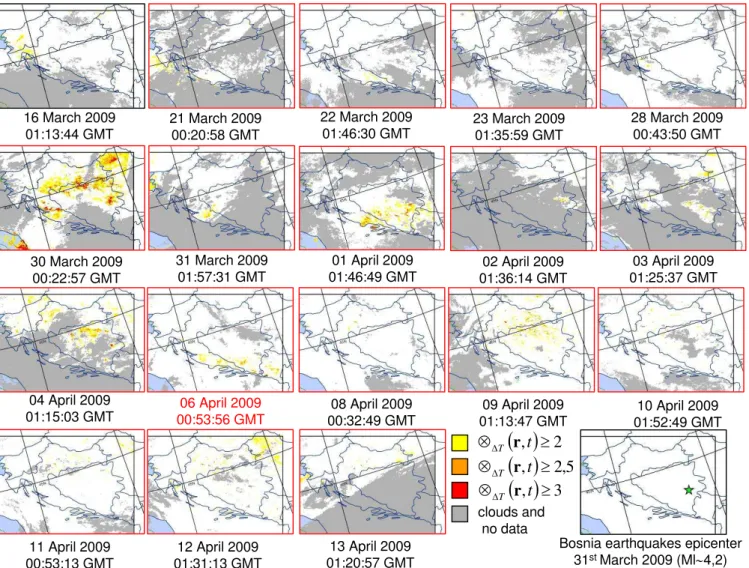
TIR anomalies are present also in the Balkan area on Bosnia region on 31 March and 1, 4, and 6 April, while they affect the northeastern part of Croatia from 8 April until 13 April. Other anomalous pixels appear on 21 March on Mediter-ranean Sea, on 22 March on northern coast of Sardegna and on 14 April on eastern coast of Corsica.
M. Lisi et al.: AVHRR TIR observation during the Abruzzo earthquake 399
15 March 2009 16 March 2009 01 13 44 GMT
17 March 2009 01 03 11 GMT
18 March 2009 00 52 35 GMT
19 March 2009 00 42 09 GMT
20 March 2009 00 31 30 GMT 01:24:17 GMT 01:13:44 GMT 01:03:11 GMT 00:52:35 GMT 00:42:09 GMT 00:31:30 GMT
21 March 2009 22 March 2009 23 M h 2009 24 March 2009 25 March 2009 26 March 2009 21 March 2009
00:20:58 GMT
22 March 2009 01:46:30 GMT
23 March 2009 01:35:59 GMT
24 March 2009 01:30:15 GMT
25 March 2009 01:19:39 GMT
26 March 2009 01:09:12 GMT
27 March 2009 00:58:36 GMT
28 March 2009 00:43:50 GMT
31 March 2009 01:57:31 GMT
01 April 2009 01:46:49 GMT 30 March 2009
00:22:57 GMT
02 April 2009 01:36:14 GMT
03 April 2009 01:25:37 GMT
04 April 2009 01:15:03 GMT
05 April 2009 01:04:33 GMT
06 April 2009 00:53:56 GMT
07 April 2009 00:43:25 GMT
08 April 2009 00:32:49 GMT
09 April 2009 01:13:47 GMT
10 April 2009 01:52:49 GMT
11 April 2009 00:53:13 GMT
12 April 2009 01:31:13 GMT
13 April 2009 01:20:57 GMT
14 April 2009 01:10:28 GMT
( )
,
≥
3
⊗
ΔTr
t
clouds and no data
15 April 2009 01:53:11 GMT
Fig. 4.Validation: results of the RETIRA index computation on the investigated area before and after the Abruzzo earthquake (6 April 2009, ML∼5.8). Pixels with⊗1T(r,t )≥3 are depicted in red. Cloudy locations are depicted in grey. Red boxes identify images containing at
400 M. Lisi et al.: AVHRR TIR observation during the Abruzzo earthquake
20 March 2009 00:31:30 GMT
28 March 2009
00:43:50 GMT 31 March 200901:57:31 GMT 30 March 2009
00:22:57 GMT
01 April 2009
01:46:49 GMT 01:36:14 GMT02 April 2009 01:25:37 GMT03 April 2009
05 April 2009 01:04:33 GMT
08 April 2009
00:32:49 GMT 01:13:47 GMT09 April 2009 01:52:49 GMT10 April 2009 01:53:11 GMT15 April 2009
( )
, ≥3 ⊗ΔT rt( )
, ≥2 ⊗ΔT rt( )
, ≥2,5 ⊗ΔT r tclouds and no data
Abruzzo seismic events
tectonic lineaments
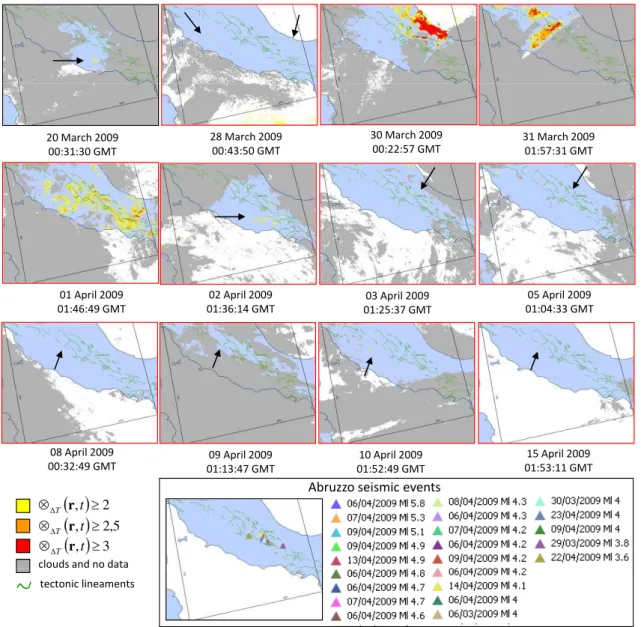
Fig. 5.Validation: the sequence of Abruzzo (6 April 2009,ML∼5.8) earthquake. As in Fig. 4 but, in this case lower intensity (⊗1T(r,t )≥2) TIR anomalies are also depicted in different yellow tones. The list of seismic events occurred during March and April 2009 is from INGV (2009).
protected from the abrupt occurrence of signal outliers re-lated to particular natural (e.g. local warming due to night-time cloud passages) or observational (e.g. errors in image navigation/co-location process) conditions. This is, for in-stance, the case of TIR anomalies detected along the north-ern coast of Sardegna at 22 March and along eastnorth-ern coast of Corsica at the 14 April: the cause of this effect is very likely a navigation/co-location error (Fig. 4).
Moreover, false TIR anomalies can be produced when the computation of the spatial average term T (t )(which con-tribute to determine the value of RETIRA index) is per-formed on a too small number of cloud-free pixels mostly concentrated in the colder portion of the scene (cold spatial average effect, Aliano et al., 2008a). This is evidently the
case of TIR anomalies affecting the Mediterranean Sea on 21 March (Fig. 4). Excluding the above mentioned artifacts, very few sequences of spatially extended and time persistent TIR anomalies can be identified that are described with some detail in Figs. 5, 6, and 7.
In order to better analyze such sequences images in Figs. 5, 6, and 7 have been reconstructed also considering lower values of the RETIRA index (pixels characterized by ⊗1T(r,t )≥2). In these figures it is easy to note that low
M. Lisi et al.: AVHRR TIR observation during the Abruzzo earthquake 401
∼
∼
16 March 2009 01:13:44 GMT
20 March 2009 00:31:30 GMT
21 March 2009 00:20:58 GMT
22 March 2009 01:46:30 GMT
24 March 2009 01:30:15 GMT
26 March 2009 01:09:12 GMT
27 March 2009 00:58:36 GMT
28 March 2009 00:43:50 GMT
31 March 2009 01:57:31 GMT
03 April 2009 01:25:37 GMT
05 April 2009 01:04:33 GMT
13 April 2009 01:20:57 GMT
14 April 2009 01:10:28 GMT
( )
,
≥
3
⊗
ΔTr
t
( )
,
≥
2
⊗
ΔTr
t
( )
,
≥
2
,
5
⊗
ΔTr
t
clouds and no data
tectonic lineaments Bra and Forlì earthquakes epicenter
∼ ∼
∼
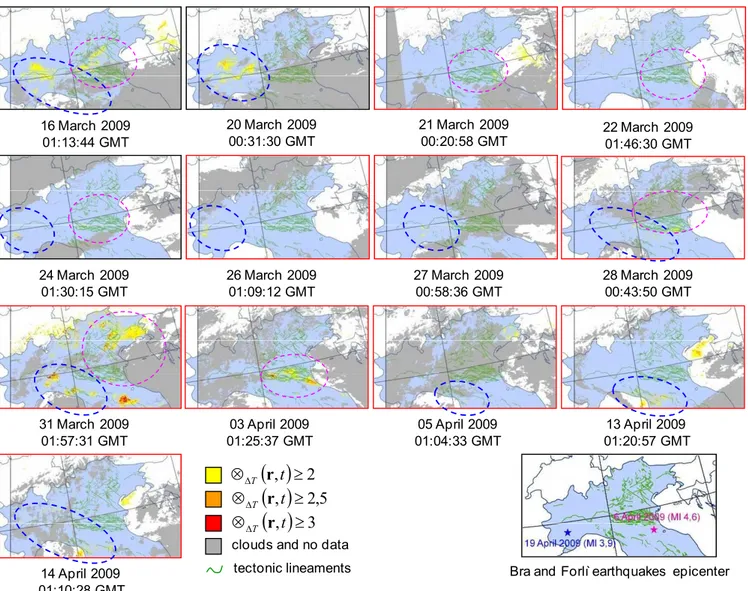
Fig. 6.Validation: as in Fig. 5 for the sequences of Forl`ı (5 April 2009,ML∼4.6) and Bra (19 April 2009,ML∼3.9) earthquakes described respectively by blue and purple dashed ellipses.
In Fig. 5 is represented the sequence of TIR anomalies af-fecting Central Italy. They appear located near tectonic linea-ments, from 30 March (about 13 h before the strongest fore-shock, withML∼4.1, occurred on 30 March at 13:38 UTC) to 1 April when they reach their maximum extension (5 days before the mainshock of Abruzzo earthquake).
TIR anomalies with lower intensity and spatial extension can be observed from 8 to 10 April and again on 15 April.
In Fig. 6 are described two sequences of TIR anoma-lies observed in the Northern Italy. The first one is visi-ble for several days between 16 March and 14 April in the north-west of Italy near the tectonic lineaments present in the Piedmont region and in the Apuane Alps (areas bordered by blue dashed ellipses) around the epicenter of Bra earth-quake (ML∼3.9) occurred in the same area on 19 April 2009 (INGV, 2009).
A second sequence of TIR anomalies is the one affect-ing Padania plain (areas bordered by purple dashed ellipses) with variable persistence in the space-time domain beginning from 16 March and continuing until 3 April (2 days before the Forli’s earthquakes,ML∼4.6; INGV, 2009).
Figure 7 better describe TIR anomalies affecting Balkan region already present in Fig. 4.
402 M. Lisi et al.: AVHRR TIR observation during the Abruzzo earthquake
16 March 2009 01:13:44 GMT
21 March 2009 00:20:58 GMT
22 March 2009 01:46:30 GMT
28 March 2009 00:43:50 GMT 23 March 2009
01:35:59 GMT
30 March 2009 00:22:57 GMT
31 March 2009 01:57:31 GMT
01 April 2009 01:46:49 GMT
02 April 2009 01:36:14 GMT
03 April 2009 01:25:37 GMT
04 April 2009 01:15:03 GMT
06 April 2009 00:53:56 GMT
09 April 2009 01:13:47 GMT
10 April 2009 01:52:49 GMT
11 April 2009 00:53:13 GMT
12 April 2009 01:31:13 GMT
13 April 2009 01:20:57 GMT 08 April 2009 00:32:49 GMT
( )
,
≥
3
⊗
ΔTr
t
( )
,
≥
2
⊗
ΔTr
t
( )
,
≥
2
,
5
⊗
ΔTr
t
clouds and no data
Bosnia earthquakes epicenter
31st March 2009 (Ml∼4,2)
Fig. 7.Validation: as in Fig. 5 for the sequences of Balkan earthquake (31 March 2009,ML∼4.2).
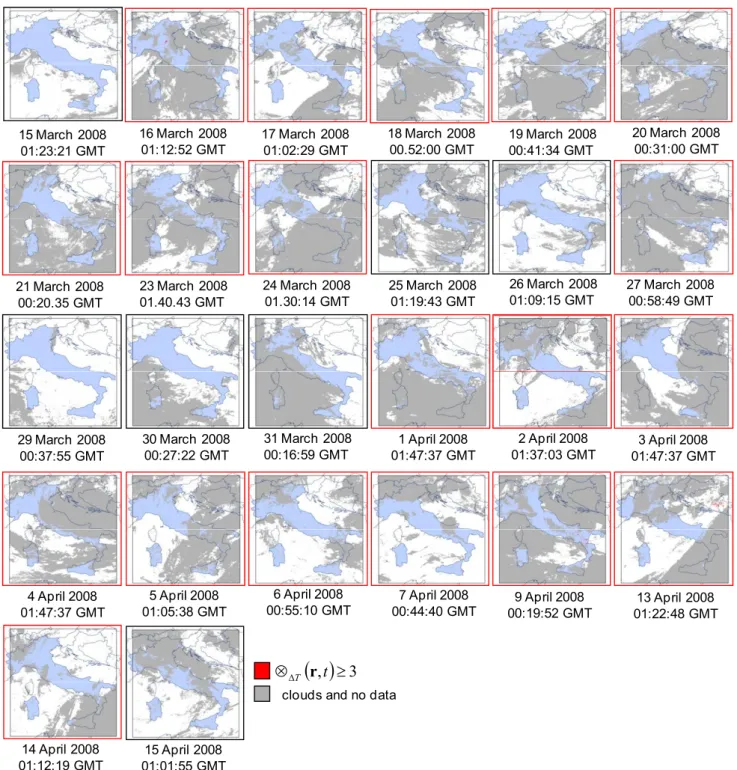
5 Confutation
The confutation step has been performed by considering the same period (15 March–15 April) but in a different year (2008), in order to verify the absence of TIR anomalies in a relatively seismically unperturbed period. The selection of 2008 for confutation purposes has been done consulting the INGV (2009) seismic catalogue: no seismic event with magnitude greater than (or equal to) 4.5 is reported over the investigated area during the months of March and April 2008 (Fig. 8a). As for the validation step, the same cut at 3σ (i.e. ⊗1T(r,t )≥3) has been used in order to identify anomalous
image pixels. As before scenes affected by a wide (>80%) cloudy coverage are not shown (Fig. 8b).
Figure 9 shows the results of RST analysis performed for the 2008. It is possible to note that only isolated (on 16 March in north part of Italy and in Puglia region, 24 March in the north-east part of Balkan area, 27 March
in Campania region, 2 April along Corsica coast, 9 April in Southern Apennines and 13 April on Bosnia region) and not time persistent (disappearing just in 1 day) TIR anomalies are detected. Other sporadic anomalies (1–2 pixels probably due to navigation errors) are present in some of the remaining analyzed days marked by red boxes in to indicate that they contain at least 1 pixel with RETIRA>3.
6 Conclusions
In this paper RST approach has been applied to the longest (15 years) time series of AVHRR images never used be-fore for investigating possible space-time relation among TIR anomalies occurrence and earthquakes. Fifteen years of NOAA/AVHRR TIR observations have been used to char-acterize the expected TIR signal behavior in the absence of significant seismic activity. The period (15 March–15 April 2009) around the time of Abruzzo earthquake (6 April 2009,
M. Lisi et al.: AVHRR TIR observation during the Abruzzo earthquake 403
(a)
≥
(b)( )
≥ ⊗Δ( )
≥ ⊗Δ( )
≥ ⊗Δ∼
8 April 2008 00:34:11 GMT
Right side of figure 8b
Fig. 8. (a)Seismic events (ML≥4) occurred during March–April 2008 (INGV, 2009). (b)Left: calculation of cloudy coverage on all the scenes processed for 2008: grey bars represent the percentage of cloudy pixels over image; red bars represent the percentage of anomalous pixels over the remaining cloud free pixels in the image. Right: example on 8 April 2008 scene of artefacts (spurious TIR anomalies) due to the poorness of cloud-free pixels where RETIRA index can be computed and to the clouds masking most of the warmest part of the scene (cold spatial average effect, see text).
the same period in a relatively unperturbed year (2008, hav-ing no earthquakes withM≥4.5) was taken for confutation.
The comparison of results achieved after the valida-tion/confutation analysis highlights the presence of several sequences of TIR anomalies with RETIRA index greater than 3 (never in the past a Signal-Noise ratio so high has been got-ten using AVHRR data or other sensors onboard polar satel-lite, Filizzola et al., 2004; Aliano et al., 2008a).
In the validation phase, TIR anomalies have been identi-fied in some space-time correlation with Abruzzo earthquake
epicenter between 30 March and 1 April. In particular very intense and extended anomalies appear near tectonic linea-ments since 30 March (few hours before the foreshock with
404 M. Lisi et al.: AVHRR TIR observation during the Abruzzo earthquake
15 March 2008 01:23:21 GMT
16 March 2008 01:12:52 GMT
17 March 2008 01:02:29 GMT
18 March 2008 00.52:00 GMT
19 March 2008 00:41:34 GMT
20 March 2008 00:31:00 GMT
21 March 2008 00:20.35 GMT
23 March 2008 01.40.43 GMT
24 March 2008 01.30:14 GMT
25 March 2008 01:19:43 GMT
26 March 2008 01:09:15 GMT
27 March 2008 00:58:49 GMT
4 April 2008 01:47:37 GMT
5 April 2008 01:05:38 GMT
6 April 2008 00:55:10 GMT
7 April 2008 00:44:40 GMT
9 April 2008 00:19:52 GMT
13 April 2008 01:22:48 GMT
14 April 2008 01:12:19 GMT
15 April 2008 01:01:55 GMT
( )
,
≥
3
⊗
Δt
T
r
clouds and no data 29 March 2008
00:37:55 GMT
30 March 2008 00:27:22 GMT
31 March 2008 00:16:59 GMT
1 April 2008 01:47:37 GMT
3 April 2008 01:47:37 GMT 2 April 2008
01:37:03 GMT
( )
≥ ⊗ΔFig. 9. Confutation: as in Fig. 4 for the relatively unperturbed year 2008 (no earthquakes withML>5 occurred in the same area and considered period). Red boxes contours the only images containing at least one pixel with⊗1T(r,t )≥3.
model which perfectly fits with the one proposed by Tra-mutoli et al. (2005) to explain TIR anomalies occurence in relation with abrupt increases of green-houses gases emis-sions.
The relation between TIR anomalies and the occurrence of earthquakes with medium-low magnitude, already found in previous work (e.g. Corrado et al., 2005) seems confirmed
here, in fact TIR anomalies with some persistence in space-time domain are visible near tectonic feature some days be-fore seismic events of medium-low magnitude occurred at in Italy in the same period.
M. Lisi et al.: AVHRR TIR observation during the Abruzzo earthquake 405
Acknowledgements. The authors wish to thank “NEO-DAAS/University of Dundee” for its support in furnishing some of the AVHRR data used for the analysis of 2008 and 2009.
Edited by: P. F. Biagi
Reviewed by: A. Tronin and another anonymous referee
References
Aliano, C., Corrado, R., Filizzola, C., Pergola, N., and Tra-mutoli, V.: Robust Satellite Techniques (RST) For Seismi-cally Active Areas Monitoring: The Case Of 21st May, 2003 Boumerdes/Thenia (Algeria) Earthquake, Proceedings of Mul-titemp 2007, 1–6, doi:10.1109/MULTITEMP.2007.4293042, 2007.
Aliano, C., Corrado, R., Filizzola, C., Genzano, N., Pergola, N., and Tramutoli, V.: TIR Satellite Techniques for monitoring Earth-quake active regions: limits, main achievements and perspec-tives, Ann. Geofis., 51(1), 303–317, 2008a.
Aliano, C., Corrado, R., Filizzola, C., Pergola, N., and Tramutoli, V.: Robust satellite techniques (RST) for the thermal monitoring of earthquake prone areas: the case of Umbria-Marche October, 1997 seismic events, Ann. Geofis., 51, 2/3, 451–459, 2008b. Aliano, C., Corrado, R., Filizzola, C., Genzano, N., Lanorte, V.,
Lisi, M., Martinelli, G., Pergola, N., and Tramutoli, V.: Robust Satellite Techniques for monitoring TIR anomalies in seismo-genic areas, Proceedings of the Second Workshop on the Use of Remote Sensing Techniques for Monitoring Volcanoes and Seis-mogenic Areas, 2008c.
Bonfiglio, A., Macchiato, M., Pergola., N., Pietrapertosa, C., and Tramutoli, V.: AVHRR automated detection of volcanic clouds, Int. J. Remote Sens., 26(1), 9–27, 2005.
Caporali, A.: Time series of coordinates of CGPS stations in the area of the Abruzzo earthquakes, Oral discussion at “The April 2009 L’Aquila earthquake (Italy): first results and future strate-gies”, Chieti, Italy, 4 June 2009.
Corrado, R., Caputo, R., Filizzola, C., Pergola, N., Pietrapertosa, C., and Tramutoli, V.: Seismically active area monitoring by ro-bust TIR satellite techniques: a sensitivity analysis on low mag-nitude earthquakes in Greece and Turkey, Nat. Hazards Earth Syst. Sci., 5, 101–108, 2005,
http://www.nat-hazards-earth-syst-sci.net/5/101/2005/.
Cuomo, V., Lasaponara, R., and Tramutoli, V.: Evaluation of a new satellite-based method for forest fire detection, Int. J. Remote Sens., 22(9), 1799–1826, 2001.
Cuomo, V., Filizzola, C., Pergola, N., Pietrapertosa, C., and Tra-mutoli, V.: A self-sufficient approach for GERB cloudy radiance detection, Atmos. Res., 72(1–4), 39–56, 2004.
Di Bello, G., Filizzola, C., Lacava, T., Marchese, F., Pergola, N., Pietrapertosa, C., Piscitelli, S., Scaffidi, I., and Tramutoli, V.: Robust Satellite Techniques for Volcanic and Seismic Hazards Monitoring, Ann. Geophys., 47(1), 49–64, 2004.
Filizzola, C., Pergola, N., Pietrapertosa, C., and Tramutoli, V.: Ro-bust satellite techniques for seismically active areas monitoring: a sensitivity analysis on September 7, 1999 Athens’s earthquake, Phys. Chem. Earth, 29, 517–527, 2004.
Filizzola, C., Lacava, T., Marchese, F., Pergola, N., Scaffidi, I., and Tramutoli, V.: Assessing RAT (Robust AVHRR Techniques) per-formances for volcanic ash cloud detection and monitoring in
near realtime: The 2002 eruption of Mt. Etna (Italy), Remote Sens. Environ., 107, 440–454, 2007.
Genzano, N., Aliano, C., Filizzola, C., Pergola, N., and Tramutoli, V.: A robust satellite technique for monitoring seismically ac-tive areas: The case of Bhuj-Gujarat earthquake, Tectonophysics, 431, 197–210, 2007.
Genzano, N., Aliano, C., Corrado, R., Filizzola, C., Lisi, M., Pa-ciello, R., Pergola, N., Tsamalashvili, T., and Tramutoli, V.: As-sessing of the Robust Satellite Techniques (RST) in areas with moderate seismicity, in: Multitemp 2009, Fifth International Workshop on the Analysis of Multitemporal Remote Sensing Im-ages, Mistic, Connecticut, USA, 307-314, 28–30 July 2009. Genzano, N., Aliano, C., Corrado, R., Filizzola, C., Lisi, M.,
Mazzeo, G., Paciello, R., Pergola, N., and Tramutoli, V.: RST analysis of MSG-SEVIRI TIR radiances at the time of the Abruzzo 6 April 2009 earthquake, Nat. Hazards Earth Syst. Sci., 9, 2073–2084, 2009,
http://www.nat-hazards-earth-syst-sci.net/9/2073/2009/. Gorny, V. I., Salman, A. G., Tronin, A. A., and Shilin, B. B.: The
Earth outgoing IR radiation as an indicator of seismic activity, P. Acad. Sci. USSR, 301, 67–69, 1988.
Hamza, V. M.: Tectonic leakage of fault bounded aquifers subject to non-isothermal recharge: A mechanism generating thermal pre-cursors to seismic events. Phys. Earth Planet. In., 126, 163–177, 2001.
INGV (Istituto Nazionale di Geofisica e Vulcanologia): The Ital-ian seismic bullettin, available at: http://iside.rm.ingv.it/iside/ standard/index.jsp, 2009.
Lacava, T., Cuomo, V., Di Leo, E. V., Pergola, N., Romano, F., and Tramutoli, V.: Improving soil wetness variations monitoring from passive microwave satellite data: the case of April 2000 Hungary flood, Remote Sens. Environ., 96/2, 135–148, 2005. Lacava, T., Di Leo, E. V., Pergola, N., and Tramutoli, V.:
Space-time soil wetness variations monitoring by a multi-temporal mi-crowave satellite records analysis, Phys. Chem. Earth, 31, 1274– 1283, 2006.
Lacava, T., Filizzola, C., Pergola, N., Sannazzaro, F. and Tramutoli, V. Improving flood monitoring by RAT (Robust AVHRR Tech-nique) approach: the case of April 2000 Hungary flood, Int. J. Remote Sens., in press, 2010.
Lucente, F. P., De Gori, P., Margheriti, L., Piccinini, D., DiBona, M., Chiarabba, C., and Piana Agostinetti, N.: The preparatory phase of the April 6th 2009, Mw 6.3, L’Aquila earthquake: Seis-mological observations, Oral discussion at AGU Fall Meeting 2009, San Francisco, California, USA, 14–18 December 2009. Marchese, F., Pergola, N., and Telesca, L.: Investigating the
tempo-ral fluctuations in satellite Advanced very High Resolution Ra-diometer thermal signals measured in the volcanic area of Etna (Italy), Fluctuations Noise Lett., 6(3), 305–316, 2006.
Martinelli, G., Heinicke, J., and Italiano, F.: Variazioni nel flusso di CO2 osservate nel marzo-aprile 2009 in Italia cen-trale, Atti del GNGTS 2009, Trieste, Italy, available at: http://www2.ogs.trieste.it/gngts/gngts/index.php?option= com content\&task=view&id=71\&Itemid=163, 16–19 November 2009 (in Italian).
406 M. Lisi et al.: AVHRR TIR observation during the Abruzzo earthquake
Ouzounov, D. and Freund, D.: Mid-infrared emission prior to strong earthquakes analyzed by remote sensing data, Adv. Space Res., 33, 268–273, 2004.
Pergola, N., Pietrapertosa, C., Lacava, T., and Tramutoli, V.: Ro-bust satellite techniques for monitoring volcanic eruptions, Ann. Geophys., 44(2), 167–177, 2001.
Pergola, N. and Tramutoli, V.: SANA: Sub-pixel Automatic Navi-gation of AVHRR imagery, Int. J. Remote Sens., 21(12), 2519– 2524, 2000.
Pergola, N. and Tramutoli, V.: Two years of operational use of SANA (sub-pixel automatic navigation of AVHRR) scheme: ac-curacy assessment and validation, Remote Sens. Environ., 82(2), 190–203, 2003.
Pergola, N., Tramutoli, V., and Marchese, F.: Automated detec-tion of thermal features of active volcanoes by means of infrared AVHRR records, Remote Sensing Environ., 93, 311–327, 2004a. Pergola, N., Tramutoli, V., Scaffidi, I., Lacava, T., and Marchese, F.: Improving volcanic ash clouds detection by a robust satellite technique, Remote Sens. Environ., 90(1), 1–22, 2004b.
Pergola, N., Aliano, C., Coviello, I., Filizzola, C., Genzano, N., Lacava, T., Lisi, M., Mazzeo, G., and Tramutoli, V.: Using RST approach and EOS-MODIS radiances for monitoring seismically active regions: a study on the 6 April 2009 Abruzzo earthquake, Nat. Hazards Earth Syst. Sci., 10, 239–249, 2010,
http://www.nat-hazards-earth-syst-sci.net/10/239/2010/. Pietrapertosa, C., Pergola, N., Lanorte, V., and Tramutoli, V.: Self
Adaptive Algorithms for Change Detection: OCA (the One-channel Cloud-detection Approach) an adjustable method for cloudy and clear radiances detection, in: Technical Proceed-ings of the Eleventh International (A) TOVS Study Conference (ITSC-XI), Budapest, 20–26 September 2000, edited by: Le Marshall, J. F. and Jasper, J. D., Bureau of Meteorology Research Centre, Melbourne, 281–291, 2001.
Plastino, W., Povinec, P. P., De Luca, G., Doglioni, C., Nisi, S., Ioannucci, L., Ballata, M., Laubenstein, M., Bella, F., and Coccia, E.: Uranium groundwater anomalies and l’Aquila earthquake, 6th April 2009 (Italy), J. Environ. Radioactiv., doi:10.1016/j.jenvrad.2009.08.009, in press, 2010.
Pulinets, S. A., Boyarchuk, K. A., Hegai, V. V., and Kare-lin, A. V.: Conception and model of seismo-ionosphere-magnetosphere coupling, in: Seismo-Electromagnetics: Lithosphere-Atmosphere-Ionosphere Coupling, edited by: Hayakawa, M. and Molchanov, O. A, Terra Scientific Publishing Co., Tokyo, 353–361, 2002.
Pulinets, S. A., Ouzounov, D., Karelin, A. V., Boyarchuk, K. A., and Pokhmelnykh, L.A.: The physical nature of thermal anomalies observed before strong earthquakes, Phys. Chem. Earth, 31, 143– 153, 2006.
Pulinets, S. A., Biagi, P., Tramutoli, V., Legen’ka, A. D., and Depuev, V. K.: Irpinia earthquake 23 November 1980 – Lesson from Nature reviled by joint data analysis, Ann. Geophys., 50(1), 61–78, 2007.
Qiang, Z. J. and Dian, C. G.: Satellite thermal infrared impending temperature increase precursor of Gonghe earthquake of magni-tude 7.0, Qinghai Province, Geoscience, 6(3), 297–300, 1992. Qiang, Z. J., Xu, X. D., and Dian, C. G.: Thermal infrared anomaly
precursor of impending earthquakes, Chinese Sci. Bull., 36(4), 319–323, 1991.
Qiang, Z. J., Xu, X. D., and Dian, C. G.: Thermal infrared anomaly precursor of impending earthquakes, Pure Appl. Geophys., 149, 159–171, 1997.
Rozhnoi, A., Solovieva, M., Molchanov, O., Schwingenschuh, K., Boudjada, M., Biagi, P. F., Maggipinto, T., Castellana, L., Er-mini, A., and Hayakawa, M.: Anomalies in VLF radio signals prior the Abruzzo earthquake (M=6.3) on 6 April 2009, Nat. Hazards Earth Syst. Sci., 9, 1727–1732, 2009,
http://www.nat-hazards-earth-syst-sci.net/9/1727/2009/. Tramutoli, V.: Robust AVHRR techniques (RAT) for environmental
monitoring: theory and applications, Earth surface remote sens-ing II, in: Proceedsens-ings of SPIE, 3496, 101–113, 1998.
Tramutoli, V.: Robust Satellite Techniques (RST) for natural and environmental hazards monitoring and mitigation: ten years of successful applications, in: ISP MSRS 2005 Conference Pro-ceedings, Beijing, China, 2005.
Tramutoli, V.: Robust Satellite Techniques (RST) for Natural and Environmental Hazards Monitoring and Mitigation: The-ory and Applications, Proceedings of Multitemp 2007, 1–5, doi:10.1109/MULTITEMP.2007.4293057, 2007.
Tramutoli, V., Aliano, C., Corrado, R., Filizzola, C., Genzano, N., Lisi, M., Lanorte, V., Tsamalashvili, T., and Pergola, N.: Abrupt change in greenhouse gases emission rate as a possible genetic model of TIR anomalies observed from satellite in Earthquake active regions, in: Proceedings of 33rd International Symposium on Remote Sensing of Environment (ISRSE33), Stresa, Lago Maggiore, Italy, 4–8 May 2009.
Tramutoli, V., Claps, P., Marella, M., Pergola, N., Pietraper-tosa, C., and Sileo, C.: Hydrological implications of remotely-sensed thermal inertia, in: Remote Sensing and Hydrology 2000, vol. 267, edited by: Owe, M., Brubaker, K., Ritchie, J., and Rango, A., IAHS Publ., 207–211, 2001a.
Tramutoli, V., Di Bello, G., Pergola, N., and Piscitelli, S.: Robust satellite techniques for remote sensing of seismically active ar-eas, Ann. Geophys., 44(2), 295–312, 2001b.
Tramutoli, V., Pergola, N., and Pietrapertosa, C.: Training on NOAAAVHRR of robust satellite techniques for next genera-tion of weather satellites: an applicagenera-tion to the study of space-time evolution of Pinatubo’s stratospheric volcanic cloud over Europe, in: IRS 2000: Current Problems in Atmospheric Radia-tion, edited by: Smith, W. L. and Timofeyev, Yu. M., VA’ Deepak Publishing, Hampton, 36–39, 2001c.
Tramutoli, V., Cuomo, V., Filizzola, C., Pergola, N., and Pietraper-tosa, C.: Assessing the potential of thermal infrared satellite sur-veys for monitoring seismically active areas: The case of Kocaeli (Izmit) earthquake, August 17, 1999, Remote Sens. Environ., 96, 409–426, 2005.
Tronin, A. A.: Satellite thermal survey – a new tool for the study of seismoactive regions, Int. J. Remote Sens., 41(8), 1439–1455, 1996.
Tronin, A. A.: Thermal IR satellite sensor data application for earth-quake research in China, Int. J. Remote Sens., 21(16), 3169– 3177, 2000.