ACPD
12, 7125–7166, 2012Efficacy of sea spray geoengineering
K. J. Pringle et al.
Title Page
Abstract Introduction
Conclusions References
Tables Figures
◭ ◮
◭ ◮
Back Close
Full Screen / Esc
Printer-friendly Version
Interactive Discussion
Discussion
P
a
per
|
Dis
cussion
P
a
per
|
Discussion
P
a
per
|
Discussio
n
P
a
per
Atmos. Chem. Phys. Discuss., 12, 7125–7166, 2012 www.atmos-chem-phys-discuss.net/12/7125/2012/ doi:10.5194/acpd-12-7125-2012
© Author(s) 2012. CC Attribution 3.0 License.
Atmospheric Chemistry and Physics Discussions
This discussion paper is/has been under review for the journal Atmospheric Chemistry and Physics (ACP). Please refer to the corresponding final paper in ACP if available.
A multi-model assessment of the e
ffi
cacy
of sea spray geoengineering
K. J. Pringle1, K. S. Carslaw1, T. Fan1, G.W. Mann1, A. Hill2, P. Stier3, K. Zhang4,5, and H. Tost6
1
Institute for Climate and Atmospheric Science, University of Leeds, UK
2
UK Met Office, Exeter, UK
3
Atmospheric, Oceanic and Planetary Physics, University of Oxford, UK
4
Max Planck Institute for Meteorology, Hamburg, Germany
5
Pacific Northwest National Laboratory, Richland, Washington, USA
6
Johannes-Gutenberg-University Mainz, Germany
Received: 24 February 2012 – Accepted: 1 March 2012 – Published: 9 March 2012
Correspondence to: K. J. Pringle ([email protected])
ACPD
12, 7125–7166, 2012Efficacy of sea spray geoengineering
K. J. Pringle et al.
Title Page
Abstract Introduction
Conclusions References
Tables Figures
◭ ◮
◭ ◮
Back Close
Full Screen / Esc
Printer-friendly Version
Interactive Discussion
Discussion
P
a
per
|
Dis
cussion
P
a
per
|
Discussion
P
a
per
|
Discussio
n
P
a
per
|
Abstract
Artificially increasing the albedo of marine clouds by the mechanical emission of sea spray aerosol has been proposed as a geoengineering technique to slow the warming caused by anthropogenic greenhouse gases. A previous global model study found that only modest increases and sometimes even decreases in cloud drop number (CDN) 5
concentrations would result from plausible emission scenarios. Here we extend that work to examine the conditions under which decreases in CDN can occur, and use three independent global models to quantify maximum achievable CDN changes. We find that decreases in CDN can occur when at least three of the following conditions are
met: the injected particle number is<100 cm−3, the injected diameter is>250–300 nm,
10
the background aerosol loading is large (≥150 cm−3) and the in-cloud updraught
ve-locity is low (<0.2 ms−1). With lower background loadings and/or increased updraught
velocity, significant increases in CDN can be achieved. None of the global models pre-dict a decrease in CDN as a result of geoengineering, although there is considerable
diversity in the calculated efficiency of geoengineering, which arises from the diversity
15
in the simulated background aerosol distributions. All three models show a small
de-pendence of geoengineering efficiency on the injected particle size and the geometric
standard deviation of the injected mode. However, the achievability of significant cloud drop enhancements is strongly dependent on the cloud updraught speed. With an
up-draught speed of 0.1 ms−1 a global mean CDN of 375 cm−3 (previously estimated to
20
cancel the forcing caused by CO2doubling) is achievable in only about 50 % of cloudy
grid boxes irrespective of the amount of aerosol injected. But at 0.2 ms−1 a CDN of
375−3 becomes achievable everywhere. Updraught speeds of less than 0.2 ms−1 are
common in low-level clouds. Thus, a cloud drop concentration of 375 cm−3 cannot be
ACPD
12, 7125–7166, 2012Efficacy of sea spray geoengineering
K. J. Pringle et al.
Title Page
Abstract Introduction
Conclusions References
Tables Figures
◭ ◮
◭ ◮
Back Close
Full Screen / Esc
Printer-friendly Version
Interactive Discussion
Discussion
P
a
per
|
Dis
cussion
P
a
per
|
Discussion
P
a
per
|
Discussio
n
P
a
per
1 Introduction
Several geoengineering options have been proposed to slow the rate of warming due to the anthropogenic increases in greenhouse gases, including the modification of stratospheric aerosol (Crutzen, 2006) and artificially increasing the surface albedo (Ak-bari et al., 2009). Latham and Smith (1990) proposed that climate warming could be 5
slowed by increasing the albedo of marine stratocumulus clouds through the injection of sea spray aerosol. The idea is to build unmanned vessels which could be used to pump large number concentrations of sea spray aerosol into the marine boundary layer (Salter et al., 2008). These particles would then increase the number concentration of cloud droplets in marine stratus clouds, and thus increase the planetary albedo. 10
Most global modelling studies on sea spray geoengineering so far have examined the climate response to a prescribed enhanced cloud droplet number (CDN) concentration (Latham et al., 2008; Jones et al., 2009; Rasch et al., 2009, marine CDN
concen-trations set to 375 or 1000 cm−3 either globally, or in defined regions). These studies
found that the prescribed enhanced CDN concentration was sufficient to offset a
signif-15
icant fraction of the warning due to anthropogenic greenhouse gases, but they did not address the feasibility of attaining the prescribed enhancement in CDN. Marine CDN
concentrations range from approximately 200–300 cm−3 in polluted coastal regions to
≤40 cm−3in remote region (e.g. Bennartz, 2007; Lu et al., 2007). Thus attaining a
ma-rine droplet concentration of 375 cm−3 is equivalent to a percentage increase in CDN
20
of 87 % to over 800 %.
Using a sectional global aerosol microphysics model (GLOMAP-Bin, Spracklen et al., 2005), Korhonen et al. (2010) calculated the percentage change in CDN achieved from the injection of sea spray particles (with the injection rate calculated online as a func-tion of wind speed) in four marine regions with extensive cloud cover. The Korhonen 25
et al. (2010) study was the first to consider geoengineering from emission through to impacts and they found that the calculated emission rates resulted in a regional
ACPD
12, 7125–7166, 2012Efficacy of sea spray geoengineering
K. J. Pringle et al.
Title Page
Abstract Introduction
Conclusions References
Tables Figures
◭ ◮
◭ ◮
Back Close
Full Screen / Esc
Printer-friendly Version
Interactive Discussion
Discussion
P
a
per
|
Dis
cussion
P
a
per
|
Discussion
P
a
per
|
Discussio
n
P
a
per
|
in CDN (because the increased competition for water vapour suppressed the in-cloud maximum supersaturation). This predicted change in CDN is clearly much less than the enhancement in CDN assumed in previous studies. Using the ECHAM5.5-HAM2 model Partanen et al. (2012) used the same injection flux parameterisation as Korho-nen et al. (2010) but found much larger increases in CDN but it is not clear why larger 5
increases in CDN were found as the host model, the activation parameterisation and the assumed updraught velocity all change between the two studies.
While the Korhonen et al. (2010) and Partanen et al. (2012) studies are useful
as-sessments of the efficiency of sea spray geoengineering they are based on a small
number of scenarios which makes it difficult to understand the reasons for a particular
10
CDN response. A smaller than previously expected increase in CDN could occur for either of two reasons:
1. Insufficient enhancement of the aerosol concentration: if the online calculation of the aerosol injection, processing and loss resulted in only a relatively small increase in aerosol number then it follows that only a small change in the CDN 15
concentration would be produced.
2. Insufficient activation of the additional aerosol: if the activation potential of the
cloud is not sufficient to activate the additional aerosol then a large increase in
CDN be produced, even if the enhancement of the aerosol number concentration is very large.
20
Understanding the limiting processes in sea spray geoengineering is important as
in-sufficient enhancement of the aerosol number concentration could potentially be solved
by technological advances. However, if it is the case that the additional aerosol parti-cles are not activating, then there is an upper limit to the maximum enhancement of CDN possible, and that limit is lower than has previously been assumed. In this study 25
we explore which of these processes dominates in order to understand the efficiency
ACPD
12, 7125–7166, 2012Efficacy of sea spray geoengineering
K. J. Pringle et al.
Title Page
Abstract Introduction
Conclusions References
Tables Figures
◭ ◮
◭ ◮
Back Close
Full Screen / Esc
Printer-friendly Version
Interactive Discussion
Discussion
P
a
per
|
Dis
cussion
P
a
per
|
Discussion
P
a
per
|
Discussio
n
P
a
per
The ability of the injected aerosol to activate depends on three factors: (i) the proper-ties of the injected aerosol, (ii) the concentration of background aerosol and (iii) meteo-rological factors, especially the updraught velocity. Using a cloud parcel model, Bower
et al. (2006) examined the activation efficiency of advertently introduced aerosol
parti-cles assuming a range of different background aerosol concentrations, updraught
ve-5
locities, injection diameters and injection number concentrations. They found the back-ground aerosol number concentration to be of most importance, with low backback-ground aerosol number concentrations producing large enhancements in CDN. The calculated enhancement in CDN was found to be quite insensitive to the size of the emitted parti-cles, suggesting that it may not be essential to select a particular emission size. Bower 10
et al. (2006) also found that increasing the assumed in-cloud updraught velocity from
0.2 to 1.0 ms−1 resulted in only a small change in
∆CDN as the CDN in both the
geo-engineered and non-geogeo-engineered case increased. Wang et al. (2011) used a cloud resolving model to investigate the response of the cloud to sea-spray
geoengineer-ing and found geoengineergeoengineer-ing to be inefficient when the cloud is strongly precipitating
15
or heavily polluted but efficient under clean and non/weakly precipitating conditions.
Alterskjær et al. (2011) used CDN concentrations measured from MODIS to identify
low background CDN regions to target effective geoengineering regions and found that
south of 30◦S and north of 30◦N were particularly susceptible to cloud seeding. They
also found that although increases in CDN occurred (with an injection of 10−9kg m2s−1
20
of sea salt with a modal radius of 0.13 µm) a uniform concentration of 375 cm−3 was
not reached.
As the efficiency of sea spray geoengineering is sensitive to the background aerosol
distribution it is likely that the simulated efficiency will depend on the model used. In
a global aerosol model the simulated background marine distribution is a function of 25
the sea spray emissions flux, outflow of aerosol from continental regions, microphys-ical processing and wet and dry deposition. All of these processes are uncertain and treatment varies between models (Textor et al., 2006). The diversity in model
ACPD
12, 7125–7166, 2012Efficacy of sea spray geoengineering
K. J. Pringle et al.
Title Page
Abstract Introduction
Conclusions References
Tables Figures
◭ ◮
◭ ◮
Back Close
Full Screen / Esc
Printer-friendly Version
Interactive Discussion
Discussion
P
a
per
|
Dis
cussion
P
a
per
|
Discussion
P
a
per
|
Discussio
n
P
a
per
|
efficiency of the sea-spray geoengineering, but this uncertainty has not yet been
ex-amined.
The aim of this paper is to explore the change in CDN that arises from the injection of
sea-spray aerosol under a range of different conditions. This information is important as
it can be used to understand if and how greater increases in CDN can be achieved. Un-5
derstanding the limiting factors also helps to quantify the maximum possible increase in CDN which is useful for studies that calculate the potential radiative cooling arising from sea-spray geoengineering.
2 Methods
We show results from multiple simulations of a microphysically based aerosol activation 10
parametrisation (Nenes and Seinfeld, 2003; Fountoukis and Nenes, 2005; Barahona et al., 2010), hereafter referred to as BN10. The scheme has been shown to compare well against both cloud parcel calculations and in-situ observations (Fountoukis and Nenes, 2005; Meskhidze et al., 2005) and has been used extensively in global model studies (e.g. Chen and Penner, 2005; Pringle et al., 2009; Merikanto et al., 2010). The 15
BN10 parametrisation is based on the framework of an ascending cloud parcel; the parametrisation calculates the maximum supersaturation (which controls CDN) from the balance of water vapour availability from cooling and the depletion from the conden-sational growth of activated droplets. In this paper we apply the BN10 parametrisation both to a “typical” marine aerosol distribution (Sect. 3) and to output from three global 20
aerosol models (Sect. 4): GLOMAP-MODE (Mann et al., 2010), the ECHAM-MESSy Atmospheric Chemistry model (EMAC, J ¨ockel et al., 2006; Pringle et al., 2010; Pozzer et al., 2012) and ECHAM-HAM (Stier et al., 2005).
The three models considered are fundamentally similar in that they all treat the aerosol size distribution using 7 lognormal modes (following Vignati et al., 2004), but 25
they differ in their treatment of aerosol emission and deposition, two key factors aff
ACPD
12, 7125–7166, 2012Efficacy of sea spray geoengineering
K. J. Pringle et al.
Title Page
Abstract Introduction
Conclusions References
Tables Figures
◭ ◮
◭ ◮
Back Close
Full Screen / Esc
Printer-friendly Version
Interactive Discussion
Discussion
P
a
per
|
Dis
cussion
P
a
per
|
Discussion
P
a
per
|
Discussio
n
P
a
per
used. The GLOMAP microphysics routines were developed independently of the other two models (Mann et al., 2010; Spracklen et al., 2005), however ECHAM-HAM and EMAC share the same core microphysics routines, with the aerosol scheme in EMAC (GMXe) being a development of the M7 microphysics module in ECHAM-HAM (the GMXe code was adapted from the M7 to include nitrate aerosol, Pringle et al., 2010). 5
The model simulations are provided by the AeroCom aerosol model inter-comparison project (http://dataipsl.ipsl.jussieu.fr/AEROCOM/) and are representative of the year 2006. Two versions of ECHAM-HAM were submitted to the AeroCom Phase II Inter-comparison, one representative of the setup used in Stier et al. (2005, HAM1) and another from Zhang et al. (2012, HAM2). In this study we use the HAM1 results as 10
the treatment of the aerosol composition in this model version is more comparable to GLOMAP-MODE and EMAC and the model is widely used. In all simulations, the
calculation of global fields of CDN is done offline and the BN10 activation calculation
is used to calculate CDN assuming a prescribed updraught velocity in every model gridbox. We do not restrict calculation of CDN to gridboxes that contain clouds; to 15
achieve a global distribution a theoretical CDN is calculated in every model gridbox. The BN10 scheme is an activation parametrisation and does not allow for the calculation of in-cloud collision/coalescence and thus will tend to overestimate CDN concentrations compared to in situ observations (methodology is similar to that of Pringle et al., 2009; Merikanto et al., 2010; Korhonen et al., 2010; Karydis et al., 2011).
20
3 Exploring parameter space in a 0-D model
To understand the response of CDN to a range of injection scenarios, updraught ve-locities and background aerosol number concentrations the BN10 parametrisation was first run as a stand alone box model, or 0-D, version. The conditions are summarised in Tables 1 and 2 and described below. The aim of this work is to identify the optimum 25
ACPD
12, 7125–7166, 2012Efficacy of sea spray geoengineering
K. J. Pringle et al.
Title Page
Abstract Introduction
Conclusions References
Tables Figures
◭ ◮
◭ ◮
Back Close
Full Screen / Esc
Printer-friendly Version
Interactive Discussion
Discussion
P
a
per
|
Dis
cussion
P
a
per
|
Discussion
P
a
per
|
Discussio
n
P
a
per
|
3.1 Conditions examined
3.1.1 Injected aerosol properties
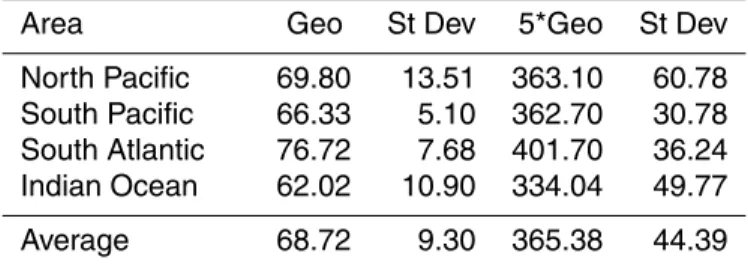
Using a wind speed dependent injection parametrisation based on literature estimates
of the efficiency of the proposed vessels, Korhonen et al. (2010) simulated the injection
of sea spray aerosol online in a global aerosol model in four marine regions. In the 5
baseline simulation they calculated an annual mean increase across the four regions
of 68.72±13.51 cm−3 at 1 km altitude. They also considered a sensitivity scenario in
which the emission flux was increased by a factor of 5, leading to an increase in aerosol
number of 365.38±44.39 cm−3 (H. Korhonen personal communication, 2011, see
Ta-ble 2), this implies that the enhancement in aerosol number scales almost linearly with 10
the mass flux. Throughout this paper we use the simulated increase in aerosol number
from Korhonen et al. (2010) as an estimate of 1×and 5×geoengineering scenarios. In
the 0D-section we consider scenarios in which the additional number increases
step-wise from 0 to 500 cm−3, the Korhonen et al. (2010) estimates are at the lower and
middle region of this parameter space. 15
In all simulations shown in this work, the additional aerosol is assumed to simply add to the background aerosol distribution; we do not simulate the change in the back-ground aerosol distribution due to the presence of additional aerosol. This is a simplifi-cation as the additional aerosol may interact with the background aerosol e.g. through coagulation, but it is justified on the basis that Korhonen et al. (2010) found the im-20
pact of the additional aerosol on the background aerosol distribution to be small as coagulation rates are slow at these sizes.
3.1.2 Background aerosol concentration
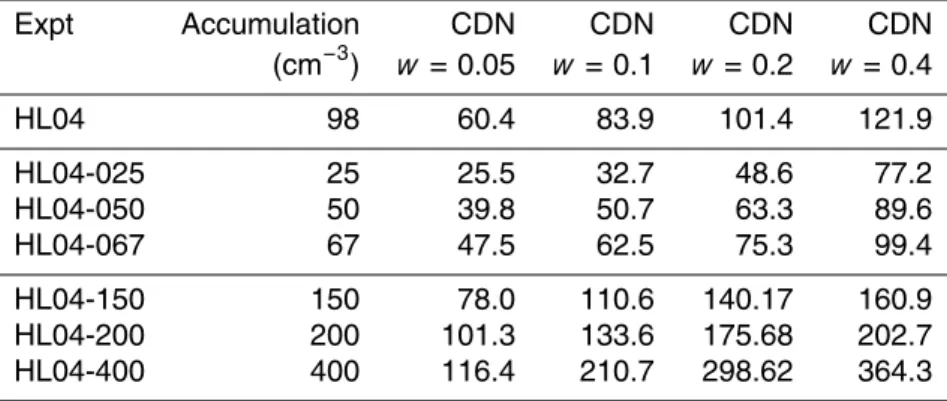
To explore the sensitivity to the background aerosol loading we assume a baseline aerosol size distribution taken from the Heintzenberg and Larssen (2004, HL04) re-25
ACPD
12, 7125–7166, 2012Efficacy of sea spray geoengineering
K. J. Pringle et al.
Title Page
Abstract Introduction
Conclusions References
Tables Figures
◭ ◮
◭ ◮
Back Close
Full Screen / Esc
Printer-friendly Version
Interactive Discussion
Discussion
P
a
per
|
Dis
cussion
P
a
per
|
Discussion
P
a
per
|
Discussio
n
P
a
per
standard deviation is 1.4 for all modes, the mode diameters are 43, 149 and 487 nm
and the number concentrations are 146, 98 and 4 cm−3. A series of initial sensitivity
studies was performed and we found that at the updraughts considered the number concentration of aerosol in the accumulation mode was the most important feature of
the background aerosol size distribution in affecting the sensitivity to the geoengineered
5
aerosol. Simulations are therefore preformed assuming a range of accumulation mode number loadings (see Table 1). At larger updraughts, the CDN becomes increasingly sensitive to Aitken mode particles as well, but in marine stratocumulus updraughts
the effect of the accumulation mode dominates. For simplicity we take an
accumula-tion number concentraaccumula-tion of 100 cm−3, a slight increase on the 97 cm−3presented by
10
HL04 (the concentrations of the other modes are from HL04).
3.1.3 In-cloud updraught velocity
Updraught velocity varies both between and within marine stratocumulus cloud decks (e.g. Hawkins et al., 2008; Bretherton et al., 2010; Rahn and Garreaud, 2010). Mea-surements show a distribution of updraughts that peaks at (or near) zero, but the vari-15
ance and the skewness of the distribution varies. Vertical velocity is typically smaller at cloud base but increases with height until reaching a maximum around (or above) the centre of the cloud (Lu and Seinfeld, 2005, 2006; Hill et al., 2009). The velocity in the lower levels of the cloud is of most interest for this work as it is mainly these values that control the cloud droplet number concentration: activation starts close to cloud base 20
and once a spectrum of cloud droplets has been formed additional condensation will tend to grow cloud droplets rather than activate additional aerosol.
Marine stratocumulus updraughts are generally quite low, for example Guo et al. (2008) present PDFs of vertical velocity in marine stratocumulus clouds measured dur-ing the Marine Stratus/Stratocumulus Experiment (MASE), they found that updraughts 25
were always<0.2 ms−1 at the middle and base of the cloud, but found slightly higher
updraughts close to the cloud top. Guibert et al. (2003) reported an average updraught
ACPD
12, 7125–7166, 2012Efficacy of sea spray geoengineering
K. J. Pringle et al.
Title Page
Abstract Introduction
Conclusions References
Tables Figures
◭ ◮
◭ ◮
Back Close
Full Screen / Esc
Printer-friendly Version
Interactive Discussion
Discussion
P
a
per
|
Dis
cussion
P
a
per
|
Discussion
P
a
per
|
Discussio
n
P
a
per
|
CLOUDYCOLUMN experiment in stratocumulus clouds in the eastern Atlantic Ocean.
Lu et al. (2007) found an average updraught velocity of 0.18 ms−1in marine
stratocumu-lus clouds offthe coast of California, USA. Larger in-cloud updraught velocities were
found in the Southeastern Pacific during the VOCALS campaign (Bretherton et al.,
2010,σ=0.4–0.6 ms−2).
5
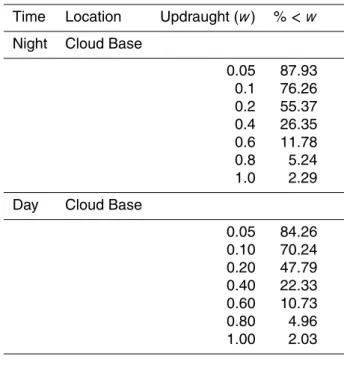
Table 3 shows frequency statistics for the updraught simulated in the UK Met Of-fice Large-Eddy Simulation Model (LEM, 3-D) for the ASTEX GCSS Sc-Cu transition case (Bretherton et al., 1999) (A. Lock, personal communication, 2011). This model simulation represents a range of marine stratocumulus updraught velocities including (during the daytime) some transition from stratocumulus into cumulus clouds, which 10
have higher updraught. In this case 27 % of updraughts were<0.1 ms−1, 49 % were
<0.2 ms−1 and 75 % of updraughts were <0.4 ms−1. In this work we adopt 0.4 ms−1
an upper limit for consideration but note that larger updraughts can occur in marine stratocumulus clouds, especially when they start to transition into cumulus clouds.
3.2 Results of the 0-D simulations
15
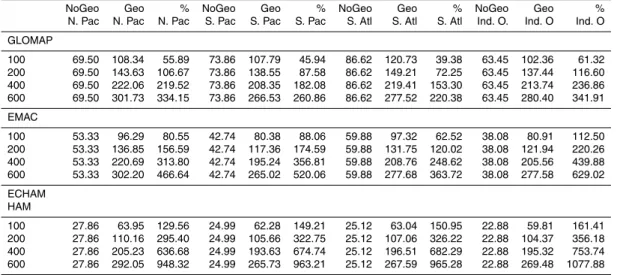
Figure 1 shows the percentage change in CDN arising from the injection of a single sea spray aerosol mode with an geometric standard deviation of 1.1, assuming the standard background aerosol distribution from Heintzenberg and Larssen (2004) and
an in-cloud updraught velocity of 0.1 ms−1. We present the percentage change in CDN
because in the Twomey (1977, 1991) framework, the change in cloud albedo is related 20
to the percentage (not absolute) change in CDN. The shape of the distribution in Fig. 1 helps identify optimum conditions for geoengineering, for example if the number of
injected particles is fixed, e.g. at 250 cm−3then injecting at 150 nm diameter produces
the largest increase in CDN. If the injection size is increased away from this optimum diameter (i.e. the injection number is held constant but the mass injected increased) 25
then geoengineering becomes less effective (smaller change in CDN) as the large
particles are an effective sink for condensation and the maximum supersaturation is
ACPD
12, 7125–7166, 2012Efficacy of sea spray geoengineering
K. J. Pringle et al.
Title Page
Abstract Introduction
Conclusions References
Tables Figures
◭ ◮
◭ ◮
Back Close
Full Screen / Esc
Printer-friendly Version
Interactive Discussion
Discussion
P
a
per
|
Dis
cussion
P
a
per
|
Discussion
P
a
per
|
Discussio
n
P
a
per
a fraction of the narrow mode becomes too small to activate and the increase in CDN is reduced. In the scenario considered in Fig. 1 the advertently introduced aerosol results
in an increase in CDN providing the injected particle diameter is >90 nm (below this
size the increase in CDN is ≤10 %) and the injection diameter at which the greatest
enhancement in CDN occurs ranges from 100–200 nm depending on the number of 5
advertently introduced particles.
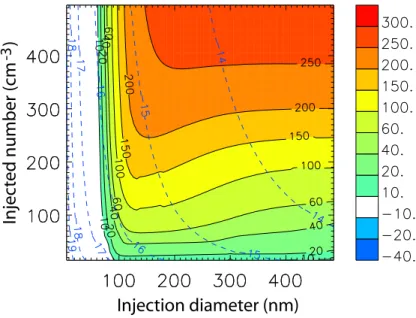
Figure 1 shows that under this scenario of clean marine background aerosol loading large enhancements in CDN can be readily achieved, Fig. 2 extends this analysis to other background aerosol loadings and updraughts. Each panel is a repeat of the plot
in Fig. 1, but calculated assuming different in-cloud updraught velocities and increased
10
background aerosol number concentration. Independent of the in-cloud updraught
ve-locity, geoengineering becomes less efficient when more accumulation mode particles
exist in the background distribution (e.g. when the sea spray flux is large, or when close to pollution sources). If the background aerosol loading is reduced to loadings lower than that presented by Heintzenberg and Larssen (2004) then geoengineering 15
becomes more efficient and very little dependence on injection size is apparent (not
shown). This dependence on background aerosol loading can be understood by con-sidering the degree of competition for water vapour; when the background aerosol load-ing is large there is increased competition for water vapour and thus a reduced fraction of the advertently introduced aerosol can activate to form cloud droplets, resulting in a 20
reduced efficiency of the geoengineering. The dependence of the percentage change
in CDN on the injected diameter is more complex; injecting at a diameter of 150 to 300 nm results in the largest increases in CDN, but the exact value within this range depends on the conditions. The value of 260 nm used in previous studies was well
cho-sen as an efficient size, but greater enhancements in CDN can sometimes be achieved
25
by injecting at a diameter of 150–200 nm (discussion continued in Sect. 4.0.1).
Figure 2 also shows the importance of the in-cloud updraught velocity for effective
geoengineering. When updraught is 0.4 ms−1 the advertently introduced aerosol
ACPD
12, 7125–7166, 2012Efficacy of sea spray geoengineering
K. J. Pringle et al.
Title Page
Abstract Introduction
Conclusions References
Tables Figures
◭ ◮
◭ ◮
Back Close
Full Screen / Esc
Printer-friendly Version
Interactive Discussion
Discussion
P
a
per
|
Dis
cussion
P
a
per
|
Discussion
P
a
per
|
Discussio
n
P
a
per
|
is low (≤0.2 ms−1), the competition between the activation of the background and
ad-vertently introduced aerosol becomes important and the percentage increase in CDN achieved remains small. It is important to note that separately low updraught or high background loading may not prohibit the activation of the additional aerosol (although
they do reduce the efficiency), but these factors combined result in inefficient
geoengi-5
neering. From Fig. 2, we find that a decrease in CDN occurs when at least three of the following conditions are met:
1. The injected particle number is low (≤150 cm−3).
2. Injected particle diameter is large (≥250–300 nm).
3. The background accumulation mode number loading is large (≥150 cm−3).
10
4. The in-cloud updraught velocity is low (≤0.2 ms−1).
Korhonen et al. (2010) found that injecting approximately 70 cm−3particles of 260 nm
in diameter could result in a net decrease in CDN over large spatial scales, the above analysis confirms that reductions in CDN can occur in this region of the parameter space. For the conditions examined, decreases in CDN can generally be avoided by 15
injecting more particles and injecting at a smaller diameter.
4 Efficiency of sea spray geoengineering: results from multiple models
In this section we take output from three global aerosol models: GLOMAP-MODE (Mann et al., 2010), EMAC (Pringle et al., 2010) and ECHAM-HAM (Stier et al., 2005) and calculate global fields of CDN predicted from each model with and without sea 20
spray geoengineering. The model simulations are from the AeroCom model inter-comparison project (http://dataipsl.ipsl.jussieu.fr/AEROCOM/) which provides monthly mean output representative of the year 2006. The calculation of aerosol activation
ACPD
12, 7125–7166, 2012Efficacy of sea spray geoengineering
K. J. Pringle et al.
Title Page
Abstract Introduction
Conclusions References
Tables Figures
◭ ◮
◭ ◮
Back Close
Full Screen / Esc
Printer-friendly Version
Interactive Discussion
Discussion
P
a
per
|
Dis
cussion
P
a
per
|
Discussion
P
a
per
|
Discussio
n
P
a
per
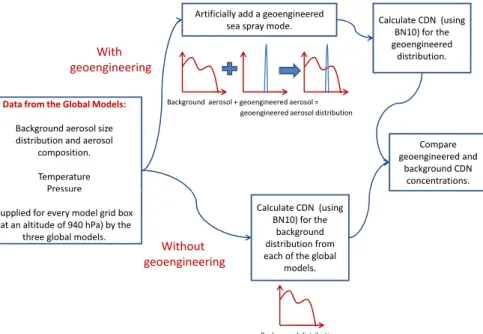
added. Geoengineered aerosol is added uniformly across a gridbox and is assumed
not to affect the background aerosol distribution. Fields of CDN are calculated at an
average altitude of 940 hPa, representative of cloud base. A schematic of the method-ology is shown in Fig. 3. In these simulation a Gaussian PDF of updraughts is assumed
(σ=0.25, mean=0.0): CDN is calculated for multiple (10) updraughts within this PDF
5
then a mean CDN is calculated from a probability weighted mean of these values, this is a similar approach to Korhonen et al. (2010). Also following Korhonen et al. (2010), aerosol is injected with a diameter of 260 nm. The three aerosol models are similar in that they treat the aerosol size distribution as the supposition of lognormal modes and they treat sulfate, mineral dust, black carbon, organic carbon and sea spray (and 10
nitrate treated by EMAC only), but they differ in the treatment of sea spray emission
and aerosol wet and dry deposition. All models used the same criteria to distinguish
between the four size categories: nucleation (<5 nm), Aitken (5–50 nm), accumulation
(50–500 nm) and coarse (>500 nm) dry radius (see Table 4 for a summary of the
mod-els). In the figures shown in this paper, we calculate the total number of aerosol in a 15
size category for each model by integrating the number concentration of hydrophilic aerosol between the mode boundaries (e.g. for Aitken we count the total number of
aerosol particles with dry radius (Rp) 5< Rp<50 nm).
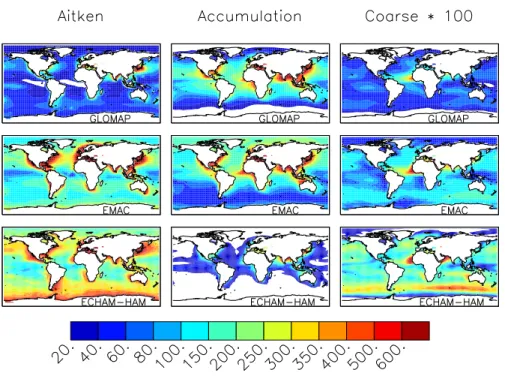
Figure 4 shows the annual mean simulated marine aerosol number concentration in the Aitken, accumulation and coarse hydrophilic modes in the three models. There 20
is considerable diversity in the simulated number concentrations. ECHAM-HAM and
EMAC both predict Aitken mode number concentrations of>200 cm−3 over most
ma-rine regions but GLOMAP predicts lower values (40–200 cm−3). The difference in
Aitken mode number is especially pronounced in remote regions and in the Southern Ocean where ECHAM-HAM (and to a lesser extent EMAC) show high Aitken mode 25
number concentrations near the Antarctic coast. Conversely, GLOMAP and EMAC have larger accumulation mode number concentrations than ECHAM-HAM with
con-centrations of >100 cm−3 over most of the Northern Hemisphere compared to the
ACPD
12, 7125–7166, 2012Efficacy of sea spray geoengineering
K. J. Pringle et al.
Title Page
Abstract Introduction
Conclusions References
Tables Figures
◭ ◮
◭ ◮
Back Close
Full Screen / Esc
Printer-friendly Version
Interactive Discussion
Discussion
P
a
per
|
Dis
cussion
P
a
per
|
Discussion
P
a
per
|
Discussio
n
P
a
per
|
mode particles than the other models. It should be noted that the difference in Aitken
and accumulation mode number concentrations between the three models is less in the surface layer where more comprehensive measurements allow better model evaluation than at the low cloud base altitude considered here.
The simulated fields of CDN calculated offline from the model output are shown in
5
Fig. 5, left column. As we do not treat collision/coalescence this field actually represents the number of aerosol that would activate in the model if that updraught occurred rather than the absolute number of droplets that would be observed by measurements, but as the number of activated aerosol drives the in-cloud droplet concentration it is a useful metric for considering the response of the cloud to a perturbation. In this text we use 10
the term CDN for the number of aerosol activated.
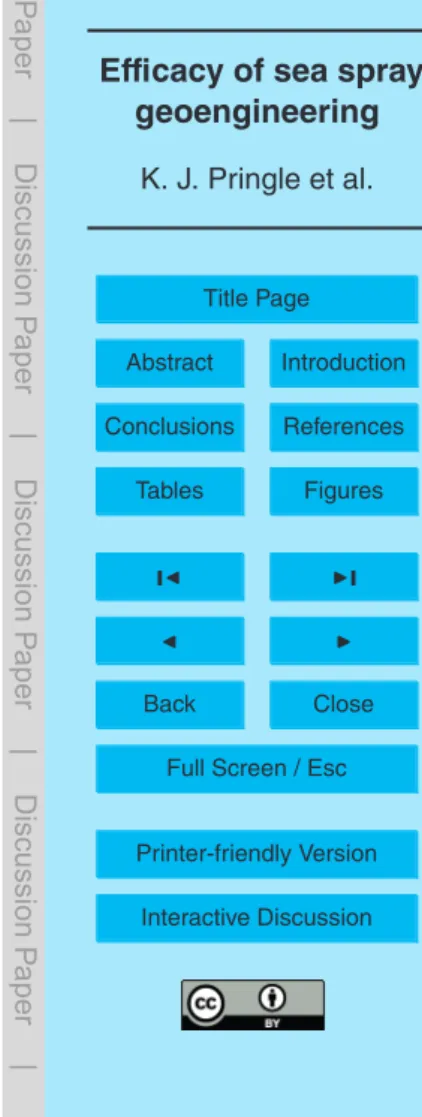
The GLOMAP and EMAC models predict similar global mean marine CDN centrations (Table 5), but ECHAM-HAM predicts consistently lower values as a con-sequence of the lower accumulation mode concentrations in ECHAM-HAM. The dis-tribution of CDN also varies significantly between the three models. GLOMAP sim-15
ulates the strongest contrast in CDN between the polluted continental outflow
re-gions (CDN>80 cm−3), which extend a significant distance over the ocean, and very
low CDN concentrations (10–25 cm−3) in the Arctic and the remote Southern Ocean.
EMAC predicts a much more homogeneous distribution, with CDN concentrations of
60–100 cm−3 over much of the Northern Hemisphere, including much of the Arctic.
20
ECHAM-HAM shows a much lower CDN concentration in continental outflow regions than the other models, but simulates a slightly larger Southern Ocean CDN
concentra-tion than the other models (30–50 cm−3).
During the VOCALS Regional Experiment in the Southeast Pacific Bretherton et al.
(2010) measured CDN concentrations of >200 cm−3 close to the western coast of
25
South America, with concentrations dropping to<100 cm−3 west of 80◦W. Compared
to this, ECHAM-HAM underestimates the CDN concentration close to coast with no
values>100 cm−3but it captures the low CDN concentrations further from the coast.
ACPD
12, 7125–7166, 2012Efficacy of sea spray geoengineering
K. J. Pringle et al.
Title Page
Abstract Introduction
Conclusions References
Tables Figures
◭ ◮
◭ ◮
Back Close
Full Screen / Esc
Printer-friendly Version
Interactive Discussion
Discussion
P
a
per
|
Dis
cussion
P
a
per
|
Discussion
P
a
per
|
Discussio
n
P
a
per
but overestimates the region of high CDN; the high values extend further from the coast than in the observations. Bennartz (2007) presented CDN fields from MODIS
and found a South Pacific mean CDN concentration of 40 cm−3which is broadly in line
with ECHAM-HAM, but a lower value than the other two models. ECHAM-HAM
un-derestimates CDN in the North Atlantic compared to Bennartz (2007, 89 cm−3) as they
5
never simulate concentrations>50 cm−3but EMAC and GLOMAP perform better in this
region (CDN=70–90 cm−3). EMAC and GLOMAP both overestimate North Pacific
con-centrations (64 cm−3) but ECHAM-HAM tends to underestimate CDN concentrations in
this region. In summary all models perform reasonably compared to large-scale obser-vations but GLOMAP and EMAC tend to overestimate polluted marine concentrations 10
and ECHAM-HAM tends to underestimate in these regions.
The central and right hand columns of Fig. 5 show the percentage increase in CDN
caused by the addition of 70 (middle column) and 350 (right column) particles cm−3to
every marine gridbox in each of the three models. With the addition of 70 particles cm−3
(1×geo scenario) ECHAM-HAM predicts that nearly all regions experience an
in-15
crease in CDN of 110–200 %, but EMAC and GLOMAP suggest that changes of 110– 200 % are only attainable over Southern Ocean (and the Arctic in GLOMAP only). In all models the pattern of the percentage change broadly reflects the inverse of the uperturbed CDN fields, with low initial CDN concentrations producing large percent-age changes. This is partly due to the fact that low initial CDN concentrations mean 20
that there is less competition for aerosol water and therefore more activation of the additional aerosol, and partly because the same absolute change will result in a larger percentage change if the initial value is smaller.
With the addition of 350 particles cm−3(5
×geo scenario) the models all predict that
considerable increases in CDN are possible over large regions. GLOMAP and EMAC 25
both predict increases in CDN of 300–400 % in much of the Southern Ocean, and
>110 % in much of the Tropics and Northern Hemisphere. ECHAM-HAM predicts a
more uniform distribution with changes of at least>400 % in all regions with changes of
ACPD
12, 7125–7166, 2012Efficacy of sea spray geoengineering
K. J. Pringle et al.
Title Page
Abstract Introduction
Conclusions References
Tables Figures
◭ ◮
◭ ◮
Back Close
Full Screen / Esc
Printer-friendly Version
Interactive Discussion
Discussion
P
a
per
|
Dis
cussion
P
a
per
|
Discussion
P
a
per
|
Discussio
n
P
a
per
|
from continental outflow can decrease the efficiency of the geoengingeering to<110 %,
but in ECHAM-HAM this occurs only in the 1×geo scenario and in quite a small region
(the west of Africa and in coastal regions south of Asia and Indonesia). In GLOMAP and EMAC there are more regions which experience a small increase in CDN, with coastal regions near N. and S. America and East of China also experiencing an increase in 5
CDN of<110 % even in the 5×geoengineering scenario.
The simulated changes within four previously identified target geoengineering re-gions (marked as rectangles in Fig. 5) are summarised in Table 6 and can be compared to those predicted by Korhonen et al. (2010) with the GLOMAP-Bin model. Korhonen
et al. (2010) found a net decrease in CDN in the N. Pacific (−2 %) in the 1×geo
sce-10
nario, which none of the models considered here recreate. The three models consid-ered in this work also predict larger changes than found by Korhonen et al. (2010) in the
other regions, with all regions experiencing a change of at least 55 % (cf.≤20 % from
Korhonen et al., 2010) with larger changes occuring when more particles are injected.
The offline calculation of geoengineering used here is simpler than the windspeed
de-15
pendent online calculation of Korhonen et al. (2010) but as the same net increase in aerosol number is used and the same updraught velocity is assumed the studies are
broadly comparable. Differences in the simulated change in CDN are likely to arise
from differences in the simulated background aerosol distribution (GLOMAP-Mode and
GLOMAP-Bin simulations are compared in detail in Mann et al., 2012). Another po-20
tential reason for the discrepancy is that Korhonen et al. (2010) used the activation parameterisation of Nenes and Seinfeld (2003) without the additional treatment of gi-ant CCN of Barahona et al. (2010), which is used in this work (BN10). It is possible that the supression of supersaturation responsible for the small increase in CDN in Korhonen et al. (2010) may have been overestimated without this treatment.
25
4.0.1 Exploring the dependence on injection diameter and width
In the 0-D simulations a dependency on the efficiency of geoengineering on the
ACPD
12, 7125–7166, 2012Efficacy of sea spray geoengineering
K. J. Pringle et al.
Title Page
Abstract Introduction
Conclusions References
Tables Figures
◭ ◮
◭ ◮
Back Close
Full Screen / Esc
Printer-friendly Version
Interactive Discussion
Discussion
P
a
per
|
Dis
cussion
P
a
per
|
Discussion
P
a
per
|
Discussio
n
P
a
per
models Fig. 6 shows the regional median geoengineered CDN concentration in the four target regions when a range of injection diameters (100–360 nm) is used. In this figure
we fix the number of injected particles (at 300 particles cm−3) and alter the diameter of
injection. This has the effect of increasing the mass of aerosol emitted as the diameter
is increased. 5
None of the models show a strong dependence of CDN on the injection diameter, but
all models show that an injection diameter of 100 nm is the least efficient as particles of
this size are too small to activate when supersaturations are low. An injection diameter
of 160 nm is found to be the most efficient in all models and in all regions. Increasing the
injection diameter above 160 nm reduces CDN, despite the increase in the total mass 10
of the injected particles. The importance of injection size is model dependent with GLOMAP and EMAC showing moderate sensitivity (reduction in CDN of 13 %, d360
compared to d160 nm) but ECHAM-HAM a lower sensitivity (3 %). The most efficient
diameter for injection depends on the background aerosol distribution (Fig. 2) thus the
weak dependence is largely due to averaging effects as in some locations an increase
15
in injection diameter increases CDN and in others a decrease occurs, the net effect is
therefore small. The sensitivity of the CDN to the choice of aerosol model is as large as the sensitivity to the injection size within each individual model (for d160 nm and above).
The dependence on injection diameter is different to that of Partanen et al. (2012)
20
who investigated the sensitivity to injection diameter by holding the mass of aerosol
injected constant, they found an injection diameter of 100 nm to be more efficient than
an injection diameter of 260 nm. As Partanen et al. (2012) held the injected mass con-stant the calculated sensitivity to injection size is dominated by the fact that a reduction in particle size results in an increase in the number of particles injected. Here we find 25
that for a constant number there is some additional sensitivity to injected size.
In the simulations so far we have considered the injection of a very narrow aerosol
mode (σ=1.1), injection of a narrow mode is technically challenging thus in Fig. 7 we
ACPD
12, 7125–7166, 2012Efficacy of sea spray geoengineering
K. J. Pringle et al.
Title Page
Abstract Introduction
Conclusions References
Tables Figures
◭ ◮
◭ ◮
Back Close
Full Screen / Esc
Printer-friendly Version
Interactive Discussion
Discussion
P
a
per
|
Dis
cussion
P
a
per
|
Discussion
P
a
per
|
Discussio
n
P
a
per
|
predict a similar reduction in the geoengineered CDN concentration as the geometric
standard deviation of the injected mode is increased, but the effect is small: the
multi-modal mean reduction in geoengineered CDN moving fromσ =1.1 toσ=1.6 is 10 %,
which is small compared to the difference between models.
4.0.2 Exploring the maximum possible increase in CDN
5
Although the 350 particles cm−3(5×geo) scenario is already a large perturbation to the
system, it may be possible to increase the number of advertently introduced aerosol fur-ther. To explore this possibility Fig. 8 shows the absolute CDN concentration in the three models in a range of increasingly intensive geoengineering scenarios. We present re-sults in the four target regions previously identified as being suitable for geoengineering 10
due to their extensive cloud cover (Salter et al., 2008, marked on Fig. 5) and
assum-ing four updraught velocities (0.05, 0.10, 0.20, 0.40 ms−1). In the presence of intensive
geoengineering (increases of>400 particles cm−3) the absolute CDN simulated by the
three models is very similar as the advertently introduced particle number dominates over background number concentrations. In all three models increasing the number of 15
advertently introduced aerosol results in an increase in the CDN concentration with the overall shape of the aerosol number/CDN relationship similar to that found in previous measurement (Martin et al., 1994; Ramanathan et al., 2001) and model (Jones et al., 2001; Pringle et al., 2009) studies.
The extent of the increase in CDN is influenced by the in-cloud updraught velocity. At 20
low updraughts (≤0.1 ms−1) the CDN increases with the number of particles injected up
to 400–600 cm−3, above this injection number updraught as a source of saturation
be-comes the limiting factor and the scope for further increases in CDN bebe-comes limited.
With an in-cloud updraught velocity of 0.2 ms−1this limited regime does not appear until
≥800 cm−3are injected. A similar “updraught-limited” regime was identified by Reutter
25
et al. (2009) who found that in pyro-convective conditions activation became updraught limited when the ratio of the updraught velocity to the aerosol number concentration
ACPD
12, 7125–7166, 2012Efficacy of sea spray geoengineering
K. J. Pringle et al.
Title Page
Abstract Introduction
Conclusions References
Tables Figures
◭ ◮
◭ ◮
Back Close
Full Screen / Esc
Printer-friendly Version
Interactive Discussion
Discussion
P
a
per
|
Dis
cussion
P
a
per
|
Discussion
P
a
per
|
Discussio
n
P
a
per
very intensive geoengineering scenarios and limits the maximum possible increase in CDN.
To avoid the uncertainty of calculating fields of background and geoengineered CDN, some previous studies have assumed that a geoengineered CDN concentration of 375
(or 1000 cm−3) is uniformly possible (Latham et al., 2008; Jones et al., 2009; Rasch
5
et al., 2009). They found that this CDN concentration was sufficient to offset either
all, or a significant fraction of the radiative forcing in a double CO2scenario. Figure 9
shows histograms of the multi-model absolute CDN concentration in a range of geo-engineering scenarios and assumed updraught velocities, the vertical dotted line marks
the 375 cm−3threshold and only gridboxes with a low level cloud cover of>50 % have
10
been considered (cloud cover taken from the ISCCP low cloud data). As we do not consider the processes of collision coalescence this CDN at cloud base is an upper limit of the maximum feasible CDN concentration at cloud top.
If the updraught velocity is≥0.2 ms−1 an enhancement in aerosol number
concen-tration of ≥400 cm−3 is sufficient to achieve a CDN concentration of 375 cm−3 in all
15
gridboxes in all models, this is slightly larger than the online enhancement
calcu-lated in the 5×Geo scenario calculated by Korhonen et al. (2010, 365 cm−3), but
with this enhancement and updraught the CDN is substantially over 375 cm−3, with
a mean CDN concentration of 440 cm−3. Updraught limitation becomes important at
lower updraughts: whenw=0.1 ms−1 an enhancement of 400 cm−3 results in a CDN
20
of>375 cm−3 in only 49 % of gridboxes and when w =0.05 ms−1<1 % of gridboxes
have a CDN of>375 cm−3. At the updraughts considered a CDN of of 1000 cm−3 is
almost never achieved.
As updraughts of≤0.2 ms−1are common in marine stratocumulus clouds (e.g.
Guib-ert et al., 2003; Lu et al., 2007; Guo et al., 2008) assuming a global mean value of 25
375 cm−3is likely to overestimate the geoengineered CDN concentration and result in
an overestimation of the potential cooling efficiency of sea-spray geoengineering,
how-ever the importance of this effect will depend on the spectrum of updraught velocities
ACPD
12, 7125–7166, 2012Efficacy of sea spray geoengineering
K. J. Pringle et al.
Title Page
Abstract Introduction
Conclusions References
Tables Figures
◭ ◮
◭ ◮
Back Close
Full Screen / Esc
Printer-friendly Version
Interactive Discussion
Discussion
P
a
per
|
Dis
cussion
P
a
per
|
Discussion
P
a
per
|
Discussio
n
P
a
per
|
or through dedicated field campaigns. In conclusion, we see from Figs. 8 and 9 that the three models examined here show that there is scope for larger regional increases in CDN than achieved in Korhonen et al. (2010), but in all models low updraughts present a natural limitation to the increase in CDN attainable. Calculations of the percentage increase in CDN must therefore consider the frequency distribution of updraughts in 5
marine stratocumulus clouds in greater detail.
5 Conclusions
Sea spray geoengineering of marine stratocumulus clouds to increase cloud albedo has been proposed as a possible technique to slow the rate of warming due to an-thropogenic greenhouse gases. We have presented an investigation into the ability 10
of geoengineered aerosol to activate to form cloud droplets and thus increase cloud
droplet number. The efficacy has been explored in a 0-D box model scenario and also
diagnosed from the aerosol fields simulated by three global aerosol models.
In the 0-D simulations we find that, in line with previous studies, the ability of the additional aerosol to activate depends on: (i) the properties of the additional aerosol, 15
(ii) the background aerosol concentrations and, (iii) the in-cloud updraught velocity. As would be expected, the increase in CDN is greatest when the background aerosol load-ing is low as there is little competition for water vapour. We do not find large regions of parameter space where decreases in CDN occur as a result of geoengineering, but it can happen when at least three of the following conditions are met: the injected particle 20
number is<100 cm−3, the injected diameter is>250–300 nm, the background aerosol
loading is large (≥150 cm−3) and the in-cloud updraught velocity is low (<0.2 ms−1).
The finding that the injection of a small number of particles can decrease CDN is in-teresting as, close to a ship, the enhancement of aerosol concentrations is expected
to be large but, further from the ship, dilution effects will become important and the
25
ACPD
12, 7125–7166, 2012Efficacy of sea spray geoengineering
K. J. Pringle et al.
Title Page
Abstract Introduction
Conclusions References
Tables Figures
◭ ◮
◭ ◮
Back Close
Full Screen / Esc
Printer-friendly Version
Interactive Discussion
Discussion
P
a
per
|
Dis
cussion
P
a
per
|
Discussion
P
a
per
|
Discussio
n
P
a
per
concentrations which may decrease CDN. High resolution modelling or field experi-ments would be required to assess the magnitude of this finding in more detail.
By examining output from three established global aerosol models we are able to
examine the sensitivity of the efficiency of sea-spray geoengineering to the aerosol
model used. We find that the simulated percentage increase in CDN varies substan-5
tially between the three models with ECHAM-HAM predicting the largest percentage
increase in CDN and GLOMAP-Mode the smallest. The inter-model differences are due
to the range of background CDN concentrations simulated, which strongly affects the
percentage change in CDN arising from geoengineering. The background CDN con-centrations are broadly inversely proportional to the simulated number of accumulation 10
mode (50< Rp<500 nm) particles, which is similar in the models at the surface layer,
but varies significantly at cloud base (here assumed to be 940 hPa) where fewer
ob-servations are available to constrain models. The inter-model differences in efficiency
can be as large as the regional differences, thus careful examination of the robustness
of the background distribution is essential in studies that aim to predict the change in 15
CDN that occurs as a result of geoengineering and where possible output from multiple models should be used.
The three models show quite weak dependence on the injected aerosol diameter and
mode width. For a fixed injection number of 300 particles cm−3injecting at a diameter of
160 nm diameter gives the largest increase in CDN, injecting at larger sizes decreases 20
the enhancement in CDN (despite the increase in the mass of aerosol injected) but the
effect is quite weak. Injecting a narrow mode of sea-spray aerosol (σ=1.1) gives the
largest increase in CDN, but when the modal geometric standard deviation is increased
(to 1.6) only small decreases in geoengineering efficiency occur.
We find that the in-cloud updraught velocity provides a natural limit to the maximum 25
increase in CDN achievable through geoengineering. When the updraught is≥0.2 ms−1
injection of 400 cm−3 particles results in a CDN concentration of >375 cm−3 in all
model gridboxes (with monthly mean cloud cover of>50 %), but when the updraught
ACPD
12, 7125–7166, 2012Efficacy of sea spray geoengineering
K. J. Pringle et al.
Title Page
Abstract Introduction
Conclusions References
Tables Figures
◭ ◮
◭ ◮
Back Close
Full Screen / Esc
Printer-friendly Version
Interactive Discussion
Discussion
P
a
per
|
Dis
cussion
P
a
per
|
Discussion
P
a
per
|
Discussio
n
P
a
per
|
0.1–0.2 ms−1 are very common in marine stratocumulus clouds thus it is likely that
many clouds will fall between these two scenarios (i.e. 49–100 %) but this will depend on the properties of the perturbed cloud. Overall we conclude that the response to
a large increase in aerosol number (≥400 cm−3) will depend critically on whether the
updraught is at the higher or lower end of the range of updraughts possible in marine 5
stratocumulus clouds and this should be considered in global studies.
Acknowledgements. We thank the AeroCom aerosol model inter-comparison project for the provision of the global model data used in this study and the development team behind each model. We also thanks A. Nenes for provision of the activation parametrisation code, H. Ko-rhonen for provision of model data and useful discussion and Adrian Lock for provision of the
10
ASTEX simulation diagnostics. P. Stier has been supported by the Geoengineering Programme of the Oxford Martin School.
References
Akbari, H., Menon, S., and Rosenfeld, A.: Global cooling: increasing world-wide urban albedos to offset CO2, Climatic Change, 94, 275–286, doi:10.1007/s10584-008-9515-9, 2009. 7127
15
Alterskjær, K., Kristj ´ansson, J. E., and Seland, Ø.: Sensitivity to deliberate sea salt seeding of marine clouds – observations and model simulations, Atmos. Chem. Phys. Discuss., 11, 29527–29559, doi:10.5194/acpd-11-29527-2011, 2011. 7129
Barahona, D., West, R. E. L., Stier, P., Romakkaniemi, S., Kokkola, H., and Nenes, A.: Compre-hensively accounting for the effect of giant CCN in cloud activation parameterizations, Atmos.
20
Chem. Phys., 10, 2467–2473, doi:10.5194/acp-10-2467-2010, 2010. 7130, 7140, 7160 Bennartz, R.: Global assessment of marine boundary layer cloud droplet number concentration
from satellite, J. Geophys. Res.-Atmos., 112, D02201, doi:10.1029/2006JD007547, 2007. 7127, 7139
Bower, K., Choularton, T., Latham, J., Sahraei, J., and Salter, S.: Computational assessment of
25
ACPD
12, 7125–7166, 2012Efficacy of sea spray geoengineering
K. J. Pringle et al.
Title Page
Abstract Introduction
Conclusions References
Tables Figures
◭ ◮
◭ ◮
Back Close
Full Screen / Esc
Printer-friendly Version
Interactive Discussion
Discussion
P
a
per
|
Dis
cussion
P
a
per
|
Discussion
P
a
per
|
Discussio
n
P
a
per
Bretherton, C. S., Krueger, S. K., Wyant, M. C., Bechtold, P., Van Meijgaard, E., Stevens, B., and Teixeira, J.: A GCSS Boundary-Layer Cloud Model Intercomparison Study Of The First Astex Lagrangian Experiment, Bound.-Lay. Meteorol., 93, 341–380, doi:10.1023/A:1002005429969, 1999. 7134
Bretherton, C. S., Wood, R., George, R. C., Leon, D., Allen, G., and Zheng, X.: Southeast
5
Pacific stratocumulus clouds, precipitation and boundary layer structure sampled along 20◦S during VOCALS-REx, Atmos. Chem. Phys., 10, 10639–10654, doi:10.5194/acp-10-10639-2010, 2010. 7133, 7134, 7138
Chen, Y. and Penner, J. E.: Uncertainty analysis for estimates of the first indirect aerosol effect, Atmos. Chem. Phys., 5, 2935–2948, doi:10.5194/acp-5-2935-2005, 2005. 7130
10
Crutzen, P. J.: Albedo Enhancement by Stratospheric Sulfur Injections: A Contribution to Re-solve a Policy Dilemma?, Climatic Change, 77, 211–220, doi:10.1007/s10584-006-9101-y, 2006. 7127
Fountoukis, C. and Nenes, A.: Continued development of a cloud droplet formation parameterization for global climate models, J. Geophys. Res.-Atmos., 110, D11212,
15
doi:10.1029/2004JD005591, 2005. 7130
Guibert, S., Snider, J. R., and Brenguier, J.-L.: Aerosol activation in marine stratocumulus clouds: 1. Measurement validation for a closure study, J. Geophys. Res.-Atmos., 108, 8628, doi:10.1029/2002JD002678, 2003. 7133, 7143
Guo, H., Liu, Y., Daum, P. H., Senum, G. I., and Tao, W.: Characteristics of vertical velocity
20
in marine stratocumulus: comparison of large eddy simulations with observations, Environ. Res. Lett., 3, 5020, doi:10.1088/1748-9326/3/4/045020, 2008. 7133, 7143
Hawkins, L. N., Russell, L. M., Twohy, C. H., and Anderson, J. R.: Uniform particle-droplet partitioning of 18 organic and elemental components measured in and below DYCOMS-II stratocumulus clouds, J. Geophys. Res.-Atmos., 113, D14201, doi:10.1029/2007JD009150,
25
2008. 7133
Heintzenberg, J. and Larssen, S.: Structure, variability and persistence of the submicrometer marine aerosol, Tellus, 56, 357–367, 2004. 7132, 7134, 7135, 7152, 7158
Hill, A. A., Feingold, G., and Jiang, H.: The Influence of Entrainment and Mixing Assump-tion on Aerosol-Cloud InteracAssump-tions in Marine Stratocumulus, J. Atmos. Sci., 66, 1450–1464,
30
doi:10.1175/2008JAS2909.1, 2009. 7133
ACPD
12, 7125–7166, 2012Efficacy of sea spray geoengineering
K. J. Pringle et al.
Title Page
Abstract Introduction
Conclusions References
Tables Figures
◭ ◮
◭ ◮
Back Close
Full Screen / Esc
Printer-friendly Version
Interactive Discussion
Discussion
P
a
per
|
Dis
cussion
P
a
per
|
Discussion
P
a
per
|
Discussio
n
P
a
per
|
Aardenne, J., and Lelieveld, J.: The atmospheric chemistry general circulation model ECHAM5/MESSy1: consistent simulation of ozone from the surface to the mesosphere, At-mos. Chem. Phys., 6, 5067–5104, doi:10.5194/acp-6-5067-2006, 2006. 7130
Jones, A., Roberts, D., Woodage, M., and Johnson, C.: Indirect sulphate aerosol forcing in a climate model with an interactive sulphur cycle, J. Geophys. Res.-Atmos., 106, 20293–
5
20310, 2001. 7142
Jones, A., Haywood, J., and Boucher, O.: Climate impacts of geoengineering marine stratocu-mulus clouds, J. Geophys. Res.-Atmos., 114, D10106, doi:10.1029/2008JD011450, 2009. 7127, 7143
Karydis, V. A., Kumar, P., Barahona, D., Sokolik, I. N., and Nenes, A.: On the effect of dust
10
particles on global cloud condensation nuclei and cloud droplet number, J. Geophys. Res., 116, D23204, doi:10.1029/2011JD016283, 2011. 7131
Korhonen, H., Carslaw, K. S., and Romakkaniemi, S.: Enhancement of marine cloud albedo via controlled sea spray injections: a global model study of the influence of emission rates, microphysics and transport, Atmos. Chem. Phys., 10, 4133–4143,
doi:10.5194/acp-10-4133-15
2010, 2010. 7127, 7128, 7131, 7132, 7136, 7137, 7140, 7143, 7144, 7153
Latham, J. and Smith, M. H.: Effect on global warming of wind-dependent aerosol generation at the ocean surface, Nature, 13, 372–373, 1990. 7127
Latham, J., Rasch, P., Chen, C., Kettles, L., Gadian, A., Gettelman, A., Morrison, H., Bower, K., and Choularton, T.: Global temperature stabilization via controlled albedo enhancement
20
of low-level maritime clouds, Royal Society of London Philosophical Transactions Series A, 366, 3969–3987, doi:10.1098/rsta.2008.0137, 2008. 7127, 7143
Lu, M. and Seinfeld, J. H.: Study of the Aerosol Indirect Effect by Large-Eddy Simulation of Marine Stratocumulus, J. Atmos. Sci., 62, 3909–3932, doi:10.1175/JAS3584.1, 2005. 7133 Lu, M. and Seinfeld, J. H.: Effect of aerosol number concentration on cloud droplet dispersion:
25
A large-eddy simulation study and implications for aerosol indirect forcing, J. Geophys. Res.-Atmos., 111, D02207, doi:10.1029/2005JD006419, 2006. 7133
Lu, M., Conant, W. C., Jonsson, H. H., Varutbangkul, V., Flagan, R. C., and Seinfeld, J. H.: The Marine Stratus/Stratocumulus Experiment (MASE): Aerosol-cloud relationships in marine stratocumulus, J. Geophys. Res.-Atmos., 112, D10209, doi:10.1029/2006JD007985, 2007.
30
7127, 7134, 7143
ACPD
12, 7125–7166, 2012Efficacy of sea spray geoengineering
K. J. Pringle et al.
Title Page
Abstract Introduction
Conclusions References
Tables Figures
◭ ◮
◭ ◮
Back Close
Full Screen / Esc
Printer-friendly Version
Interactive Discussion
Discussion
P
a
per
|
Dis
cussion
P
a
per
|
Discussion
P
a
per
|
Discussio
n
P
a
per
global aerosol microphysics model for the UKCA composition-climate model, Geosci. Model Dev., 3, 519–551, doi:10.5194/gmd-3-519-2010, 2010. 7130, 7131, 7136
Mann, G. W., Carslaw, K. S., Ridley, D. A., Spracklen, D. V., Pringle, K. J., Merikanto, J., Ko-rhonen, H., Schwarz, J. P., Lee, L. A., Manktelow, P. T., Woodhouse, M. T., Schmidt, A., Breider, T. J., Emmerson, K. M., Reddington, C. L., Chipperfield, M. P., and Pickering, S.
5
J.: Intercomparison of modal and sectional aerosol microphysics representations within the same 3-D global chemical transport model, Atmos. Chem. Phys. Discuss., 12, 623–689, doi:10.5194/acpd-12-623-2012, 2012. 7140
Martin, G., Johnson, D., and Spice, A.: The measurement and parameterization of effective radius of droplets in warm stratiform clouds, J. Atmos. Sci., 51, 1823–1842, 1994. 7142
10
Merikanto, J., Spracklen, D. V., Pringle, K. J., and Carslaw, K. S.: Effects of boundary layer particle formation on cloud droplet number and changes in cloud albedo from 1850 to 2000, Atmos. Chem. Phys., 10, 695–705, doi:10.5194/acp-10-695-2010, 2010. 7130, 7131 Meskhidze, N., Nenes, A., Conant, W. C., and Seinfeld, J.: Evaluation of a new Cloud Droplet
Activation Parameterization with In Situ Data from CRYSTAL-FACE and CSTRIPE, J.
Geo-15
phys. Res.-Atmos., 110, D16202, doi:10.1029/2004JD005703, 2005. 7130
Nenes, A. and Seinfeld, J. H.: Parameterization of cloud droplet formation in global climate mod-els, J. Geophys. Res.-Atmos., 108, 4415, doi:10.1029/2002JD002911, 2003. 7130, 7140, 7160
Partanen, A.-I., Kokkola, H., Romakkaniemi, S., Kerminen, V.-M., Lehtinen, K. E. J.,
20
Bergman, T., Arola, A., and Korhonen, H.: Direct and indirect effects of sea spray geoengineering and the role of injected particle size, J. Geophys. Res., 117, D02203, doi:10.1029/2011JD016428, 2012. 7128, 7141
Pozzer, A., de Meij, A., Pringle, K. J., Tost, H., Doering, U. M., van Aardenne, J., and Lelieveld, J.: Distributions and regional budgets of aerosols and their precursors simulated with the
25
EMAC chemistry-climate model, Atmos. Chem. Phys., 12, 961–987, doi:10.5194/acp-12-961-2012, 2012. 7130
Pringle, K. J., Carslaw, K. S., Spracklen, D. V., Mann, G. M., and Chipperfield, M. P.: The relationship between aerosol and cloud drop number concentrations in a global aerosol mi-crophysics model, Atmos. Chem. Phys., 9, 4131–4144, doi:10.5194/acp-9-4131-2009, 2009.
30
7130, 7131, 7142