Introduction
The first attempt to classify Brazilian vegetation
was that of Martius (1840) who used names of
mythological nymphs ascribed to major features of
the landscapes. His system was a mixture of features
refering to natural botanical regions including both
physiognomy and flora as well as environment. He
recognized five botanical provinces: Naiads
(nymphs who presided over springs, rivers, and
lakes) refering to the Amazonian region; Oreads
(presided over mountains and grottoes) refering to
the “cerrado” region; Dryads (forests), to eastern
forests south of Amazonia; Hamadriads (mortal
nymphs dwelling in trees, being born, living and
dying in them), to the “caatinga” thorn-woodland/
shrubland region; and Napaeae (glens), to the
southest grassland region. Martius’s (1840) system
was used as the basis for almost all the subsequent
classification systems (Ferri 1980), which have
sometimes stressed floristics (e.g. Sampaio 1945),
sometimes physiognomy (such as Azevedo 1950),
sometimes abiotic features (like Campos 1912).
However, none of these systems can be considered
fully satisfactory , especially when one takes into
account the huge surface extension of Brazil, the
great heterogeneity of its landscapes, the lack of
knowledge on most of its flora, the range of
physiognomic variations in the same vegetation
compartment, etc. One of the main critiques of these
systems is the lack of coherence, for a single system
may classify vegetation of different types
emphasizying features of different natures.
Climate, soil and tree flora relationships in forests in the state of São Paulo,
southeastern Brasil
1ROSELI BUZANELLI TORRES
2, FERNANDO ROBERTO MARTINS
3e
LUIZA SUMIKO KINOSHITA
3(recebido em 09/03/95; aceito em 27/09/96)
ABSTRACT - (Climate, soil and tree flora relationships in forests in the state of São Paulo, southteastern Brasil). With the aim of verifying possible influences of abiotic features on the spatial distribution of forest tree species and families, thirteen surveys in the state of São Paulo were selected, representing different conditions (localization at the extreme coordenates and altitudes, succesional stages, surveying methods). By applying Jaccard’s Index to the binary matrices of 806 synonymized specific binomina and 79 families (Cronquist’s system) phenograms were constructed using the method of the unweighted pair grouping by mathematical average (UPGMA). The species formed two floristic blocks: hygrophyllous (yearly rainfall greater than 2000 mm without dry season) and mesophyllous (yearly rainfall about 1400 mm with variable dry season). The latter was divided in two other groups: the high-altitudinal (median altitudes higher than 750 m, frost average frequency greater than 3 days/year) and low-altitudinal. Both mesophyllous floristic blocks were subdivided according to soil conditions (texture, eutrophism, acid or allic dystrophism, iron content). At the family level the relations were weak, but also showed the soil nutritional status as a possible constraint to the spatial partition of families. RESUMO - (Relações entre clima, solo e flora arbórea em florestas no estado de São Paulo, Brasil sudeste). Com o objetivo de verificar possíveis influências de fatores abióticos sobre a repartição espacial de espécies e famílias arbóreas, treze levantamentos no estado de São Paulo foram selecionados, representando diferentes condições (localização nos extremos de coordenadas e altitudes, estádios sucessionais, métodos de levantamento). Aplicou-se o índice de Jaccard a uma matriz binária de 806 binômios específicos sinonimizados e 79 famílias (sistema de Cronquist). Foram construídos fenogramas usando o método de pareamento por média matemática não ponderada (UPGMA). As espécies formaram dois blocos florísticos: o higrófilo (precipitação total anual média maior que 2000 mm sem estação seca) e o mesófilo (precipitação total anual média ao redor de 1400 mm com estação seca variável). O bloco mesófilo dividiu-se em dois grupos: o alto-altitudinal (altitude mediana maior que 750 m, freqüência média de geadas maior que três dias/ano) e o baixo-altitudinal. Ambos os grupos do bloco mesófilo subdividiram-se de acordo com parâmetros do solo (textura, eutrofismo, distrofismo ácido ou álico, teor de ferro). No nível de família as relações foram frouxas, mas também indicaram o status nutricional do solo como uma possível influência na repartição espacial
Key words - Tropical forests, tree flora, soil, climate, soil thermohydric regimes
1. From the Master thesis of the first author Curso de Pós-graduação em Biologia Vegetal, IB, Unicamp. 2. Seção de Botânica Econômica, Instituto Agronômico, Caixa
Postal 28, 13001-970 Campinas, SP, Brasil.
Moreover, these classifications are inadequate to
establish relationships among the floras, between
species and abiotic factors or to discuss possible
origins. A prospective, sistematic, integrated
viewpoint is still lacking.
The situation of the phytogeography in the state
of São Paulo is not different. When compared to
other states of the south and southeastern regions of
Brazil, the state of São Paulo is the least studied
concerning vegetation. Loefgren (1898) adapted
Martius’s (1840) system for the state of São Paulo.
He recognized two floristic-vegetational series, the
dryadic (forest vegetation and all its successional
seres) and the oreadic (“cerrado” and all its
physiognomic variations). Eiten (1970) developed
Loefgren’s (1898) viewpoint, and presented three
floristic-vegetational series: the dryadic, covering
about 80% of the state total area with the subseries
forest, coastal plain, and mangrove; the oreadic,
covering about 18% of the state total area; and the
napaeadic, with the subseries forest and grassland.
The forest subseries of the napaeadic series included
Araucaria
and
Podocarpus
forests and all the
remaining south broadleaf forests. All these types of
vegetation could be in a primary or secondary
successional stage. These systems emphasized
floristics. However, neither Loefgren (1898) nor
Eiten (1970) presented any map or more detailed
floristic or physiognomic descriptions which could
allow one to distinguish the series and subseries.
Chiarini & Coelho (1969) presented a map of the
main vegetation types based on aerial photographs,
distinguishing littoral vegetation, humid tropical
broadleaf forest of slopes,
Araucaria
forest,
Araucaria-Podocarpus
mixed forest, high-altitude
subtropical forest, tropical broadleaf forest,
semideciduous tropical broadleaf forest, “cerradão”
(forest-like “cerrado”), “cerrado”, and “campo”
(grassland). Information gathered from fields other
than aerial photographs is still lacking to corroborate
or modify this division.
Nevertheless, many quantitative and floristic
surveys of Paulian forests were already made, thus
representing a considerable volume of data, although
not yet enough for deep analysis (Martins 1989,
1991). Such data can, and should, be sistematized in
order to provide the construction of working
hypotheses which could guide future resarch,
sinthesize sparse knowledge, and comprehend
several fields of the environmental sciences.
Besides, such sistematization could underpin,
through a coherent viewpoint, the construction of a
system of phytogeographic classification of forests
of the state of São Paulo. The main objective of this
paper was to present a working hypothesis about the
spatial repartition of forest tree species in the state
of São Paulo by means of a multivariate
classification, considering the possible influence of
climate, relief, and soil, and comparing it with the
divisions proposed by Chiarini & Coelho (1969).
Material and methods
The comparison among the forests was made at the level of tree species and families, but the scandent shrubs Dasyphyllum
brasiliense (Spreng.) Cabr., D. flagellare (Casar.) Cabr.,
Dalbergia frutescens (Vell.) Britton and Strychnos brasiliensis
(Spreng.) Mart. were also included because they were listed in many surveys. Undetermined taxa were included in the comparison, having been considered exclusive of the locality of their occurrence. All floristic lists were submitted to synnonimization from recent taxonomical reviews. The samples were chosen in order to include the extreme latitudinal, longitudinal and altitudinal points, be present in all the major geomorphological compartments in the state of São Paulo, show different successional status, represent the most different surveying methods, and have the greatest differences in the number of species surveyed. This was an intentional inclusion of noise (Gauch 1982) in the analises, for if a coherent pattern could arise in spite of the noise, it could be considered a fairly enough strong indication of relationships. Only one riparian forest (Morro do Diabo State Reserve) was included, all the others being non-floodable forests. Most samples are fragments representing primary forests with different degrees of disturbance (from strongly to very weakly disturbed) but one is a thirty-year old secondary forest (Angatuba).
Jaccard’s Index was used as a similarity measure, after Pielou’s (1984) recommendation: it is the oldest one used by ecologists, it is the simplest one, and its figures are read directly in percent, thus having an easy interpretation. Silva & Shepherd (1986) also used Jaccard’s Index to compare floristic similarity of some Brazilian forests based on presence/absence of genera. Paulian forest data were used in the binary form, i.e., each sample (survey) was compared to each one of all the others, and each species or family was considered present or absent. Jaccard’s Index (J) considers both the number of co-occurrences (a) and the number of exclusive occurrences in one sample (b) and in the other (c), but disregards the number of co-absences:
J = 100a / (a + b + c)
(Heywood 1967). Delimitation of families followed the classification of Cronquist (1981).
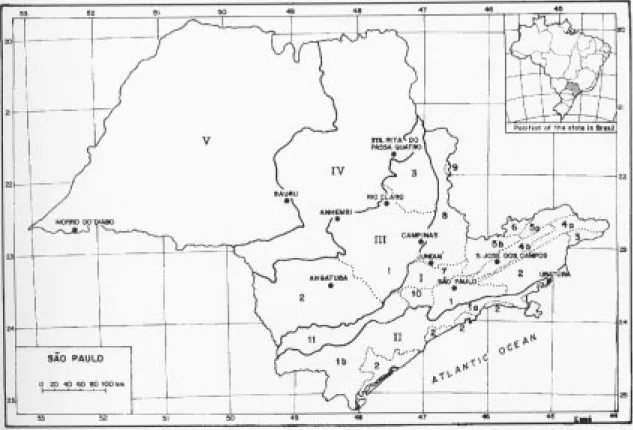
Table 1 shows the samples analysed in this paper, their location in the municipalities, the authors who surveyed them, and the methods employed. The localization of the samples is shown by figure 1, with a map also showing the geomorphological compartmentation of the state of São Paulo in which each compartment was formed in different geological ages (Almeida 1964) Table 2 lists the main features of each sample. Data were extracted from the papers in table 1. When the papers did not supply the infomation requested other papers were consulted. The altitude figures in table 2 refer to the median point of the altitudinal variation above the sea level in the sample. The conversion of the Brazilian taxonomic soil nomenclature to other systems is problematic and hardly feasible (Camargo et al.1987), and so it is maintained in table 2.
Results
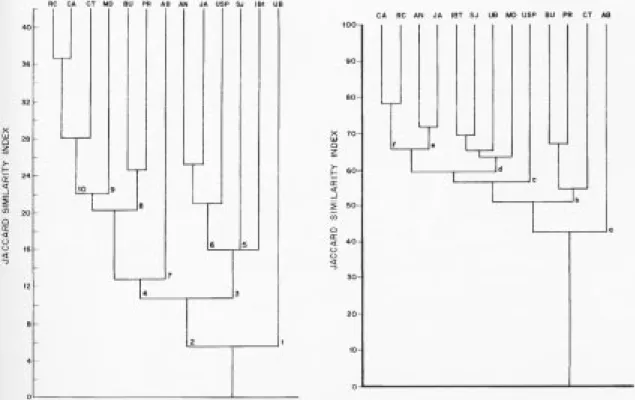
Figure 2 shows the species similarity
dendrogram. It is possible to distinguish several
groups whose similarities range from about 6% to
about 37%, thus showing great differences. Figure 3
shows the family similarity dendrogram. It does not
furnish a distinction of groups as good as that of
figure 2, the similarity values ranging from about
42% to about 78%. The samples are not grouped in
figure 3 in the same way they are in figure 2.
However, some groups are persistent, such as
Campinas-Rio Claro, Bauru-Praxedes,
Angatuba-Japi, São José dos Campos-Instituto de
Botânica, at the higher similarity levels.
The species similarity (figure 2) shows that the
formation of the two groups at the level of about 6%
may be explained by the climate: Ubatuba receives
an average total of 2377 mm of rain per year, and
there is neither the characterization of a dry season
nor frost occurrence, while the other localities
receive a range between 1100 and 1526 mm of rain
per year, show a variable drought period (1 to 6 dry
Table 1. Samples included in this study (numbers 1 to 13), the municipalities and the geomorphological compartments (in parenthesis, see figure 1) in which they were surveyed, authors that surveyed them, and the methods employed. Incl. means the criteria used to include the individuals in the sample, and, unless otherwise specified, means the diameter at breast height. Capital letters outside parentheses indicate vegetation types according to Chiarini & Coelho (1969): TBF -tropical broadleaf forest, STBF - semideciduous tropical broadleaf forest, ASTF - high-altitude subtropical forest, HTB - humid tropical broadleaf forest of slopes.
Municipality Localization Methods Incl. Authors
Angatuba 1) State Reserve (III.2) TBF Floristics Trees Torres, 1989
Anhembi 2) Barreiro Rico Farm (III.1)TBF Floristics Trees Assumpção et al., 1982
Bauru 3) State Rescrve (V)STBF Quarters 10cm Cavassan et al., 1984
Campinas 4) Jequitibás Woodland (III.1)TBF Census Trees Matthes et al., 1988
Jundiaí 5) Japi Municipal Reserve (1.7)TBF Plots 5cm Rodrigues et al., 1989
Rio Claro 6) S. José Farm (III.1)TBF Quarters 130 cml Pagano & Leitão F., 1987 Sta. R. P. Quatro Vaçununga State Park (IV)TBF
7) Capetinga Stand Quarters 15 cm2 Martins, 1979, 1991
8) Praxedes Stand Plots 10 cm Bertoni et al., 1988
S. J. Campos 9) Municipal Reserve (1.5.B)ASTF Plots 5 cm Silva,1989
São Paulo 10) IBt Ipiranga Fountains State Park (I.1)TBF Quarters 5 cm De Vuono, 1985 11) USP S. Paulo Universitary Campus (I.l)TBF Floristics Trees Rossi,1987 Teodoro Sampaio 12) Morro do Diabo State Park (V)SDTBF Floristics Trees Baitello et al., 1988 Ubatuba 13) Agronomic Experimental Station (II.1.A) HTB Quarters 10 cm Silva & Leitão F., 1982 Sta. = Santa; R. = Rita do; P.= Passa; S.= São; J.= José dos; Quarter = quarter method (Cottam & Curtis 1956); (1) stem height; (2) perimeter at ground level; F. = Filho.
Table 2. Principal abiotic features of the samples studied in the state of São Paulo, southeastern Brazil. Altitude figures represent the median of the altitudinal amplitude in each sample. Yearly rain figures are average totals, and the values between parentheses refer to standard deviation
Samples Number ofSpecies Altitude (m) Yearly Rainfall (mm) Soil Type Nutrition Texture
Angatuba 176 900 1450 Li d sandy
Anhembi 76 500 1338 (212) AQ a sand
Bauru 60 570 1281 (276) LR/LVE e sandy
Campinas 178 665 1365 LVA e sandy
Capetinga 92 610 l526 (329) LR e clayey
IBt 182 798 1318 LVA s a sandy
Japi 128 1020 1400 LVA s d sandy
M. Diabo 113 300 1100 LVE a sandy
Praxedes 73 640 1526 (329) LR/LVE d clay-loam
Rio Claro 155 630 1360 LVA e sandy
S. J. Campos 195 840 1400 LVA s a clay-loam
Ubatuba 123 105 2377(145) LVA s a sandy-clay
USP 90 750 1428 LVA s d sandy-clay
M. = Morro do; S.J. = São José dos; Li = Litholic soil; AQ = Quartz Sand; LR = Dusky Red Latosol; LVE = Dark-Red Latosol; LVA = Yellow-Red Latosol; d = dystropphic (acid); a= allic (dystrophic); e = eutrophic; s = shallow fase.
months/year) and present a variable frost occurrence
(up to 6 days/year, in average). These two floristic
blocks may be called hygrophyllous (group 1) and
mesophyllous (group 2), respectively.
Two floristic groups can be distinguished in the
mesophyllous block at the level of about 11%: one
than 3 days/year, often less than 1 day/year (Nimer
1977).
All the samples in the mesophyllous
high-altitudinal f1oristic group occur on dystrophic
soils. Dystrophic soils have the cation exchange
capacity with less than 50% saturation by bases. In
the dystrophic soils most of the cation exchange
capacity may be due either to exchangeable
alluminum (the soil is said to be allic), or to protons
(the soil is said to be acid). The mesophyllous
high-altitudinal floristic group may be thus
subdivided in a subgroup on allic soils (group 5: São
José dos Campos and IBt) and another on acid soils
(group 6: Angatuba, Japi and USP).
The mesophyllous low-altitudinal f1oristic block
splits into a group on a Quartz Sand soil (Anhembi
- group 7) and another on Latosols (Rio Claro,
Campinas, Capetinga, Morro do Diabo, Bauru and
Praxedes). The latter group shows a subgroup on a
soil association of Dark-Red with Dusky-Red
Latosols (Bauru and Praxedes - group 8) and another
on Latosol units (Rio Claro, Campinas, Capetinga
and Morro do Diabo). This last subgroup shows a
division of one sample (Morro do Diabo - group 9)
on dystrophic allic Yellow-Red Latosol and three
samples (Rio Claro, Campinas and Capetinga
-group 10) on eutrophic Latosols. Rio Claro and
Campinas are samples on sandy Yellow-Red
Latosol, while Capetinga is on a very clayey
Dusky-Red Latosol.
The family similarity (figure 3) presents some
resemblance with the specific similarity, but also
presents some differences. Differences are expected
to occur because the family level is at a much more
Figure 2. Species binary similarity phenogram of forests of the state of São Paulo, southeastern Brasil: RC = Rio Claro, CA = Campinas, CT = Capetinga (Santa Rita do Passa Quatro), MD = Morro do Diabo (Teodoro Sampaio), BU = Bauru, PR = Praxedes (Santa Rita do Passa Quatro), AB = Anhembi, AN = Angatuba, JA = Japi (Jundiaí), USP = Universitary campus (São Paulo), SJ = São José dos Campos, IBt = Instituto de Botânica (São Paulo), UB = Ubatuba. Numbers refer to groups commented in the text.
inclusive taxonomic hierarchy, including species
with different growth forms and distinct ecological
preferences. Therefore, it is also expected that a
similarity pattern at the family leveI will be much
more difficult to explain than at the species level.
The family similarity pattern shown by figure 3
is not likely to have any relation to the climate or to
altitudinal variations or to the average frequency of
frost. Moreover, the high values of similarity in
figure 3 may be interpreted as an indication of only
one family block for all forests compared. This
situation implies in that the recognition of family
groups is rather artificial, and the attempt to relate
them to abiotic feature is quite inappropriate.
However, bearing in mind all these limitations, it is
possible to recognize some coherences. Anhembi
(group a) occurs on a soil with a very sandy (over
90%) texture, detaching from all other samples at the
42% similarity level (figure 3) which do not show a
so high sand content. This separation is coherent
with the species similarity pattern opposing groups
7 and 8 of figure 2. By consulting the primary binary
matrix it is possible to point out Magnoliaceae,
Polygonaceae and Violaceae as examples of families
occurring preferably on Quartz Sand soil.
At the level of about 51% similarity a group of
samples (Bauru, Praxedes, and Capetinga - group b)
detaches from the others. This group occurs on
Dusky-Red Latosol and associations of Dusky-Red
and Dark-Red Latosol which have very high iron
content. Urticaceae and Phytolacaceae are families
occurring preferably on these soils. It is possible to
point out four other groups: c) USP, d) IBt, São José
dos Campos, Ubatuba and Morro do Diabo, e)
Angatuba and Japi, and f) Campinas and Rio Claro.
The position of group c is hard to explain,
Cecropiaceae, Oleaceae, and Piperaceae being its
preferencial families. Group d occurs on allic soils,
with Caricaceae, Guttiferae, and Tiliaceae as its
preferencial families. Group e occurs on acid soils,
with Cunoniaceae, Dilleniaceae, and
Ternstroemiaceae as preferencials. Group f occurs
on eutrophic soils, showing Bombacaceae and
Polygonaceae as preferencials.
Discussion
It is possible to synthesize climatic and edaphic
features by means of the thermohydric soil regimes
such as proposed by USDA (1973). Figure 4 presents
a preliminary map of these regimes for the soils of
the state of São Paulo, based on Oliveira et al. ( 1976).
There is a high degree of correspondence when the
species similarity pattern is considered: the
hygrophyllous block occurs on soil with a
hyperthermic perudic regime; the high-altitudina1
mesophyllous block occurs on soils with a thermic
udic regime; and the low-altitudinal mesophyllous
block occurs on soils with a hyperthermic udic
regime. However, the correspondence is very weak
when the family similarity pattern is considered.
Also there is no correspondence between the
dendrograms (figures 2 and 3) and the
geomorphological compartmentation of the state of
São Paulo (figure 1). This may suggest that, although
each major compartment was formed in a different
geological time (Almeida 1964), the abiotic
conditions have stayed reasonably stable during a
period of time long enough for the tree species be
distributed as they are presently. For this reason the
interpretation of the similarity patterns is here made
within an uniformitarianistic way (Wiegleb 1989).
Different sampling methods and including
criteria were employed by the different authors to
survey the stands considered here, which also
present very different floristic richness and
successional stages. However, these differences
seem not to have influenced the results, for the
phenograms do not group together samples surveyed
by means of the same method. This may be an
indication that at least a representative sylvatic unit
(Torquebiau 1986) was included in each sample, and
that successional tree species are different according
to different regional abiotic features.
made an extensive study of the Atlantic Forest of
Slope in Brasil and found a pattern that indicates an
influence of both the distance from the sea and
altitude. This could be interpreted as different
rainfall and air-humidity regimes and variable
frequency of frost. The influence of altitude found
by Siqueira (1994) produced a pattern similar to that
found in our study for the mesophyllous floristic
group.
The median of altitude divides the mesophyllous
floristic block in a high-altitudinal group (above
750 m) and a low-altitudinal group (below 700 m).
The division of the interior Paulian forests in two
tree species groups around 700 m altitude was also
obtained by Salis et al. (1995). The division in
high-altitudinal and low-altitudinal floristic groups
coincides with the subtropical and tropical forest
types of Chiarini & Coelho (1969), respectively.
However, the high-altitudinal mesophyllous floristic
group seems to occupy a surface greater than the one
mapped by those authors, including areas attributed
by them to the broadleaf tropical forest. The
low-altitudinal mesophyllous floristic group does
not show the division into broadleaf tropical forest
and semideciduous broadleaf tropical forest claimed
by those authors. The absence of surveys in the
respective areas of occurrence did not permit a test
of whether there are floristic differences between
Araucaria
and
Araucaria-Podocarpus
mixed
forests.
Soil parameters (like taxonomic category,
eutrophism, allic or acid distrophism, iron content,
texture), and disturbance degree and successional
stage could be important modifiers, selecting the
species which could compose the flora of each
mesophyllous floristic group.
Climate and altitude do not seem to influence the
spatial partition of the tree families in forests of the
state of São Paulo. The same family may include
species which could occur under different climates
and different altitudes, within the range represented
in the samples studied. Although very weak, there is
an indication of the soil nutritional status as a
possible constraint to the spatial partition of
botanical families in forests of the state of São Paulo.
The alpha-diversity figures of the Paulian forests
are at the same order of those of the Amazonian
“terra firme” forests (Martins 1989). The
mathematical complement of the similarity can give
an idea of the magnitude of the beta-diversity (Pielou
1975). Therefore, by considering the low species
similarity of the forests compared, it can be said that
they have also high beta-diversity.
Mueller-Dombois & Ellenberg (1974) stated that two plant
communities may be considered similar when the
binary Jaccard’s Index has a value of at least 25%.
Thus, the low similarity among the specific blocks
could be a strong indicative of real floristic
separation in the field. However, at the family level
the similarity is very high, and it is possible to
consider it an indicator of only one family block in
all forests compared. Considering these high
diversities, it is urgent that the present environmental
policy be put in practice immediately, and legal
devices be created, in order to maximize the
conservation of the still existing biodiversity in the
state of São Paulo.
Explanation and confirmation are two modes
used to face observable phenomena with theory
(Pickett & Kolasa 1989). It must be kept in mind that
a coherent explanation of the similarity patterns
found does not mean that the hypotheses are correct,
but simply that they have some degree of probability.
These probabilities should be evaluated by means of
confirmation (Pickett & Kolasa 1989). New analyses
using a greater number of samples and considering
the phytocenotic organization of forests of the state
of São Paulo and also of other states will certainly
furnish results and hypotheses which can
corroborate, modify or deny the explanation
presented in this paper.
Acknowledgements - The authors thank the Fundo de Apoio ao Ensino e à Pesquisa da UNICAMP (FAEP/UNICAMP process 024/86), the Fundação de Amparo à Pesquisa do Estado de São Paulo (FAPESP - process 86/2906-8) and the Conselho Nacional de Desenvolvimento Científico e Tecnológico (CNPq - process 40-1223/87.6/ZO/FV) for the financial support, Dr. Grady Linder Webster (Section of Ecology and Evolution/Division of Biological Sciences/University of California, Davis, USA) for the critical reading of the manuscript, and Esmeralda Zanchetta Borghi for the drawings.
References
ALMEIDA, F.A.de. 1964. Fundamentos geológicos do relevo paulista. Série teses e monografias 14. Instituto de Geografia/USP, São Paulo.
AZEVEDO, A. de. 1950. Regiões clímato-botânicas do Brasil. Bolm paulista Geogr. 6:32-43.
BAITELLO, J.B., PASTORE, J.A., AGUIAR, O. T., SÉRIO, F.C. & SILVA, C.E. F. 1988. A vegetação arbórea do Parque Estadual do Morro do Diabo, município de Teodoro Sampaio, estado de São Paulo. Acta bot. brasilica 1(Suplemento):221-230.
BERTONI, J.E.de A., MARTINS, F.R., ,MORAES, J.L.de & SHEPHERD, G.J. 1988. Composição florística e estrutura fitossociológica do Parque Estadual de Vaçununga, Santa Rita do Passa Quatro, SP - gleba Praxedes. Bolm Téc. IF 42:149-170.
CAMARGO, M.N., KLAMT, E. & KAUFFMAN, J.H. 1987. Classificação de solos usada em levantamentos pedológicos no Brasil. Bolm inf. SBCS 12:11-33.
CAMPOS, G. de. 1912. Mappa florestal. Directoria do serviço de estatística do ministério da agricultura, indústria e commercio, Riode Janeiro.
CAVASSAN, O., CESAR, O. & MARTINS, F.R. 1984. Fitossociologia da vegetação arbórea da Reserva Estadual de Bauru, estado de São Paulo. Revta brasil. Bot. 7:91-106. CHIARlNI, J.V. & COELHO, A. G. de S. 1969. Cobertura vegetal
natural e áreas reflorestadas no estado de São Paulo. Instituto Agronômico, Campinas.
CLIFFORD, H.T. & STEPHENSON, W. 1975. An introduction to numerical classification. Academic Press, New York. COTTAM, G. & CURTIS, J.T. 1956 The use of distance
measures in phytosociological sampling. Ecology 37:451-460.
CRONQUIST, A. 1981. An integrated system of classification of flowering plants. Columbia University Press, New York. DE VUONO, Y.S. 1985. Fitossociologia do estrato arbóreo da
floresta da Reserva Biológica do Instituto de Botânica (São Paulo, SP). Tese de doutorado, Universidade de São Paulo, São Paulo
EITEN, G. 1970. The vegetation of the state of São Paulo. Boletim 7. Instituto de Botânica, São Paulo.
FERRl, M. G. 1980. Vegetação brasileira. EDUSP, São Paulo; Itatiaia, Belo Horizonte.
GAUCH JR.,H.G. 1982. Multivariate analysis in community ecology. Cambridge University Press, Cambridge. HEYWOOD, V.H. 1967. Plant taxonomy. Studies in biology 5.
Edward Arnold Publishers, London.
LOEFGREN, A. 1898. Ensaio para uma distribuição dos vegetaes nos diversos grupos florísticos no estado de São Paulo. Boletim 11. Commissão Geographica e Geologica de São Paulo, São Paulo.
MARTINS, F.R. 1979. O método de quadrantes e a fitossociologia de uma floresta residual do interior do estado de São Paulo: Parque Estadual de Vaçununga. Tese de doutorado, Universidade de São Paulo, São Paulo. MARTINS, F.R. 1989. Fitossociologia de florestas do Brasil: um
histórico bibliográfico. Pesquisas, série Botânica, 40:102-164.
MARTINS, F.R. 1991. Estrutura de uma floresta mesófila. Editora da UNICAMP, Campinas.
MARTIUS, C.F.P. von. 1840. Tabulae physiognomicae. Brasiliae regionis iconibus expressae. In Flora brasiliensis. (C.F.P. von Martius, S. Endlicher, A.G. Eichler e J. Urban, eds). Lipsaea apud Frid. Fleischer in Comm., Munich. V.1, Tomus 1, p.1-110. MATTHES, L.A.F., LEITÃO FILHO, H. de F. & MARTINS, F.R. 1988. Bosque dos Jequitibás (Campinas, SP): composição florística e fitossociologia do estrato arbóreo. In Anais do V Congresso da Sociedade botânica de São Paulo, Botucatu, p.55-76.
MUELLER-DOMBOIS, D. & ELLENBERG, H. 1974. Aims and methods of vegetation ecology. Wiley, New York. NIMER, E. 1977. Clima. In Geografia do Brasil (IBGE, ed.).
Fundação Instituto Brasileiro de Geografia e Estatística, Rio de Janeiro. V.3. Região Sudeste, p.51-89.
OLIVEIRA, J.B. de, ALFONSI, R.R. & PEDRO JR, M.J. 1976. Regimes hídricos e térmicos dos solos do estado de São Paulo. In Anais do XV Congresso brasileiro de ciência do solo. Sociedade brasileira de ciência do solo, Campinas p.359-362.
PAGANO, S.N. & LEITÃO FILHO, H.de F. 1987. Composição florística do estrato arbóreo de mata mesófila semidecídua no município de Rio Claro (estado de São Paulo). Revta brasil. Bot. 10:37-47.
PICKETT, S.T.A. & KOLASA, J. 1989. Structure of theory in vegetation science. Vegetatio 83:7-15.
PIELOU, E.C. 1975. Ecological diversity. Wiley, New York. PIELOU, E.C. 1984. The interpretation of ecological data. A
primer on classification and ordination. Wiley, New York. RODRIGUES, R.R., MORELATO, L.P.C., JOLY, C.A. &
LEITÃO FILHO, H.de F.1989. Estudo florístico e fitossociológico em um gradiente altitudinal de mata estacional mesófila semidecídua na serra do Japi, Jundiaí. Revta brasil. Bot. 12:71-84.
ROSSI, L. 1987. A flora arbóreo-arbustiva da mata da reserva da Cidade Universitária Armando de Salles Oliveira, São Paulo, SP. Dissertação de mestrado, Universidade de São Paulo, São Paulo.
SALIS, S.M., SHEPHERD, G.J. & JOLY, C.A. 1995. Floristic comparison of mesophytic semideciduous forests of the interior of the state of São Paulo, Southeast Brazil. Vegetatio 119:155-164.
SAMPAIO, A.J.de. 1945. Fitogeografia do Brasil Companhia Editora Nacional, São Paulo.
SILVA, A.F.da. 1989. Composição florística e estrutura fitossociológica do estrato arbóreo da Reserva Florestal Professor Augusto Ruschi, São José dos Campos, SP. Tese de doutorado, Universidade Estadual de Campinas, Campinas.
SILVA, A.F.da & LEITÃO FILHO, H.de F. 1982. Composição florística e estrutura de um trecho da mata atlântica de encosta no município de Ubatuba (São Paulo, Brasil). Revta brasil. Bot. 5:43-52.
SILVA, A.F.da & SHEPHERD, G.J. 1986. Comparações florísticas entre algumas matas brasileiras utilizando análise de agrupamento. Revta brasil. Bot. 9:81-86.
SIQUEIRA, M.F.de 1994. Análise florística e ordenação de espécies arbóreas da mata atlântica através de dados binários. Tese de mestrado, Universidade Estadual de Campinas, Campinas.
THORNTHWAITE, C.W. 1948. An approach towards a rational classification of climate. Geogr. Rev. 38:55-94.
TORQUEBIAU, E.F. 1986. Mosaic pattern in dipterocarp rain forest in Indonesia, and their implications for practical forestry. J. Trop. Ecol. 2:301-325.
TORRES, R.B. 1989. Estudos florísticos em mata secundária da Estação Ecológica de Angatuba, Angatura (São Paulo). Tese de mestrado, Universidade Estadual de Campinas, Campinas. USDA. United States Department of Agriculture. 1973. Soil taxonomy. A basic system for soil classification for making and interpreting soil surveys. Washington.