A WORK PROJECT, PRESENTED AS PART OF THE REQUIREMENTS FOR THE AWARD OF A MASTERS DEGREE IN MANAGEMENT FROM THE FACULDADE DE ECONOMIA DA UNIVERSIDADE NOVA DE LISBOA
A Cross-Cultural Study on the
Effect of Decimal Separator on
Price Perception
Author
Baecker, Christian Roman*
#15000441
A PROJECT CARRIED OUT ON THE MASTER IN MANAGEMENT PROGRAM (MSC) WITH MAJOR IN MARKETING UNDER THE SUPERVISION OF:
ASSISTANT PROFESSOR OF MARKETING ELS DE WILDE
Table of Contents
1 Abstract
...
1
1.1 Keywords ... 1
2 Purpose
...
2
3 Literature Review
...
4
3.1 An Anchoring & Adjustment Model for Price Perception ... 4
3.2 Visual Salience of Decimal Separators ... 6
3.3 Novelty of the Decimal Separator ... 7
4 Methodology
...
9
4.1 Model ... 9
4.2 Procedure and sample ... 9
4.3 Measurements ... 10
4.4 Pre-tests ... 11
5 Findings
...
12
5.1 Descriptive ... 12
5.2 Multivariate Testing for Model ... 12
5.3 Multivariate Testing with Constant Factor ... 13
5.4 Outliers ... 14
6 Discussion
...
15
6.1 Limitations ... 18
7 Conclusion
...
20
8 Recommendations
...
21
8.1 For Business ... 21
8.2 For Future Research ... 22
9 References
...
23
9.1 Published Articles ... 23
9.2 Books ... 24
9.3 Chapter in a Book ... 24
9.4 Other Sources ... 24
List of Figures
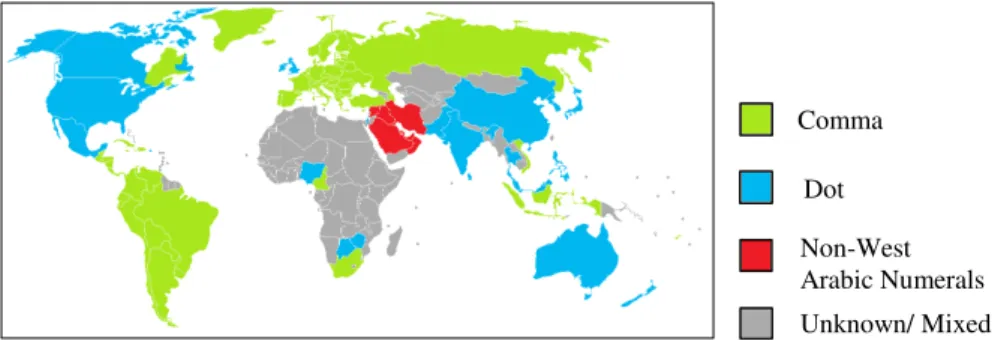
Figure 1: World according to Decimal Separator Usage... 3
Figure 2: Examples of Visual Salience based on (1) Color (2) Shape and (3) Size ... 6
Figure 3: Hypothesized Model ... 8
Figure 4: Research Design Table ... 9
Figure 5: Example of Product Picture with Dot-Price... 11
Figure 6: Mean of Perceived Prices per Sample Group ... 12
1
Abstract
The impact of decimal separator use in prices has not received attention in previous
research. The present study examines the effect of the two worldwide prevailing
separators, comma and dot, on the price perception of Portuguese and US consumers via
an anchoring and adjustment cognitive processing model. Both separator types were
characterized in terms of their visual salience, either salient or non-salient, and
contextual novelty, either familiar or novel. Price perception was measured in its
negative role, as an outlay of economic resources. Applying a factorial design for
multivariate testing of the hypothesized model which predicted lower price perception
for salient and novel separators, the results indicated that the separators’ choice has no
effect on its own. In turn, an interaction among the separators’ salience and novelty
occurred mainly driven by two of the six presented products, possibly revealing
limitations to the study. American consumers revealed generally higher levels of
perceived prices than European. The study contributes by linking pricing and process
numbering literature, providing several recommendations for studies to come.
1.1 Keywords
(1)Price Perception
(2)Decimal Separator
(3)Salience
2
Purpose
Few other determinants mold consumer behavior as much as the price itself. In fact,
price is directly linked to perceptions as product quality (e.g. Rao & Monroe, 1989), the
fairness of a deal (e.g. Bolton, Warlop & Alba, 2003), among many others. Frequently,
prices influence consumers unconsciously: Ariely (2008) revealed that something
simple as thinking about a specific number, either high or low, may influence
consumers’ willingness-to-pay.
In other words, prices and the way these are displayed and pointed mold consumer
behavior. Firms adopt this knowledge to their advantage: For example, 99-ending prices
have been showed to be used more frequently than integer prices (e.g. Stiving & Winer,
1997) as research has proposed a left-digit effect causing consumers to round down
prices to their leftmost digits due to left-to-right processing (Thomas & Morwitz, 2005).
Despite vast pricing literature, one factor has not received any attention in research:
The decimal separator. The separator is a symbol which separates the integer from the
fractional part of numbers in a specific positional numeral system which are cultural
constructs that express numbers under the consistent use of symbols and graphemes.
Why should something apparently meaningless explain price perception?
First, as price is an omnipresent element in all consumption situations any
information contained in it is an influential factor for consumer behavior (Lichtenstein
et al. 1993), explaining the relevance of price formats. Worldwide, three decimal
separator types are used, according to the underlying numeral system. Despite the
existence of a distinct Arabic numeral system, the comma and dot as decimal separators
are used by far more consumers. Although international effort has been realized by the
towards the dot (Baum, 2006), its application remains a social consensus with historical
roots (van der Waerden, 1985).
The use of decimal separators is geographically distinct: The comma is most widely
used among continental Europe and South America, while most Anglophonic countries
as the USA or UK as well as China and India use the dot (Figure 1 – Freedman, 2006).
The second reason for considering the decimal separator as influential for price
perception is globalization: Due to the widespread proliferation of the World Wide
Web, financial transactions and travelling, consumers have increasingly been exposed to
different price formats (concerning aspects as the size, outlay, shape and aspects as the
separator) with changing separators, being noted by Freedman (2006) how “mixing
these conventions holds potential to wreak havoc with international prices”. These
developments call for deeper investigation on how such an omnipresent symbol may
influence decision making.
In this context, the cross-cultural nature of this question becomes pertinent. I
postulate a theory on how numbers, or as here, prices, are encoded within an anchoring
and adjustment model, conditioned by its decimal separators and present an
experimental approach on how consumers with different cultural backgrounds may react
distinctly to these stimuli. By that, the study intends to explore a new research field
within the pricing literature focused on linking its content with that of the number
processing literature.
Figure 1: World according to Decimal Separator Usage
Non-West Arabic Numerals Unknown/ Mixed Comma
3
Literature Review
The importance of decimal separators as determinants of price perception will be
treated as part of the information encoding process of consumers which occurs during
price visualization (Jacoby & Olson, 1974). An anchoring and adjustment model is used
to hypothesize on the impact of salience and novelty of separators on price perception.
3.1 An Anchoring & Adjustment Model for Price Perception
Jacoby and Olson (1974) described price perception based on a
stimulus-organism-response model in which price is referred to as the main cue which activates a
perception process on the organism, i.e. the consumer. By acquiring, encoding and
storing the consumer translates the information contained in the price into cognition,
forming a price attitude. This attitude is then integrated by a behavioral response (e.g.
purchasing or not). Thus, the encoding as an interpretative process of price information
was found to be crucial in forming price perceptions (Berkowitz & Walton, 1980).
Lichtenstein et al. (1993) characterized price perception by seven constructs which
either described price information in its negative role, i.e. uniquely as an economic cost,
negatively affecting purchase probability, or in its positive role, as an indicator of higher
purchase probability. In the negative role five constructs are described: Price
consciousness, value consciousness, coupon proneness, sale proneness and price
mavenism. In the positive role, two: Price-quality schema and prestige sensitivity. In
this study, the price perception concept is going to be adapted within the boundaries of
price consciousness, i.e. at which level a product price is perceived by the consumer,
assuming that he is mainly concerned with paying low prices. In other words, price will
be treated and measured mainly in itsnegative role.
Given the study’s purpose to explore the separator’s effect on price perception, the
adjustment heuristic states that individuals insufficiently adjust from a first
approximation, the anchor, which is a reference point for following cognitive
adjustments (Tversky, Kahneman, 1974). The model has been used in several other
studies to describe how individuals make judgments, as, for example, how face value of
foreign currencies influences purchase behavior (Raghubir & Srivastava, 2002;
Wertenbroch, Soman & Chattopadhyay, 2007).
In this context, anchoring and adjustment has been used as an explanation for the
cognitive processing of numbers. Dehaene et al. (1990) proposed a holistic model for
two-digit numbers as, for example, 51 and 55, in which first the digital code of the
number is “converted into an internal magnitude code on an analogical medium termed
number line” (anchor), and in a second step, are compared per se in terms of their
analogical distance on the number line, being afterwards discretely classified as either
larger or smaller, the adjustment. However, the same study proposed a lexicographic
model for the processing of more complex numbers consisting of more than two digits,
stating that consumers extract (1) decade digits of two two-digit numbers to make a first
approximation of the difference among both numbers and that, (2) a comparison of the
unit digit is only done if both decades digits are equal.
As prices are almost always expressed in two components of digits, namely the
leftmost (LMD’s) and the rightmost digits (RMD’s) (e.g. 19,50 in which LMD’s are 19
and RMD’s are 50), I postulate that the salience and novelty of the separator influences
the encoding of relatively large numbers as prices because a straightforward encoding
would be mentally more taxing than for one or two-digit numbers.
I propose a model in which (1) consumers encode first the LMD’s of a price which
form an anchor in the price perception, analogously to lexicographic encoding. The
left-to-right (Stiving & Winer, 1997) and that consumers dispose of limited memory that
just store the most valuable information (Schindler & Wiman, 1989), here, LMD’s. (2)
The adjustment of the LMD’s price perception according to the RMD’s is influenced by
the separator of choice as the (in-) adequate encoding of the latter ones (RMD’s) is
linked to the attention attributed to the separator. This notion is based on limited
resource model of attention, in which an individual must divide its attention which
amount depends on the consumers’ level of arousal (Kahneman, 1973). A fixed pool of
attention limits the capacity to correctly encode RMD’s after setting LMD’s as anchor
because the processing activity has to be allocated to various price components.
3.2 Visual Salience of Decimal Separators
The salience of symbols (as the separator) has been described by four dimensions,
namely: Semantic, numeric, worded and visual (Hyeong & Kachersky, 2006) from
which the latter is one of the two factors in this study. The visual salience of an object
depends on three factors which include (1) its size relative to the context it is inserted in,
(2) the degree to which it stands out and (3) the strength of its physical limits (Hoffman,
Singh, 1997 – Figure 2).
Figure 2: Examples of Visual Salience based on (1) Color (2) Shape and (3) Size
As such, I postulate that a comma is a more salient decimal separator than a dot in
prices due to its larger size, its more prominent shape and thus calls for more attention.
While the information’s degree of salience influences the ability to store it in
memory and recall (Zukin, 1981; Tversky & Kahneman, 1974), when attention is
affected by salience, Taylor and Thompson (1982) exemplified salience, or vividness, as
the state where an observer attributes relatively larger attention to one aspect over
another. Other researchers define the concept broader and consider all stimuli as salient
which catch the observer’s attention (Pryor & Kriss, 1977). Also was it shown that
visual salience positively influences price awareness by making unit prices on retail
shelf labels visually salient. (Miyazaki, Sprott & Manning, 2000). Thus, I hypothesize:
Hypothesis 1: Main Effect of Visual Salience
A comma is more salient than a dot and thus will positively influence the attention
attributed to the LMD’s (anchor), consequently reducing the adjustment which should
take place by the encoding of the RMD’s, as numbers are processed from left-to-right
and consumer dispose of a limited pool of attention. Ergo, a “comma-price” will be
perceived as lower than the same price with a dot.
3.3 Novelty of the Decimal Separator
The degree to which a decimal separator is novel or not to its observer depends on
the surrounding cultural and social context the observer is inserted in and is as such a
contextual variable. Two forms of novelty are distinguished: Uniqueness and
familiarity. Uniqueness refers to the level to which a stimulus is distinct from other
(Guido, 2001). Familiarity expands this perspective, corresponding to an individual’s
level of formerly acquired experience with a stimulus (Baker et al. 1986). Thus, the
frequency of exposure to a stimulus defines much of its perceived novelty. Consumers
were shown to seek novelty in consumption choices (Hirschman, 1980), increasing the
effort to interpret and encode these stimuli. Also does novel information contribute to
more extensive cognitive processing and thus positively influence information recall
(Lynch and Scrull, 1982) as well as the amount of attention attributed to a stimulus
Hypothesis 2: Main Effect for Novelty
A price separator not commonly used in a cultural community (ergo comma in US and
dot in EU) is a novel stimulus to its consumers and thus will positively influence the
attention attributed to LMD’s (anchor), consequently reducing the adequacy of the
adjustment occurring while consumers encode RMD’s. Thus, a price including a novel
decimal separator will be perceived as lower than the same price (converted into local
currency) when using a decimal separator the observer is familiar with.
However, novelty is correlated with visual salience, as shown by Schindler et al.
(1987) who showed that the likelihood of choice in a lottery game with payoffs
determined by chance was greater for visually salient and thus contextual novel options.
Lynch and Srulls (1982) concluded that novelty alone is enough to make a stimulus
more salient, as novel stimuli call more attention. Consequently, a novel stimulus as an
unfamiliar separator should also be perceived as more salient for price encoding, thus
contributing to an even stronger effect on price perception by their interaction:
Hypothesis 3: Interaction between Salience and Novelty
When the decimal separator is salient (comma) and novel (ergo US consumer), the
attention attached to the encoding of LMD’s (anchor) will increase and consequently
reduce the attention attributed to properly adjust the perception according to RMD’s.
That is, US consumer facing comma-prices will have the lowest price perception.
4
Methodology
4.1 Model
A causal-comparative research factorial design was employed to the present
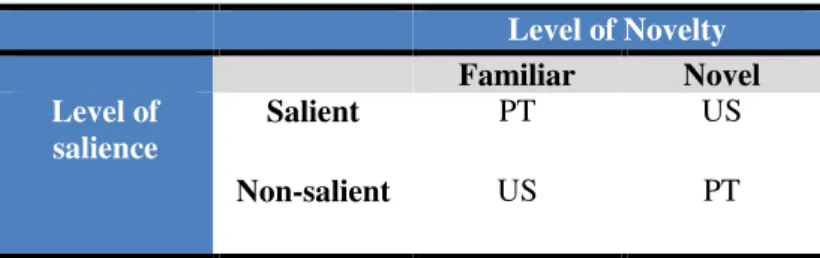
study. The following table summarizes the study’s operational design:
Level of Novelty
Familiar Novel
Level of salience
Salient PT US
Non-salient US PT
Figure 4: Research Design Table
The degree of salience of decimal separators in prices is either salient when the
comma is used, or non-salient, for dots. The separator’s degree of novelty is either
familiar when the consumer is used to it, or novel. That is, two factors are employed,
each with two levels, designated as 2x2 between-subjects design.
4.2 Procedure and sample
The method of data collection was based on web-surveys. In total, four surveys,
corresponding to each level of salience and novelty and geographic area (Table 2), were
drafted. Only decimal separators and currency symbols were changed (either $ or €)
while the prices were converted, holding everything else constant.
The two euro priced surveys were completed by 50 undergraduate students of a
Portuguese business university (25 per group) while the US dollar priced surveys were
completed by 50 undergraduate students of an Eastern US university (25 per group). In
order to guarantee the study’s validity, the respondents were not allowed to answer both
surveys (comma or dot) designated to their group (PT or US), thus sending the surveys
to their personal e-mail accounts to avoid this happening.
While choosing the sample, two factors were crucial. (1) Convenience, which refers
student samples: By increasing the sample’s consistency in terms of demographics and
psychographics (e.g. lifestyle) the risk of extraneous variables (e.g. age) decreasing the
validity of the study should be minimized (Hofstede & Bond, 1988). Previous
cross-cultural studies have confirmed choosing students as sample (e.g. Moore et al. 2003).
While the Portuguese sample with a mean participant age of 19,4 years was slightly
younger than the American with 20,6 years, the Portuguese sample was more balanced
in terms of the participant’s gender (appendix A). In general, homogeneity among both
samples could be assured, with the sample size of 25 cases per cell being sufficient to
guarantee model robustness and avoid a violation of multivariate normality.
4.3 Measurements
The surveys were developed on a renowned survey website. All were taken in
English to avoid translation equivalence issues. English was assumed appropriate as US
consumers’ native language, as well as for the Portuguese sample as the instructions
were simple to understand and followed a step-by-step approach (appendix B).
In order to measure the level of price perception, Thomas and Morwitz’s (2005)
five-point Likert scale was deemed appropriate as basis for the study because it measures
price in its negative role as an outlay of economic resources, including a single
statement for evaluation: “The product’s price is high”. While the statement was
maintained, two more points were added to the scale in order to assure that differences
among the various groups would be more easily distinguishable, ranging from “1 – very
strongly disagree” to “7 – very strongly agree”. The scale would be presented in
horizontal format, without pre-selection to avoid a status quo bias.
Six products were chosen based on an adequate level of the sample’s familiarity with
a bias in terms of consumption preference. This would facilitate price estimation and
increase the response rate. All products included a short description, picture and price
(appendices B&C). To avoid brand influencing price perception, all labels were visually
eliminated. Also were products chosen for which brand can be assumed less relevant as
these are relatively generic and thus considered quasi-commodities (e.g. pen drive). To
further dilute the brand bias effect on responses the product descriptions included
functional benefits to avoid a judgment based on brand associations deriving from
emotionally charged descriptions (appendix C).
The prices were pointed to avoid price rounding bias (e.g. 99-ending prices), so that
half of all products would end on 50 cents (e.g. 19,50). Three prices were
European-based, i.e. the price was investigated on-line, adapted on a 50-ending basis and then
converted to US dollars (e.g. 19,50€ $26.27). The three remaining products had
US-based prices (e.g. $3.50 2,59€), assuring calibration
equivalence. To further guarantee equivalence across
currencies, the respective Euro (€) and Dollar ($) symbols
were positioned below the price and were relatively small
(Figure 5).
4.4 Pre-tests
Pre-tests were necessary to ensure the 7-point scale’s appropriateness for a
specific price such that the evaluations would not fall consistently into the highest or
lowest item of the scale (“extreme observations”) what would decrease the probability
of observing relevant differences among the groups. Despite not being possible to apply
the central limit theorem (CLT: n<30), standard scores, which indicate how many
identify outliers and the number of extreme observations measured (appendix D).
Results indicated the need to adjust the product E’s price slightly upwards as four
observations of seventeen (23,5%) fell into the highest item and a single relatively high
z-score was observed (z ≈ 2,21). Product D (DVD movie) showed highest variance
among all products (σ ≈ 1.954), increasing the risk of extreme observations: Three
observations fell into a scale end (appendix E). This possibly occurred because many
respondents had overseen the information standing above the picture stating that the
movie should be considered as any of personal interest (e.g. drama). To avoid this, the
information was included into the description. No other adjustments were made.
5
Findings
5.1 Descriptive
Overall, the descriptive statistics for all four groups show marginally higher
average price perception for the dot alternative (4,05 vs 3,935) but significantly higher
for the US groups (Figure 6). Standard deviation revealed to be lower for the cases in
which the decimal separator is a symbol consumers’ are familiar with (appendix F).
5.2 Multivariate Testing for Model
The 2x2 between-subjects model (two IV, one DV) was tested by inferential
statistics (multivariate analysis of variance – MANOVA) with the Statistical Package
for Social Sciences (SPSS). For all tests, the significance level was 5% (α=0,05).
The model validity was assessed by Wilk’s lambda (0 ≤λ≤1) which is a measure of
the proportion of variance of price perception which is unaccounted for by salience and
novelty. The lower Wilk’s λ is, the more the effect contributes to the model. Neither for
salience (IV1), nor for novelty (IV2), λ reached a relevant significance level
(0,561>0,05 for IV1 and 0,200>0,05 for IV2), thus neither contributing to explain the
observed variance in perceived price. However, for the interaction of salience and
novelty, statistical significance was obtained (p<0,05 or F=4,211 – appendix G).
When the perceived price of each product was tested as dependent variable, no
significant difference in price perception means due to the separator’s salience could be
found, with the lowest p-value being 0,234 (F=1,435) for product A (appendix H). For
the separator’s novelty as factor no significant differences in means were discovered,
either. However, here a marginally significant effect was found for product D (p≈0,05).
As indicated by overall testing, interaction was significant, driven by products D and
E (appendix I), being confirmed by the corrected model (both p<0,05 or F=7,192 &
2,784 respectively) while the main effects were not significant. Adjusted R-squares,
which indicate the proportion of variability in the data that is accounted for by the
statistical model, revealed more explanatory power for product D than for E
(0,158>0,051). (Complete test outputs on support document, pp. 11-14.)
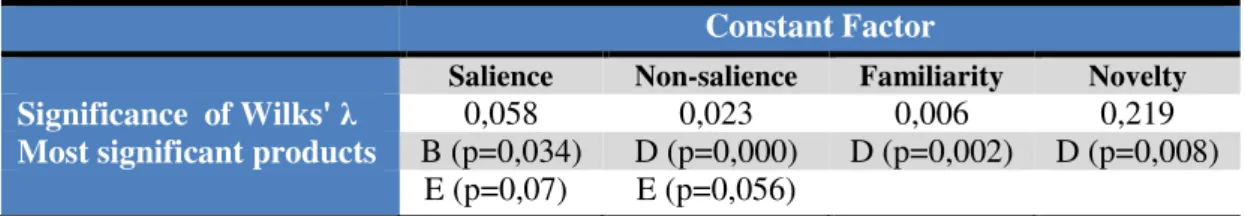
5.3 Multivariate Testing with Constant Factor
As a significant interaction was obtained for the overall model, mainly based on
strong interaction for product D and E, multivariate testing was applied to the perceived
price of each product, holding one of the two factors constant, i.e. either the level of
salience or novelty. As such, four multivariate analyses were conducted with one
Constant Factor
Salience Non-salience Familiarity Novelty Significance of Wilks' λ 0,058 0,023 0,006 0,219
Most significant products B (p=0,034) D (p=0,000) D (p=0,002) D (p=0,008)
E (p=0,07) E (p=0,056)
Figure 7: Overview of Findings for Multivariate Testing with Constant Factor
Only for non-salience and familiarity as constant factors, checking for the impact of
novelty and salience, respectively, Wilk’s λ was significant and thus explained a
relevant part of the observed variance. For constant salience, marginal significance was
observed. Product D protruded being significant in explaining the differences in
perceived price means in three of four multivariate procedures (p<0,05). Product E was
marginally significant to explain differences in means for the impact of novelty when
the degree of salience was held constant (comma or dot). B just appeared to be relevant
for the case in which the comma was employed and tested between a US and EU group.
The tendencies in marginal perceived prices were relatively consistent, indicating
for constant salience (comma), lower marginal price perception for the PT sample; for
constant non-salience (dot), higher price perception for the US; for constant familiarity,
lower price perception for the comma option and for constant novelty, the comma
showed lower price perception. These tendencies were inverted by product F for
constant salience, novelty and familiarity, by product A for constant novelty and by
product B for constant non-salience. (Complete output on support document, pp. 15-38.)
5.4 Outliers
The data set was verified for outliers by computing standard scores, assuming a
normal distribution (n=100, CLT). Therefore the population mean and standard
deviation were calculated. No extreme outliers were detected (z>3), despite higher
frequency of moderate outliers at the US groups (max. z ≈ 2,12). However, moderate
6
Discussion
According to the findings, no main effects for salience or novelty were identified
and thus neither hypothesis one nor hypothesis two statistically confirmed. Still, if from
a descriptive point-of-view the comma option revealed marginally lower price
perceptions than the dot. Also must it be stated that the negative effect of comma use on
price perception was approximately three times larger for the US sample than for the
Portuguese (0,18 vs 0,046 – appendix J), though not statistically significant.
However, noteworthy was the interaction which occurred for the levels of salience
and novelty of decimal separators, even if this finding is not consistent with hypothesis
three which predicted the lowest price perception when a separator was defined as
salient and novel (i.e. US consumers facing comma-prices). Instead, Portuguese
consumers exposed to dot-prices (non-salient & novel) revealed the lowest relative price
perception, with US consumers revealing, in general, higher perceived prices. As such,
the anchoring and adjustment model’s validity for price processing could not be
confirmed based on the hypotheses. Several reasons may have contributed.
First, the effect of the separator’s salience and novelty may not have surpassed the
necessary threshold to provoke any effects for the first two hypotheses, probably
because consumers did not attribute enough attention. Possibly this may have occurred
because price encoding is an almost totally automatic cognitive task and, in general, the
hypothesized attribution of attention may have inaccurately predicted the consumers’
processing system. Increased cultural dilution as a consequence of globalization may
also explain an increase of the threshold for the attribution of attention to the separator.
Second, the hypothesized model itself may not properly explain number processing
for all sample groups. Consumers may have, independently from the separator, encoded
holistic encoding seems mentally taxing, as proposed by several price rounding studies
(e.g. Thomas & Morwitz, 2005) and would also not explain the significant difference
found for the interaction. Still, the marginally lower price perceptions found for the
comma alternative, which was three times larger for the US sample, may indicate that
US consumers, generally exposed to larger price constructs than Europeans (as the
dollar is a fraction of the euro), encode prices more probably in a two-step process, so
that the separator had more relevance for the adjustment according to the RMD’s. This
would explain why prices were perceived as higher within the boundaries of the model.
In terms of interaction, the pattern was the following: When a salient separator
(comma) was employed, perceived prices increased if also novel relative to familiar;
when non-salient (dot), perceived prices decreased if novel; when familiar, perceived
prices increased if non-salient and when a novel separator was employed, perceived
prices decreased if non-salient. These interactions were statistically significant (sig.
Wilks λ < 0,05) for the cases in which non-salience and familiarity were hold constant,
explaining why, in descriptive terms, perceived prices were highest for US consumers
exposed to dot-prices and lowest for Portuguese consumers facing comma prices.
Taking a closer look at which products contributed to the interaction, product D
was statistically significant while product F always contradicted (except for testing
impact of novelty on dot) the tendencies found in marginal price perceptions, as
multivariate testing with one constant factor per time revealed. Not surprisingly, this
underlines the need to explore the impact of possible research limitations, because if the
interaction would have been caused by the separator’s choice, holding everything else
constant, the interaction should have been observed systematically through all product
categories. However, product D contributed more than all other products to the
findings (e.g. when the separator was familiar to the observer, the comma showed lower
marginal price perceptions relative to the dot price for five of six products, except F).
Briefly, the choice of product categories and related distinct price perceptions among
both US and Portugal may have contributed to the interaction.
To explain within the hypothesized model why price perception was highest and
lowest when consumers were familiar with the separator, it may be concluded that
familiarity had a positive effect on the adjustment of LMD’s according to the RMD’s,
even if having in attention that differences in perceived prices may derive mainly from
the choice of product categories which may have distinct prices in the US and EU. The
consumer’s familiarity with the separator may have simply amplified this effect, as the
participants may have unconsciously adapted a posture of perceptual defense excluding
stimuli as the unfamiliar separator to protect per se against the possibility of
misunderstanding the contained information (Schiffman & Kanuk, 1991). This would
support the found interactions but not that price perception was marginally (and
non-significantly) lower for the comma options.
The fact that American consumers generally perceived prices as higher than
Portuguese suggests that a cultural factor may have played a role, besides the product
choice and familiarity, as facilitating factor for perceptual adjustment. As the concept
was measured in its negative role as price consciousness, i.e. in which consumers are
considered to be solely worried about paying the lowest price, this may have ignored
that different cultures have distinct perceptions of price, either in its negative or positive
role. Despite finding evidence for relative equivalence of the various dimensions of
price perception across cultures (Moore et al. 2003; Watchravesringkan, Yan &
Yurchisin, 2008), mainly judging by Moore’s (2003) study, US consumers revealed a
negative role and particularly in two dimensions: price mavenism ( “the degree to which
consumer tend to be a source of price information for other consumers to find products
and places with the lowest prices, answering to other consumer’s requests for
marketplace price information”) and sale proneness ( “an increased propensity to
respond to a purchase offer because the sale form in which the price is presented
positively affects purchase evaluations”, Lichtenstein et al, 1993). Possibly, this intense
perception of US consumers of price in its negative role, which are more frequently
exposed to intense sales promotions (Moore et al. 2003) than Europeans explains
partially their higher price perception. This effect may have been augmented by the
product choice in the present study, which are relatively low priced and for which
resellers frequently adapt aggressive sales tactics to increase volume, emphasizing the
perception of price as a negative market cue. I.e., if US consumers perceived the
product prices mainly as outlays of economic resources, negatively affecting purchase
probability, this would explain why their price perception was higher than for European.
6.1 Limitations
From a resource-based point-of-view the study was the limited by the difficult
access to American undergraduate students. Eventually, one could have chosen more
appropriate products categories if an American sample would have been available in the
pre-test phase, as these could have revealed differences in price perception for some
products. Although the research had statistical validity due to a sufficient large sample
size, larger samples could have been valuable, as, at least in descriptive terms, the
comma as a matter of fact showed generally lower perceived than the dot option.
Further, as the US surveys were sent by a local to a sample of his choice within the
homogeneity of student samples across cultures, using price as a marketing fundamental
among other consumer segments in Portugal would not be desirable without further
analysis as different age segments may be characterized by an attribution of importance
to dimensions of price perception others than price consciousness (Moore et al. 2003).
Moreover, this also made it more difficult to predict and evaluate the answers’ accuracy.
On the other hand, from a content driven point-of-view, the choice of product
categories may have limited the study’s results. Possibly, the local face value effect (e.g.
Raghubir & Srivastava, 2002) played a role, as by simply converting prices from euros
into dollars and vice-versa the distinct face value in each currency did not reflect the
selected products’ local pricing. Especially product D and E, which were the most
significant in explaining the interaction, revealed much higher average price perceptions
for the US group relative to the Portuguese (+1,46 and 1,04, respectively – appendix L).
Another effect which may have occurred is magnitude-related: Prices expressed in
dollars are relatively larger than the same price in euro’s, such that the RMD’s in dollar
prices were eventually more frequently ignored or, at least, LMD’s insufficiently
adjusted, due to their lower relative weight (analogous to face value effect). However,
on contrary to the findings this should have revealed lower price perception for US
consumers, possibly showing a higher effect of local face value than of price magnitude.
Although in absence of visual brands, some products may have been implicitly
brand-related, limiting the comparative findings: For example, a sports drink may have
a brand association with Gatorade, which may be much wider known in the US than a
comparable brand in Europe. The different levels of brand equity in the US and EU may
7
Conclusion
In general it could not be shown that either the separators’ visual salience or the
novelty are drivers of price perception on their own. This may suggest that either the
attention attributed to pricing separators did not exceed the necessary threshold because
the encoding process is practically automatic despite the relatively high information
load included in prices; Or the two-step encoding model does only apply to American
consumers which are more commonly exposed to larger numbers than Portuguese, thus
needing a less mentally taxing approach for number processing.
Yet, an interaction could be obtained which may be explained by the erroneous
choice of products, which are possibly distinctly priced in the US and Portugal. Though
this was a limitation to the study, the interaction could also be explained within the
model’s boundaries, as the consumers’ familiarity with the separator was always
underlying to the highest and lowest mean price perceptions: Familiarity may have
worked as an amplifier for the interaction and facilitated the price encoding process.
Moreover, a cultural factor may have contributed to the interactions’ strength, as
US consumers created keener price perceptions in their negative role due to a more
frequent exposure to aggressive sales tactics, insofar explaining why the price
perception was highest for the US sample. However, this does not only reveal a
limitation to the study, but should be understood as a motivation for further inquiry
about the separators’ influence on different price dimensions.
It must also be mentioned that the study was inherently risky due to its exploratory
character and its intention to approach the number encoding and pricing literature by
integrating a cognitive processing model. Therefore, the limitations and findings of the
present study should be considered in the light of a study which is meant to be a door
8
Recommendations
8.1 For Business
For business, even if no straightforward recommendations can be drawn from the
study’s results, a conclusion important to the business world is that price formats are a
field which in the future requires a higher degree of attention. The impact of distinct
price formats, which can be found today in a variety of industries as, for example, the
fast moving consumer goods’ industry, with distinct shapes, sizes (both varying in the
LMD and RMD’s), colors and even touch (e.g. choice of material), should be studied in
the light of purchase behavior and understood as a basis for new marketing tools.
Especially for low margin business, volume is a key success factor and thus small
changes in price perception are crucial. Further do such measures require low capital
investments and are relatively fast to implement, so that they should be considered
especially in times of economic crisis as the world is undergoing.
Firms should pay attention in adequately adjusting pricing policies, recognizing that
it is not enough to convert prices from one currency to another. The face value effect of
money reflects this problem, especially in businesses as tourism, where consumers tend
to underspend when confronted with prices in currencies which are less valuable than
their home currency, requiring from firms to proactively modify their marketing tactics.
Further, firms going into culturally distinct regions may attribute supplementary
attention to which dimensions of price perception are relevant to local consumers,
especially in markets where profound social, political or economic changes have take
place in the recent past or still take place (e.g. China, where price is generally perceived
in its negative role – Sternquist, Byun, Jin, 2004) and are thus in a phase of convergence
with most Western countries where price is more frequently understood as a
8.2 For Future Research
Some of the number processing literature has been built on how fast consumers are
able to compare numbers (Dehaene et al. 1990). This research design could also be
interesting for future research on the separator’s impact on number processing and, in
last instance, on price perception, providing a more reliable model for future research.
Other price rounding related research has already revealed that consumers adjust
prices insufficiently, for example, in the case of 99-ending prices, i.e. RMD’s (e.g.
Steven & Winer, 1997). By testing for differences in price perception and/or recall,
given both separators used in this research, their role in encoding prices could be further
clarified. It could also be useful to investigate the influence of either comma or dot in
their role as thousand case separators (e.g. 10,000 vs 10.000).
The use of smaller, three-digit prices could be practical (e.g. 0,50€) because this
would increase the relative importance of the RMD’s in the price magnitude, even if
this effect was lower than the face value effect (limitations). This would make it
possible to study the separator’s effect on perceptual adjustment with higher accuracy.
Taking into account the multi-dimensionality of price perception future research
should examine whether the separator has a relevant effect on other dimensions, for
example, in its positive role as an indicator of product quality. It may be possible that
the separator is related to concepts of intrinsic values such as product quality via the
country-of-origin effect, as the comma is despite all globalization, a European symbol.
Finally, the present study did reveal a lack of formal research on price formats or
tags. Testing whether, for example, the size or shape of RMD’s has an effect on price
encoding would be valuable to confirm the relevance of the two factors employed be the
present study in forming price perceptions. This could also include a longitudinal study
9
References
9.1 Published Articles
Baker, W., Hutchinson, J.W., Moore, D., Nedungadi, P. 1986. “Brand Familiarity and Advertising: Effects on the Evoked Set and Brand Preference.” Advances in Consumer Research, 13(1): 637-642;
Berkowitz, Eric N., Walton, John R. 1980. “Contextual Influences on Consumer Price Responses: An Experimental Analysis.” Journal of Marketing Research, 17(3): 349-358;
Bolton, Lisa E., Warlop, Luk, Alba, Joseph W. 2003. “Consumer Perceptions of Price (Un)Fairness.” Journal of Consumer Research, 29(4): 474-491;
Dehaene, Stanislas, Dupoux, Emmanuel, Mehler, Jacques. 1990. “Is Numerical Comparison Digital? Analogical and Symbolic Effects in Two-Digit Number Comparison.” Journal of Experimental Psychology: Human Perception and Performance, 16(3): 626-641;
Hirschman, Elizabeth C. 1980. “Innovativeness, Novelty Seeking and Consumer Creativity.” Journal of Consumer Research, 7(3): 283-295;
Hoffman, Donald, Singh, M. 1997. “Salience of Visual Parts.” Cognition, 63(1): 29-78; Hofstede, Geert., Bond, Michael H. 1988. “The Confucius Connection: From Cultural
Roots to Economic Growth.” Organizational Dynamics, 16(4): 4-21;
Lichtenstein, Donald R., Ridgway, Nancy M., Netemeyer, Richard G. 1993. “Price Perceptions and Consumer Shopping Behavior: A Field Study.”Journal of Marketing Research, 30(X): 234-245;
Lynch, J.G., Srull, T.K. 1982. “Memory and Attentional Factors in Consumer Choice: Concepts and Research Methods.” Journal of Consumer Research, 9(1): 18-37;
Min Kim, Hyeong. Kachersky, Luke. 2006. “Dimensions of Price Salience: A conceptual Framework for Perceptions of Multi-Dimensional Prices.” Journal of Product & Brand Management, 15(2): 139-147;
Miyazaki, A.D., Sprott, D.E., Manning, K.C. 2000. “Unit Prices on Retail Shelf Labels: An Assessment of Information Prominence.” Journal of Retailing, 76(1): 93-112; Moore, M., Kennedy, K.M., Fairhurst, A. 2003. “Cross-Cultural Equivalence of Price
Perceptions between US and Polish Consumers.” International Journal of Retail & Distribution Management. 31(5): 268-279;
Pryor, John B., Kriss, Mitchel. 1977. “The Cognitive Dynamics of Salience in the Attribution Process.” Journal of Personality and Social Psychology, 35(1): 49-55; Raghubir, Priya, Srivastava, Joydeep. 2002. “Effect of Face Value on Product Valuation
in Foreign Currencies.” Journal of Consumer Research, 29(3): 335-347;
Rao, Akshay R., Monroe, Kent B. 1989. “The Effect of Price, Brand Name and Store Name on Buyers’ Perceptions of Product Quality: An Integrative Review.” Journal of Marketing Research, 26(3): 351-357;
Schindler, Robert M., Wiman, Alan R. 1989. “Effects of Odd Pricing on Price Recall.” Journal of Business Research, 19(3): 165-177;
Sternquist, Brenda, Byun, Sang-Eun, Jin, Byoungho. 2004. “The Dimensionality of Price Perceptions: A Cross-Cultural Comparison of Asian Consumers.” International Review of Retail, Distribution and Consumer Research, 14(1): 83-100;
Stiving, Mark. Winer, Russell S. 1997. “An Empirical Analysis of Price Endings with Scanner Data.” Journal of Consumer Research, 24(1): 57-67.
Taylor, S.E. Thompson, S.C. 1982. "Stalking the Elusive ‘Vividness’ Effect.” Psychological Review, 89(2): 155-181;
Thomas, Manoj. Morwitz, Vicki. 2005. “Penny Wise and Pound Foolish: The Left‐Digit Effect in Price Cognition.” Journal of Consumer Research, 32(1): 54-64;
Tversky, A., Kahneman, D. 1974. “Judgment under Uncertainty: Heuristics and Biases.” Science, 185: 1124-1131;
Watchravesringkan, Kittichai (Tu), Yan, Ruoh-Nan, Yurchisin, Jennifer. 2008. “Cross-Cultural Invariance of Consumers’ Price Perception Measures.” International Journal of Retail & Distribution Management, 36(10): 759-779;
Wertenbroch, Klaus, Soman, Dilip, Chattopadhyay. 2007. “On the Perceived Value of Money: The Reference Dependence of Currency Numerosity Effects.” Journal of Consumer Research, 34(1): 1-10;
9.2 Books
Ariely, Dan. 2008. Predictably Irrational: The Hidden Forces that Shape Our Decisions. HarperCollins;
Van der Waerden, B.L. 1985. A History of Algebra. From al Khwarizmi to Emmy Noether. Berlin Springer Verlag;
Kahneman, D. 1973. Attention and Effort. Englewood Cliffs, NY: Prentice-Hall.
9.3 Chapter in a Book
Freedman, Roy S. 2006. “Price, Interest, Time” in Introduction to Financial Technology, 29-69. Academic Press (Elsevier);
Guido, Gianluigi. 2001. “Salience in a Larger Context” in The Salience of Marketing Stimuli: An Incongruity-Salience Hypothesis on Consumer Awareness, 37-62. Kluwer Academic Publishers.
Jacoby, J., Olson, J.C. 1977. “Consumer Response to Price: An Attitudinal Information Processing Perspective”, in Wing, Y, Greenberg, M (Eds),Moving Ahead in Attitude Research, 73-86. American Marketing Association (Chicago, IL);
Schiffman, Leon, Kanuk, Leslie Laslie Lazar. 1991. “Communication and Consumer Behavior” in Consumer Behavior, 4th Edition, NY: Prentice-Hall Inc. 268-306.
Zukin, C. 1981. “Mass communication and public opinion”, in Nimmo, D., Sanders, K. Handbook of Political Communication, Sage, Beverly Hills, CA, pp.359-90.
9.4 Other Sources
Baum, Michael. Nov. 22, 2006. “Decimals Score a Point on International Standards” published on the National Institute of Standards and Technology’s website (USA) Evatt, D.S. 1998. “Bridging Connections: Refining Measurements of the Involvement
10
Appendices
Appendix A: Sample Information
The total raw data can be found in the support document.
Appendix B: Survey Outline (in column form)
1. Purpose
Thank you very much for following the link. This survey is part of a Master in Management thesis of the Faculdade de Economia da Universidade Nova de Lisboa (Portugal). For further information, consult http://www.fe.unl.pt/.
In total, you will be asked to rate the price of six products. To do your evaluation, please consider description and price as given and do not consult external sources (e.g. internet, friends).
All data is treated confidentially. a. Please indicate your age. b. Indicate your gender. c. Indicate your nationality.
d. Indicate your country of residence. (a)-d) were multiple choice questions)
2. Pen
3-in-1 twist design with black ink, stylus and pencil, solid brass cap and barrel.
Please rate on a scale from 1 = very strongly agree to 8 = very strongly disagree the below statement:
“The product’s price is high.”
3. USB Pen
8GB USB pen, easy-to-handle.
Please rate on a scale from 1 = very strongly agree to 8 = very strongly disagree the below statement:
“The product’s price is high.”
4. Wireless mouse
Wireless mouse, plug&play, highly precise, USB adapter included.
Please rate on a scale from 1 = very strongly agree to 8 = very strongly disagree the below statement: “The product’s price is high.” Sample n Average age Gender (M/F%) Nationality
Comma & PT 25 19,24 32/68 Portuguese (100%)
Dot & PT 25 19,56 60/40 Portuguese (100%)
Comma & US 25 20,32 72/28 USA (100%)
Dot & US 25 20,88 64/36 USA (≈81%); Others* (≈19%)
5. DVD movie
Recently launched. Length: 120min. and extra scenes 45min. Subtitles. Dolby Surround, HD (For this evaluation, consider any movie which you are particular interested in).
Please rate on a scale from 1 = very strongly agree to 8 = very strongly disagree the below statement:
“The product’s price is high.”
6. Dictionary software
Instant access to 225000 definitions & 340000 synonyms and antonyms, 21 search options, audio pronunciations, partially downloadable to mobile devices.
Please rate on a scale from 1 = very strongly agree to 8 = very strongly disagree the below statement:
“The product’s price is high.”
7. Sports Drink
Isotonic drink, free from additives. 500ml. Multiple flavors. (Price per bottle)
Please rate on a scale from 1 = very strongly agree to 8 = very strongly disagree the below statement:
“The product’s price is high.”
8. End
Thank you for taking the survey. [Done]
Screenshots from the survey website can be found in the support document.
Appendix C: Products, Designation, Category & Price
Product Designation Category Price 3-in-1 pen A Office equipment 3,50€ = 4.71$*
Memory pen B Electronic apparels 16,50€ = 22.24$*
Wireless mouse C Electronic apparels 25.50$ = 18,90€*
DVD movie D Entertainment 19,50€ = 26.27$*
Dictionary software E Software 20.50$ = 15,19€*
Sports drink F Beverages 3.50$ = 2,59€* *converted at exchange rates of 1€=1.34767US$ or 1US$=0,742024€ (05/04/2010 @ 12:30UTC)
Appendix D: Pre-Test Data
Sample n Mean age Gender (M/F%) Nationality
Appendix E: Descriptive Statistics from Pre-test
Products A B C D E F Mean 3,706 4 4,294 4,235 2,706 4,176
Standard deviation 1,724 1,768 1,160 1,953 1,490 1,590
# of observations in item 1 2 2 0 1 4 1
# of observations in item 7 1 1 0 3 0 1
# of moderate outliers1 3 3 1 1 2 2
# of extreme outliers2 0 0 0 0 0 0
1z < -1,5 or z > 1,52 z < -3 or z > 3. Outlier detection can be found in the support document.
Appendix F: Descriptive Statistics of Findings
Salient (comma) Non-salient (dot)
Familiar (EU) Novel (US) Familiar (US) Novel (EU)
Products x1 s 2 x s x s x s
A 3,96 1,65 4,08 2,00 4,64 1,70 4,24 1,64
B 3,48 1,78 4,56 1,71 4,16 1,62 4,24 1,98
C 3,36 1,41 4,08 1,66 3,76 1,30 3,64 1,80
D 3,72 1,17 4,52 1,98 5,16 1,84 3,04 2,00
E 2,88 1,94 3,88 1,88 4,32 1,93 3,24 1,96
F 4,76 1,59 3,96 1,77 4,12 1,96 4,04 1,99
Average 3,69 1,59 4,18 1,83 4,36 1,73 3,74 1,90
Note: 1 = lowest price perception 7 = highest price perception
1Mean
2Standard deviation
Appendix G: Multivariate Test b and Overall Model Validity
Effect Value F Hypothesis df
Error df
Significance Intercept 0,058 2,482E2 6,000 91,000 0,000
IV1 (Level of salience) 0,949 ,815a 6,000 91,000 0,561
IV2 (Level of novelty) 2 1,462a 6,000 91,000 0,200
IV1 * IV2 (Interaction) 1 4,211a 6,000 91,000 0,001
a. Exact statistic b. Design: Intercept + IV1 + IV2 + IV1 * IV2
The complete test output from SPSS can be found in the support document.
Appendix H: Test of Between-Subject Effects
Source Dependent Variable Type III Sum of Squares
df Mean Square
F Sig.
Corrected Model
DVA 6,5901 3 2,197 0,715 0,546
DVB 15,4702 3 5,157 1,627 0,188
DVC 6,6703 3 2,223 0,92 0,434
DVD 64,1904 3 21,397 7,192 0,000
DVE 31,0805 3 10,36 2,784 0,045
DVF 10,0406 3 3,347 0,994 0,399
IV1a DVA 4,41 1 4,41 1,435 0,234
DVB 0,81 1 0,81 0,256 0,614
DVC 0,01 1 0,01 0,004 0,949
DVD 0,01 1 0,01 0,003 0,954
DVE 4 1 4 1,075 0,302
IV2b DVA 0,49 1 0,49 0,159 0,691
DVB 8,41 1 8,41 2,653 0,107
DVC 2,25 1 2,25 0,931 0,337
DVD 10,89 1 10,89 3,661 0,059
DVE 0,04 1 0,04 0,011 0,918
DVF 4,84 1 4,84 1,438 0,233
IV1 * IV2c DVA 1,69 1 1,69 0,55 0,460
DVB 6,25 1 6,25 1,972 0,164
DVC 4,41 1 4,41 1,825 0,180
DVD 53,29 1 53,29 17,913 0,000
DVE 27,04 1 27,04 7,266 0,008
DVF 3,24 1 3,24 0,963 0,329
a
Level of salience b Level of novelty c Interaction of salience with novelty
1. R2=,022 (Adjusted R2= -,009); 2. R2=,048 (Adj. R2= ,019); 3. R2=,028 (Adj. R2= -,002); 4. R2=,184 (Adj. R2= ,158); 5. R2=,080 (Adj. R2= ,051); 6. R2=,030 (Adj. R2= ,000)
The dependent variables (DVA-F) are the perceived prices for each product per observation (n = 100). The sources Intercept, Error, Total and Corrected Total can be found in the support document.
Appendix I: Graphical Interaction for Products D & E
Appendix J: Differences in Mean Price Perception per Product and Cultural Community
Products Mean Perceived Price in PT
Mean Perceived Price in US
Difference (US-PT) A 4,1 4,36 0,26
B 3,86 4,36 0,5
C 3,5 3,92 0,42
D 3,38 4,84 1,46
E 3,06 4,1 1,04
F 4,4 4,04 -0,36
The above table confirms that product D and E are mainly responsible for driving the interaction.
Support Document for
Work Project
Part of the thesis: “A Cross-Cultural Study on the
Effect of Decimal Separator on Price Perception”
Author
Baecker, Christian Roman*
#15000441
A PROJECT CARRIED OUT ON THE MASTER IN MANAGEMENT PROGRAM (MSC) WITH MAJOR IN MARKETING UNDER THE SUPERVISION OF:
ASSISTANT PROFESSOR OF MARKETING
ELS DE WILDE
Table of Contents
1 Pre-Test Statistics: Outlier detection ... 3
2 Number of Extreme Observations in Pre-Tests ... 3
3 Raw Data from Surveys with Basic Descriptive Statistics ... 4
4 Outlier Detection for Raw Data: Standard z-scores ... 6
5 Multivariate Test b and Overall Model Validity ... 9
6 Test of Between-Subject Effects ... 11
7 Multivariate Testing with Constant Factors ... 13
7.1 Multivariate Testing with Familiarity as Constant Factor ... 13 7.2 Multivariate Testing with Novelty as Constant Factor ... 19 7.3 Multivariate Testing for Constant Salience (comma) ... 25 7.4 Multivariate Testing for Constant Non-Salience (dot) ... 31 8 Screenshots from Surveys for each Product ... 37
8.1 Purpose ... 37 8.2 Product A: Pen ... 37 8.3 Product B: Memory pen ... 37 8.4 Product C: Wireless mouse ... 38 8.5 Product D: DVD movie ... 38 8.6 Product E: Dictionary software ... 38 8.7 Product F: Sports drink ... 39 9 Included Appendices from Work Project ... 40
9.1 Appendix A: Sample Information ... 40 9.2 Appendix B: Survey Outline (in column form)... 40 9.3 Appendix C: Products, Designation, Category & Price ... 41 9.4 Appendix D: Pre-test Data ... 41 9.5 Appendix E: Descriptive Statistics of Pre-test ... 2 9.6 Appendix F: Descriptive Statistics from Findings ... 2 9.7 Appendix G: Multivariate Test b and Overall Model Validity ... 2 9.8 Appendix H: Test of Between-Subject Effects ... 2 9.9 Appendix I: Graphical Interaction for Product D and E ... 3
9.10 Appendix J: Differences in Mean Price Perception per Product and Cultural
1 Pre-Test Statistics: Outlier detection
Age Gender Nationality Pen z USB Pen
z Wirel. Mouse
z DVD
Movie
z Dict. Software
z Sports drink
z-scores
22 F Portugal 1
-1,570
4 0,000 4
-0,254
2
-1,144
1
-1,145
7 1,775
23 M Portugal 7 1,911 1
-1,697
3
-1,116
7 1,415 2
-0,474
6 1,147
21 M Portugal 5 0,751 5 0,566 6 1,471 7 1,415 4 0,868 3 -0,740
22 M Portugal 5 0,751 5 0,566 5 0,609 4
-0,120
4 0,868 3 -0,740
22 F S.T.&P. 4 0,171 6 1,131 5 0,609 4
-0,120
1
-1,145
5 0,518
22 F Portugal 6 1,331 4 0,000 6 1,471 7 1,415 5 1,540 5 0,518
24 M Portugal 4 0,171 3
-0,566
4
-0,254
3
-0,632
3 0,197 4 -0,111
21 F Portugal 2
-0,990
2
-1,131
6 1,471 3
-0,632
2
-0,474
2 -1,368
24 F Portugal 4 0,171 4 0,000 3
-1,116
3
-0,632
1
-1,145
4 -0,111
25 M Portugal 4 0,171 6 1,131 4
-0,254
2
-1,144
1
-1,145
6 1,147
23 F Portugal 5 0,751 7 1,697 4
-0,254
2
-1,144
2
-0,474
4 -0,111
23 M Portugal 1
-1,570
5 0,566 5 0,609 1
-1,656
3 0,197 1 -1,997
24 M Portugal 3
-0,410
2
-1,131
3
-1,116
5 0,391 2
-0,474
6 1,147
22 F Portugal 5 0,751 1
-1,697
2
-1,978
5 0,391 2
-0,474
4 -0,111
23 M Portugal 2
-0,990
3
-0,566
4
-0,254
5 0,391 4 0,868 3 -0,740
21 F Portugal 2
-0,990
5 0,566 4
-0,254
6 0,903 3 0,197 3 -0,740
25 F Brazil 3
-0,410
5 0,566 5 0,609 6 0,903 6 2,211 5 0,518
Average 3,706 4,000 4,294 4,235 2,706 4,176
St.dev. 1,724 1,768 1,160 1,954 1,490 1,590
7 = Highest price perception | 1 = Lowest price perception
Moderate outliers: -1,5 > z and 1,5 > z Extreme outliers: -3 > z and 3 > z
2 Number of Extreme Observations in Pre-Tests
Products A B C D E F
Item 1 2 2 0 1 4 1
3 Raw Data from Surveys with Basic Descriptive Statistics
Age Gender SALIENT, FAMILIAR A B C D E F
19 M Portugal 5 5 5 3 3 4
18 F Portugal 4 6 4 3 4 5
19 F Portugal 3 5 5 3 7 6
18 F Portugal 2 2 1 5 1 6
18 M Portugal 5 1 2 6 1 6
19 F Portugal 2 4 3 4 2 7
18 F Portugal 4 1 2 4 5 2
18 F Portugal 7 1 4 5 1 5
18 F Portugal 2 3 1 5 1 5
19 F Portugal 6 3 4 6 6 2
18 M Portugal 4 6 2 5 2 4
21 M Portugal 5 4 3 2 3 4
27 M Portugal 4 4 5 3 6 7
18 F Portugal 3 3 2 3 3 3
19 F Portugal 5 2 4 4 2 6
18 F Portugal 5 2 4 3 6 3
18 M Portugal 3 2 4 4 4 4
18 M Portugal 4 7 3 5 1 7
18 F Portugal 6 3 4 3 2 3
20 M Portugal 6 3 2 2 1 4
19 F Portugal 5 2 3 3 1 6
18 F Portugal 2 6 6 3 1 7
18 F Portugal 1 4 3 4 2 6
28 F Portugal 5 6 6 2 2 4
19 F Portugal 1 2 2 3 5 3
19,24 32,00% Average 3,96 3,48 3,36 3,72 2,88 4,76
68,00%
Age Gender NON-SALIENT, NOVEL A B C D E F
19 F Portugal 3 2 4 4 4 5
20 M Portugal 3 6 3 1 1 6
19 F Portugal 3 2 2 1 1 3
19 M Portugal 5 3 6 6 4 6
20 F Portugal 3 3 2 2 1 1
21 M Portugal 4 6 6 5 7 5
20 F Portugal 5 7 3 2 4 2
19 F Portugal 5 5 6 6 7 3
20 F Portugal 5 2 2 4 6 5
19 M Portugal 7 7 7 2 3 7
19 F Portugal 7 7 7 2 1 7
19 M Portugal 4 6 4 5 2 5
20 M Portugal 2 6 3 3 4 2