The use of indicators in the pre-analytical
phase as a laboratory management tool
O uso de indicadores da fase pré-analítica como ferramenta da gestão laboratorial
Fabio Triachini Codagnone1; Sibelle Mattos Flores Alencar2; Wilson Shcolnik3; Sergio Roberto da Silva Chaves4; Luciano Andrade Silva5; Victor Hugo Oliveira Henriques6; Luana Carrilho Spitz7
First submission on 01/05/13; last submission on 03/11/13; accepted for publication on 01/12/13; published on 20/04/14
1. Master’s degree in Pharmacology/Neuroscience from Universidade Federal do Paraná (UFPR); student of the Advanced Training Course in Clinical Laboratory Science at Hospital Naval Marcílio Dias (HNMD).
2. Master’s degree in Science majoring Hematology from Universidade Federal do Rio de Janeiro (UFRJ); military pharmacist in charge of the Hematology department of the Clinical Laboratory Service at HNMD.
3. Master’s degree in Public Health from Escola Nacional de Saúde Pública Sergio Arouca of Fundação Oswaldo Cruz (Ensp/Fiocruz); clinical pathology at HNMD. 4. Specialty training in Clinical Laboratory Science at Sociedade Brasileira de Análises Clínicas (SBAC); deputy coordinator of the Clinical Laboratory Service at HNMD. 5. Specialty training in Clinical Laboratory Science; military pharmacist at HNMD.
6. Specialty training in Toxicology Applied to Health Surveillance at Ensp/Fiocruz; military pharmacist at HNMD. 7. Specialty training in Immunohematology at UFRJ; military personnel at HNMD.
ABSTRACT
Introduction: Eficient laboratory services are the basis of modern health systems. Scientiic innovations have contributed to substantial improvements in the laboratory environment, but errors still persist. These errors are classiied as pre-analytical, analytical and post-analytical, according to the time of occurrence. Objective: To evaluate the frequency of pre-analytical errors in the clinical laboratory service of a military hospital. Methods: A total of 329,582 tests were performed in the clinical laboratory of Hospital Naval Marcílio Dias (HNMD) from August to October 2012, and pre-analytical errors were documented. Results: The most frequent cause of the observed pre-analytical errors was hemolysis (27.54%), followed by samples not received (25.43%) and insuficient sample volume (18.49%). The samples from the Integrated Home Care Service (SIAD) showed the highest frequency of errors (3.38%), followed by those from the inpatient (0.76%) and the outpatient departments (0.21%). Conclusion: Our study demonstrates the importance of managing laboratory pre-analytical quality in order to ensure service excellence.
Key words: laboratory error; clinical laboratory; quality; laboratory indicators.
INTRODUCTION
Laboratory processing consists of a sequence of procedures that begins with the ordering of tests by physicians, and ends with the interpretation – also by physicians – of the test results. The three phases of this cycle – pre-analytical, analytical and post-analytical – are subject to innumerable possibilities of error that affect quality and reliability of results(12). According to ISO/
TS 22367:2008, laboratory error may be deined as any defect during the laboratory cycle, resulting from a badly-planned action or a non-achieved aim, which may occur from ordering tests to interpreting their results(9, 14).
The pre-analytical phase comprises all the processes occurring before the sample is processed in the analyzer. In this phase one may observe the highest frequency of errors, the highest risk to professionals’ health and the highest rates of human error. Studies indicate that approximately 40% to 70% of errors occur in the pre-analytical phase(1, 3, 7, 8, 15, 16, 21).
Errors in this phase generally occur from high personnel turnover rates, negligence, lack of understanding about good laboratory practices, and ineffective training(8, 12). They include
inappropriate test request, inadequate samples, delays in transport or inappropriate storage, illegible requisitions, improper venipuncture, inadequate instructions to patients (as to previous
fasting, special diet, medicine use, etc.), incorrect identiication of samples, insuficient sample volume, among others(4, 15, 21, 22). Such
errors normally lead to sample rejection, and consequently, they produce insecurity, dissatisfaction, inconvenience and anxiety, in both doctors and patients; unnecessary costs; prolonged turnaround time; rework; loss of laboratory credibility and loss of conidence in the laboratory. Dificulties to control pre-analytical variables and to make process improvements are possible causes for the high prevalence of errors in this phase.
In the health area, quality philosophy does not differ from that applied to industries. Adequacy of the product or service to meet customer needs is a fundamental element of quality, perfectly applicable to the several health care services(14). Provision of good
services implies two basic components of quality: the operational, which corresponds to the process itself; and the perception, or how clients perceive the offered service. These components may be measured by quality indicators (QIs), and recognition is obtained through certiication and accreditation processes(14).
QIs allow for internal and external comparisons with other services sharing the same characteristics. They are called, in quality management, control items(21).
OBJECTIVE
The main purpose of this study is to assess the frequency of pre-analytical errors occurring at the clinical laboratory service of Hospital Naval Marcílio Dias (HNMD) in the divisions of hematology, immunology/hormones, biochemistry, parasitology and microbiology. The study also aims at assessing the frequency of errors from different sources: outpatient and inpatient departments, and Integrated Home Care Service (SIAD).
METHODS
Research site
HNMD is a general hospital providing care in approximately 41 specialties. Patients come from the Navy Health System, comprising active duty, retired military personnel, and their dependents. The hospital offers 507 beds, diverse services (dentistry, physical therapy, radiodiagnosis, clinical pathology, anatomical pathology, etc.), modern facilities and a highly skilled clinical
staff.
The clinical laboratory service is part of this structure, with a team of phlebotomists qualiied for the collection of blood samples.
The laboratory monthly performs 19,500 blood collections and 11,000 exams in the areas of hematology, biochemistry, urinalysis, microbiology, immunology and parasitology. The service operates 24 hours a day, seven days a week, including inpatient ward, emergency department, urgent care, and integrated home care for the elderly and/or those experiencing degenerative diseases. The different divisions are supplied with modern equipment, acquired under a commodate contract, and represent the state of the art in terms of technology and operational capacity.
The laboratory process is daily monitored by internal quality controls, and monthly monitored by proiciency testing by the Sociedade Brasileira de Patologia e Medicina Laboratorial (SBPC/Controllab). After technical validation, all the results are transmitted electronically to the several clinics of the hospital.
All the laboratory divisions have standard operating procedures (SOPs) for their different processes. SOPs are periodically updated.
Criteria for inclusion of data and parameters
The data derived from pre-analytical errors were obtained by analysis of sample rejections and requests of new sample collection for tests in the divisions of immunology/hormones, biochemistry, hematology, parasitology, and microbiology. Data were gathered from August to October 2012. The members of each division were in charge of the criteria for sample acceptability/rejection, based on the internal quality program of the clinical laboratory service.
The rejection criteria in clotted, hemolyzed and lipemic samples were visually applied. Only the clotted samples collected in tubes with ethylenediaminetetraacetic acid (EDTA) and sodium citrate were counted. The samples considered with insuficient volume were those presenting volume lower than the necessary for the conduction of a speciic test, previously standardized and/or by consensus of the laboratory staff in this hospital.
The rejection criteria used in this work were: • total of clotted samples;
• samples affected by an accident; • insuficient sample volume; • hemolyzed serum or plasma; • result conirmed by the technical staff; • clotted material;
• material collected in an inappropriate tube; • material lost/not received;
These criteria were selected after consecutive meetings with professionals involved in the quality management of the clinical laboratory service at HNMD.
Statistical analysis
The statistical analysis was performed using the program Excel, and the graphs were generated by the program Prism. Frequency and percentage were obtained using univariate analysis. Results were expressed as percentage (%).
Limitations of the study
Data derived from the emergency department could not be computed due to limitations in our laboratory information system. This happened because the ordering of new sample collection created an outstanding issue, interfering with the average release time of results from this source.
RESULTS
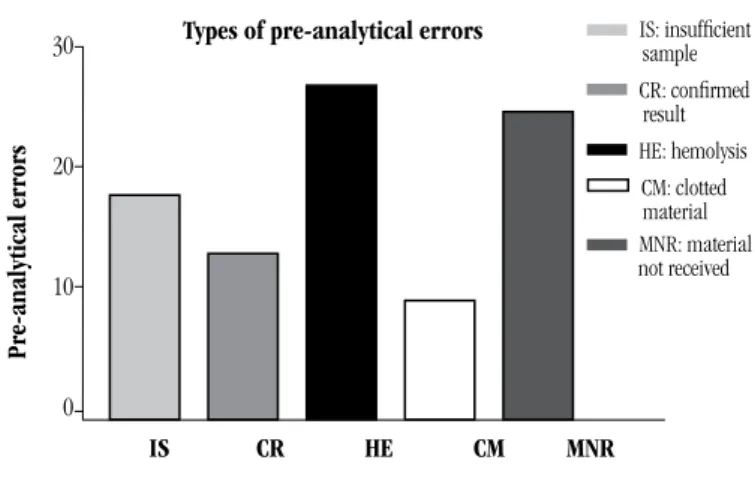
A total of 329,582 exams were conducted in the period of this study, of which 806 presented some type of pre-analytical error (0.25%). The three main observed causes of pre-analytical errors were hemolysis (27.54%), material not received (25.43%) and insuficient sample volume (18.49%) (Table).
TABLE – Absolute and relative error frequency, by cause
F Total of
exams F%
% Pre-analytical error
Accident in the division 27 329,582 0.01 3.35 Insuficient sample volume 149 329,582 0.05 18.49
Result conirmed 108 329,582 0.03 13.4
Hemolysis 222 329,582 0.07 27.54
Clotted material 79 329,582 0.02 9.8
Material not received 205 329,582 0.06 25.43
Others 16 329,582 0.01 1.99
Total 806 329,582 0.25 100
F: absolute frequency; F%: relative frequency.
When analyzing error frequency per source, we veriied that the outpatient service carried out 153,460 tests, with 329 presenting pre-analytical errors (0.21%). The inpatient service carried out 44,469 tests, and the absolute error frequency was 336 (0.76%). The SIAD was responsible for 975 tests, whose pre-analytical errors amounted to 33 (3.38%) (Figure 1).
FIGURE 1 – Relative frequency of pre-analytical errors, by source, compared to the limits accepted in the program Q-PROBE
% Pre-analytical errors, by source
% Errors
OP IP Q-PROBE SIAD
4
3
2
1
0
OP: outpatient IP: inpatient Q-PROBE: The College of American Pathologists Quality Assurance Program
SIAD: Integrated Home Care Service
Pre-analytical errors
30
20
10
0
FIGURE 2 – Relative frequency of the main pre-analytical errors
Types of pre-analytical errors
IS CR HE CM MNR
IS: insuficient sample
CR: conirmed
result HE: hemolysis
CM: clotted
material
MNR: material not received
DISCUSSION
The relative error frequency in our study is in accordance with the international literature: 0.25%. It contrasts with 1.52% of Chawla et al.(4), 0.74% of Stark et al.(12),and 1.4% of Goswami
et al.(6). The College of American Pathologists Quality Assurance Program (Q-Probe)(5) has xreported xsample/specimen rejection
ranging from 0.3% to 0.83% (Figure 2).
We must draw attention to the variety of methods adopted in the several studies, as well as the different ways to quantify these nonconformities: parts per million (ppm) in the studies by Plebani, Zago and Carraro; accumulated and relative frequency in the studies by Chawla, Stark and Goswami. Still, there are some authors who count rejected samples(4, 6, 7), other rejected tests,
or tests with nonconformities(20). In our study, due to questions
These method differences decrease the “power” of comparison between studies, and relect structural differences between diverse laboratories. Attempts at standardization have been the object of study by various societies of laboratory medicine (College of American Pathologists, Sociedade Brasileira de Patologia e Medicina Laboratorial, Sociedade Brasileira de Análises Clínicas), but the search for laboratory QIs still remains(21).
The chief cause of error in the pre-analytical phase was hemolysis, conirming the studies by Chawla(4) and Stark(20).
Hemolysis is responsible for the rejection of countless exams, like lactate dehydrogenase (LDH), acid phosphatase, and potassium tests, aspartate transaminase (AST), alanine transaminase (ALT), prothrombin time (PT), activated partial thromboplastin time (aPTT), among others(11, 13, 17, 23). According to Jacobs et al.(10), the
estimated cost of repeating hemolyzed specimens is approximately €4355 per month, plus additional time and use of equipment, based on an average of 60 admissions/day. Factors related to the collection of diagnostic blood specimens, such as maximum time for tourniquet application, inadequate constriction of the forearm muscles, adequateselection of the needle gauge for venipuncture, may increase the incidence of hemolysis, and, consequently, sample rejection(12).
To our surprise, material not received was the second cause of errors, resulting in 25.45% of pre-analytical errors in this study. Although this QI is not found in the literature, we decided to include it after discussions about the most appropriate indicators for our routine. We defend that this QI works as a process indicator that will bring us information on collection, as a not received blood specimen will forcefully generate an order for new collection. The lack of a speciic division for receiving and distributing samples, the low automation of the pre-analytical phase in our routine, and the low level of integration in the divisions of our laboratory may be possible causes for this discrepancy(2).
Insuficient sample volume was the third cause of error, responsible for 18.49% of pre-analytical errors. In the study by Guimarães et al.(7), this cause took second place, representing
24% of total pre-analytical errors. We point up that this study was also conducted in Brazil, in a hospital laboratory similar to ours.
In the study by Stark et al.(20), the relative frequency of error due to
insuficient sample volume was 1.2%, very different from the one in our study and from those in most studies in this area. This piece of data may relect how dificult collection of the blood specimen is from hospitalized patients, or outpatients under chemotherapy, as it is in our routine, although we cannot afirm it conidently, once it is not the aim of our study.
SIAD presented the greatest frequency of errors, followed by inpatient and outpatient services, respectively. The high rate of errors in the SIAD source may result from several factors, like insuficient training of phlebotomist/nursing staff about the best practices of blood collection, the increased prevalence of elderly patients or patients with chronic degenerative diseases with dificult venous access, or inadequate transport of samples from patients’ home to HNMD laboratory. We must underline that this service is provided by a third-party company, but under the complete responsibility of HNMD.
We emphasize that there is no reference in the literature to the percentage of pre-analytical errors derived from the home care service, as it is the case of SIAD, nor from a so stratiied sample of patients: elderly people, and with chronic degenerative diseases. In the future, this may become a public health problem, as our population ages.
CONCLUSION
In spite of the technological improvements in laboratory medicine, the pre-analytical phase is still the main responsible for
laboratory errors(1, 3, 4, 6-8, 12, 15, 16, 20, 21). In our study, we demonstrated
that the frequency of pre-analytical errors in our laboratory routine (0.25%) is in accordance with the international scientiic literature. However, when analyzing the different sources of these errors, we observe that SIAD presented the major rate of errors, falling outside the internationally accepted range. This is the irst study to analyze the pre-analytical errors arising from a home care service, reinforcing the need of constant training for all the
laboratory team members.
RESUMO
Introdução: Serviços laboratoriais efetivos são a base dos sistemas de saúde modernos. Inovações científicas têm contribuído
REFERENCES
1. BONINI, P. et al. Errors in laboratory medicine. Clin Chem, v. 48, n. 5, p. 691-8, 2002. Available at: <http://www.ncbi.nlm.nih.gov/ pubmed/11978595>.
2. CAMPANA, G. A.; OPLUSTIL, C. P.; FARO, L. B. D. Tendências em medicina laboratorial. J Bras Patol Med Lab, v. 47, n. 4, p. 399-408, 2011. 3. CARRARO, P.; PLEBANI, M. Errors in a stat laboratory: types and frequencies 10 years later. Clin Chem, v. 53, n. 7, p. 1338-42, 2007. Available at: <http://www.ncbi.nlm.nih.gov/pubmed/?term=Errors+in +a+stat+laboratory%3A+types+and+frequencies+10+years+later>. Accessed on: March 27, 2012.
4. CHAWLA, R. et al. Identiication of the types of preanalytical errors in the clinical chemistry laboratory: 1-year study at G.B. Pant Hospital. Lab Medicine, v. 41, n. 2, p. 89-92, 2010. Available at: <http:// labmed.ascpjournals.org/content/41/2/89.abstract>. Accessed on: April 13, 2012.
5. COLÉGIO AMERICANO DE PATOLOGISTAS. Available at: <www.cap.org/>. 6. GOSWAMI, B.; SINGH, B.; CHAWLA, R. Evaluation of errors in a clinical laboratory: a one-year experience. Clin Chem Lab Med, v. 48, n. 418, p. 63-6, 2010.
7. GUIMARÃES, A. C. et al. Causes of rejection of blood samples handled in the clinical laboratory of a University Hospital in Porto Alegre. Clin Biochem, v. 45, n. 1-2, p. 123-6, 2012. Available at: <http://www. sciencedirect.com/science/article/pii/S0009912011026956>.
8. GUIMARÃES, A. C. et al. O laboratório clínico e os erros pré-analíticos. Rev HCPA, v. 31, n. 1, p. 66-72, 2011.
9. ISO/TS 22367:2008. Medical laboratories – Reducing error through risk management and continual improvement – Complementary element. European Committe for Standardization, p. 1-10, 2010. 10. JACOBS, P.; COSTELLO, J.; BECKLES, M. Cost of haemolysis. Ann Clin Biochem, v. 49, Pt 4, p. 412, 2012. Available at: <http://www.ncbi.nlm. nih.gov/pubmed/22535866>. Accessed on: November 22, 2012. 11. LAGA, A. C.; CHEVES, T. A.; SWEENEY, J. D. The effect of specimen hemolysis on coagulation test results. Am J Clin Pathol, v. 126, n. 5,
MAILING ADDRESS
Fabio Triachini Codagnone
Hospital Naval Marcílio Dias; Rua César Zama, 185; Lins de Vasconcelos; CEP: 20725-090; Rio de Janeiro-RJ, Brazil; e-mail: [email protected]. p. 748-55, 2006. Available at: <http://www.ncbi.nlm.nih.gov/ pubmed/17050072>. Accessed on: November 21, 2012.
12. LIMA-OLIVEIRA, G. D. S. et al. Controle da qualidade na coleta do espécime diagnóstico sanguíneo: iluminando uma fase escura de erros. J Bras Patol Med Lab, v. 45, n. 6, p. 441-7, 2009.
13. LIPPI, G. et al. Interference of blood cell lysis on routine coagulation tests. Arch Pathol Lab Med, v. 130, n. 2, p. 181-4, 2006.
14. MENDES, M. E. Avaliação da implantação de um sistema de
qualidade em laboratório clínico público. 1998. Tese (Doutoramento)
– Faculdade de Medicina, Universidade de São Paulo, São Paulo, 1998. 15. PLEBANI, M. Quality indicators to detect pre-analytical errors in laboratory testing. Clin Biochem Rev, v. 33, n. 3, p. 85-8, 2012. 16. PLEBANI, M.; CARRARO, P. Mistakes in a stat laboratory: types and frequency. Clin Chem, v. 43, n. 8 Pt 1, p. 1348-51, 1997. Available at: <http://www.ncbi.nlm.nih.gov/pubmed/9267312>.
17. SMITH, R. T. Effect of in vitro hemolysis on assay of plasma catecholamines and DOPA centrifugation. Clin Chem, v. 26, n. 9, p. 1354-6, 1980.
18. SOCIEDADE BRASILEIRA DE ANÁLISES CLÍNICAS. Available at: <http://www.sbac.org.br/>.
19. SOCIEDADE BRASILEIRA DE PATOLOGIA E MEDICINA LABORATORIAL. Available at: <http://www.sbpc.org.br/>.
20. STARK, A. et al. Clinical laboratory specimen rejection--association with the site of patient care and patients’ characteristics: indings from a single health care organization. Arch Pathol Lab Med, v. 131, n. 4, p. 588-92, 2007. Available at: <http://www.ncbi.nlm.nih.gov/pubmed/17425389>. 21. VIEIRA, K. F. et al. A utilidade dos indicadores da qualidade no gerenciamento de laboratórios clínicos. J Bras Patol Med Lab, v. 47, n. 3, p. 201-10, 2011.
22. WIANS, F. H. Clinical laboratory tests: which, why, and what do the results mean? Lab Medicine, v. 40, n. 2, p. 105-13, 2009. Available at: <http://labmed.ascpjournals.org/content/40/2/105.abstract>. Accessed on: April 13, 2012.
23. YÜCEL, D.; DALVA, K. Effect of in vitro hemolysis on 25 common biochemical tests. Clin Chem, v. 38, n. 4, p. 575-7, 1992. Available at: <http://www.ncbi.nlm.nih.gov/pubmed/1568325>.
laboratório de análises clínicas do Hospital Naval Marcílio Dias no período de agosto a outubro de 2012, e os erros pré-analíticos documentados. Resultados: Os erros pré-analíticos mais observados foram decorrentes da hemólise (27,54%), seguidos de material não recebido (25,43%) e amostra insuficiente (18,49%). As amostras oriundas do Serviço Integrado de Atendimento Domiciliar (SIAD) foram as que apresentaram a maior frequência de erros (3,38%), seguidas pelo setor de pacientes internos (0,76%) e ambulatoriais (0,21%), respectivamente. Conclusão: Nosso estudo demonstra a importância da gestão da fase pré-analítica na garantia da qualidade laboratorial, de maneira a assegurar um serviço de excelência.