215
Antioxidant activity of bee products added to water in
tebuconazole-exposed fish
Daiane Ferreira
1, Taís Cristina Unfer
1, Hélio Carlos Rocha
2, Luiz Carlos Kreutz
2, Gessi
Koakoski
1and Leonardo José Gil Barcellos
2An experiment was conducted to evaluate the potential of honey, propolis, and bee pollen for the reversal of lipid peroxidation induced by tebuconazole (TEB) in South American catfish (Rhamdia quelen), in which the concentration of thiobarbituric acid reactive substances (TBARS), the activity of the antioxidant enzyme glutathione-S-transferase (GST) and the concentrations of non-enzymatic antioxidants, reduced glutathione (GSH), ascorbic acid, and non-protein thiols were assessed. Honey (0.125 g L-1) and bee pollen (0.05 g L-1) added to the water reverse the production of TBARS induced by TEB, while propolis demonstrated a pro-oxidant effect, inducing an increase in TBARS production. The data presented herein suggest that the addition of water to honey and bee pollen potentially protects against the oxidative stress caused by agrichemicals. Um experimento foi conduzido objetivando avaliar o potencial do mel, da própolis e do pólen apícola na reversão da peroxidação lipídica causada pelo fungicida tebuconazole (TEB) na espécie de peixe tropical Rhamdia quelen, avaliando a concentração das substâncias reativas ao ácido tiobarbitúrico (TBARS), a atividade da enzima glutationa-S-transferase (GST) e das concentrações dos antioxidantes glutationa reduzida (GSH), ácido ascórbico e dos tiois não proteicos. O mel adicionado à água na concentração de 0,125g L-1 e o pólen apícola na concentração de 0.05 g L-1reverteram a geração das TBARS causada pela exposição ao TEB, enquanto a própolis demonstrou efeito pró-oxidante, induzindo um aumento na geração das TBARS. Os dados apresentados neste trabalho sugerem o potencial do mel e do pólen apícola adicionados à água como substâncias protetoras contra o estresse oxidativo causado por agroquímicos.
Key words: Antioxidants, Bee pollen, Honey, Lipid peroxidation, Propolis, Tebuconazole.
Introduction
Because of the close proximity of agricultural crops to fish farms, some pesticides can reach fish facilities and cause lipid peroxidation with consequent cell damage and loss of function (Ferreira et al., 2010). In this respect, the search for natural antioxidants is justified.
Tebuconazole (TEB) is a potent fungicide that induces oxidative stress in Rhamdia quelen (Ferreira et al., 2010), and its use in agriculture is a source of contaminants to the water used in fish farms. This molecule is an active ingredient used in plant cultures or as wood preservative (Lebokowska et al., 2003), which degrades with short persistence in the environment, and is not bioaccumulative (Milenia®, Brazil).
Oxidative stress occurs when the balance between pro-oxidants and antipro-oxidants is disrupted in favor of the former.
The antioxidant system comprises a group of low molecular weight compounds such as ascorbic acid and reduced glutathione (GSH), one of the most important components in the antioxidant defense of cells (Storey, 1996). Glutathione-S-transferase (GST) is a phase II detoxification enzyme, which catalyzes the conjugation of GSH with a variety of electrophilic compounds. Besides its role as a substrate, GSH acts with a mild reactive oxygen species (ROS), contributing directly to the control of the redox state (Ferreira et al., 2010).
Recent studies have shown intensive research on bee by-products (e.g., honey, bee pollen, and propolis), whose antioxidant properties can be attributed to their content of phenolic substancessuch as flavonoids (Morse, 1990; Angelo & George, 2007; Viuda-Martos et al., 2008; Nakajima et al., 2009).Thus, the aim of the present study was to determine the
1Universidade Federal de Santa Maria, Programa de Pós-Graduação em Farmacologia, Faixa de Camobi, Km 9, Câmpus Universitário,
97105-900 Santa Maria, RS, Brazil.
2Universidade de Passo Fundo, Curso de Medicina Veterinária, Câmpus Universitário do Bairro São José, Caixa Postal 611, 99001-970
antioxidant potential of these bee products, as a counterbalance to the oxidant effect of TEB on R. quelen.
Material and Methods
The experiment was conducted from November to December 2009 in the facilities of Universidade de Passo Fundo, Brazil. Six-month-old juvenile male and female South American catfish , weighing, on average, 115.7 ± 23.3 g (SEM) were used. The fish were distributed in the experimental tanks, exposed to natural photoperiod, and fed twice daily (at 10:00 a.m. and 4:00 p.m.) with commercial extruded feed, 5% of their body weight, prior to the beginning of the experimental period. The water temperature (26 ± 1ºC) and dissolved oxygen concentrations (5.6 to 7.5mg L-1) were measured with a YSI model 550 oxygen meter (Yellow Spring Instruments, USA). The pH values (6.6 to 7.0) (Bernauer pH meter), total ammonia, N (< 0.5mg L-1), total alkalinity (60mg L-1), and hardness (65mg L-1) were also measured (all using colorimetric tests).
Experimental design. The experiment was conducted in 24
tanks with 200 L of water (eight experimental groups with three replicates each). The first group was the control, without any contamination. The second group consisted of artificial contamination with 0.88 mg L-1of TEB (CETM Folicur 200). The third group was characterized by the addition of 0.125 g L-1 of honey (H); the fourth group consisted of TEB contamination plus honey. The fifth group received bee pollen (BP) at a concentration of 0.05 g L-1. The sixth group consisted of TEB contamination plus bee pollen. The seventh group was given 0.01 g L-1 of propolis (PP) and the eighth group was submitted to TEB contamination plus propolis.
The TEB concentration was established based on previous works (Cericato et al., 2008; Kreutz et al., 2008). Because studies using honey, bee pollen, or propolis directly added to water were not found, the concentrations of bee products used in these experiments were arbitrarily determined.
Fish (10 per tank) were kept under these conditions for 96 hours, being fed daily at a rate of 0.75% of their biomass. At the end of this period, samples (kidney, liver, and brain) were collected for specific measurements.
Chemicals and honeybee by-product. The agrichemical used
(tebuconazole) was obtained commercially. 5.5’-dithiobis-(2-nitrobenzoic acid) (DTNB), bovine serum albumin, Triton X100, hydrogen peroxide (H2O2), malondialdehyde (MDA), 2-thiobarbituric acid (TBA), and sodium dodecyl sulfate (SDS) were purchased from Sigma Chemical Co. (St. Louis, MO, USA). Honey, propolis, and bee pollen used in this experiment were produced at Centro de Pesquisa Agropecuária (CEPAGRO) at Universidade de Passo Fundo, Brazil.
Sampling. The fish were anesthetized by the addition of buffer
(NaH2CO3) MS222 (300 mg/l) in the tanks. After loss of orientation and complete immobilization, the fish were caught, killed by decapitation and spinal section, and immediately
dissected for the collection of tissue samples. The liver, kidney, and brain were immediately frozen in liquid nitrogen and stored for further analyses.
Parameters evaluated
Protein determination. The protein levels were estimated
spectrophotometrically by the method of Bradford (1976) using bovine serum albumin as standard.
Oxidative stress parameters.Thiobarbituric acid reactive substance (TBARS) levels: The peroxides produced can be indirectly quantified by a TBARS assay, which is believed to reflect the intensity of lipid peroxidation by quantifying one of its main end products - malondialdehyde (Lushchak et al., 2009). This is performed by a malondialdehyde (MDA) reaction with 2-thiobarbituric acid (TBA), which is optically measured. Tissue samples were homogenized with 10% trichloroacetic acid (TCA) using a motor-driven Teflon pestle and centrifuged at 1,000g for 10 min. Liver homogenates (100– 400 L) were added to 8.1% sodium dodecyl sulfate (SDS), 2.5 M acetic acid (pH 3.4), and 0.8% thiobarbituric acid; the final volume was adjusted to 2.0 mL. The reaction mixture was placed in a microcentrifuge tube and incubated for 90 min at 95 ºC. After cooling, it was centrifuged at 5,000g for 10 min, and optical density was determined at 532 nm. TBARS levels were expressed as nmol MDA per mg of protein, according to Ohkawa et al. (1979). Butylated hydroxytoluene (BHT) was added to the samples before storage to control for further artifactual lipid peroxidation.
Enzymatic defense against xenobiotics.Catalase assay: Catalase (CAT; EC 1.11.1.6) activity was assayed by ultraviolet spectrophotometry (Nelson & Kiesow, 1972). Liver samples were homogenized in a Potter-Elvehjem glass/Teflon homogenizer with 20 mM potassium phosphate buffer, pH 7.4 (with 0.1% Triton X-100 and 150 mM NaCl) (1:20 dilution), centrifuged at 10 000g for 10 min at 4ºC. Briefly, the assay mixture consisted of 2.0 mL potassium phosphate buffer (50 mM, pH 7.0), 0.05 mL H2O2 (0.3 M), and 0.05 mL homogenate. Changes in H2O2 absorbance in 60 s were measured at 240 nm. Catalase activity was calculated in terms of mol mg-1 of protein min-1.
Glutathione-S-transferase: The glutathione S-transferase (GST) activity was determined using the method of Habig et al. (1974). The reaction mixture consisted of 33 mM Hepes buffer (pH 7.5), 1.5 mM GSH, 1.5 mM 1-chloro-2,4-dinitrobenzene (CDNB), and water in a total volume of 1 mL. The conjugation of GSH with CDNB via GST activity was recorded spectrophotometrically at 340 nm during 3 min. The activity was expressed as nmol of CDNB conjugate formed min-1 mg-1 protein.
supernatant were mixed with 250 L of water plus 25 L of 0.02% 2,6-dichlorophenolindophenol and incubated for 1 h at room temperature. After that, 250 L of 2% thiourea and 5% metaphosphoric acid solution plus 250 L of 0.2% dinitrophenylhydrazine in 12 M sulfuric acid were added. The reaction tubes were incubated in a water bath at 60ºC for 3 h. Following the incubation, 500 L of 18 M sulfuric acid was added, and the tubes were centrifuged at 500g for 10 min. The absorbance was read, compared to a standard containing 100 nmol of ascorbic acid, and expressed in mol g-1 of tissue (Carr et al., 1983).
Non-protein thiols: Non-protein thiol levels were determined in the liver by the method of Ellman et al. (1961) Tissue (100 mg) was precipitated with Tris HCl 50 mM (pH 7.5), followed by centrifugation at 3,000g for 10 min. An aliquot of the supernatants (1.0 mL) mixed with 10% TCA was centrifuged and then a new aliquot of this supernatant (400 L) was used for determination with 10 mM of 5,5’-Dithiobis(2-nitrobenzoic acid) (DTNB), 0.5 mM phosphate buffer (pH 6.8), 0.5 mM cysteine ,and the reaction was followed at 412 nm. Non-protein thiol levels were expressed as mol SH g-1 of liver.
Reduced glutathione (GSH): GSH levels were determined by the method of Ellman (1959). Supernatants (0.25 mL) were used for determination with 5,50-dithio-bis(2-nitrobenzoic acid) 10 mM (DTNB) (0.05 mL) and phosphate buffer 0.5 mM (pH 6.8) (0.7 mL). The optical density of reaction product was read at 412 nm on a spectrophotometer, and results were expressed as mol GSH g-1 of wet tissue.
Statistics. The mean ± SEM of each group was calculated, and
ANOVA followed by Dunnet’s test was used to compare each value against the control value using the GraphPad InStat 3.00 statistical package (GraphPad Software, San Diego, California, USA). Statistical significance was accepted at p < 0.05. Hartley’s test was carried out to verify the homogeneity of variance, and normality was tested using the Kolmogorov-Smirnov test.
Results and Discussion
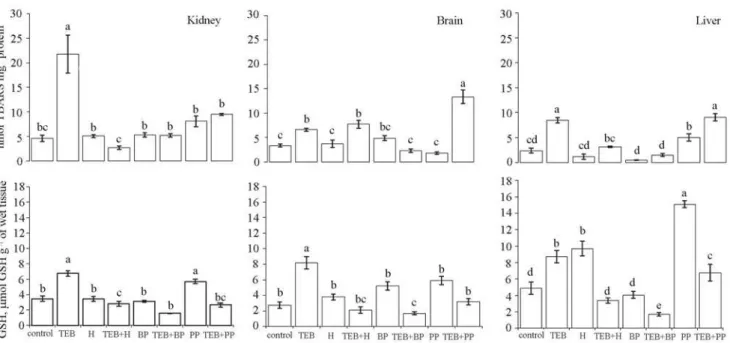
The determination of TBARS levels has often been used as a biomarker of toxic pollutants in fish (Livingstone, 2001; Crestani et al., 2007; Glusczak et al., 2007). In the present study, we observed that the exposure of South American catfish (Rhamdia quelen) to TEB caused oxidative damage to lipids, characterized by an increase in the lipid peroxidation of the analyzed tissues (Fig. 1). Earlier studies demonstrated that there was an increase in the oxidative stress in South American catfish (Ferreira et al. 2010) and carp (Cyprinus carpio) (Toni et al., 2011) exposed to TEB for 96 h. Ahmad et al. (2004) reported that lipid peroxidation is one of the major processes induced by oxidative stress, observed in several fish species, resulting from exposure to xenobiotics such as pesticides, fungicides, and herbicides.
Glutathione is a tripeptide that is actively present in cells in its reduced form (GSH). One of the roles of GSH is the removal of free radicals, and this process acts as defense
against potentially harmful oxidant and xenobiotic molecules (Lee & Anderson, 2005). In TEB-exposed fish, we noticed an increase in GSH levels in all tissues (Fig.1). Non-protein thiol (NPSH) levels increased only in the kidneys and brains of exposed animals (Table 1). It is widely known that most of the NPSH content is made up of GSH (Cnubben et al., 2001). However, GSH and NPSH were measured separately in order to improve the reliability of the responses to TEB. As a matter of fact, we noted that GSH levels seemed to be more representative than antioxidant effects. Moreover, GSH undergoes oxidation after being conjugated in a redox process and is converted again to its reduced form in adaptive responses (Lee & Anderson, 2005). In addition, NPSH levels may be suppressed for being compromised in adaptive mechanisms of the redox system as a whole (Torres et al., 2004; Lee & Anderson, 2005).
Glutathione-S-transferase (GST) activity increased significantly in the liver of R. quelen exposed to TEB (Table 1). This probably occurs because the liver is the metabolic center for detoxification and because GST catalyzes the GSH conjugation with xenobiotics to facilitate excretion, thus contributing to antioxidant defenses (Torres et al., 2004).
Interestingly, we perceived that ascorbic acid (vitamin C) levels increased in the kidney and decreased in the brain of R. quelen in the presence of TEB (Table 1). Ascorbic acid turns reactive oxygen species (ROS) into harmless species, acting as an in vivo antioxidant and thus preventing chain auto-oxidation reactions (Toni et al., 2011).
Honey is one of the most largely consumed bee products and is known for its curative properties. In our study, the exposure of R. quelen to honey did not alter TBARS levels in any of the analyzed tissues (Fig.1). When honey was added to the water exposed to TEB, we observed that lipid peroxidation decreased in the liver and kidney, showing the capacity of honey to reverse the oxidative damage of TEB to lipids. Furthermore, GSH levels were high in South American catfish exposed to honey (Fig.1). In TEB+H exposure, GSH levels dropped in all analyzed tissues. Our assumption is based on the likely participation of glutathione in the reversal of oxidative damage of the lipid peroxidative cascade (Lee & Anderson, 2005).
GST and ascorbic acid levels were inconclusive in our study, with no clear tendency, but the data indicate that bee products have an effect on these parameters. The liver is the metabolic center for detoxification and some authors suggest that changes are essential for the metabolism and excretion of toxic substances in fish (Hinton et al., 2001; Crestani et al., 2007; Cattaneo et al., 2008; Melo et al., 2008). Therefore, the presence of bee product extracts, despite the antioxidant potential observed in this study, could affect the same metabolic processes in the liver.
Fig. 1. Levels of TBARS (nmol MDA mg-1 protein) and GSH (mol GSH g-1 of wet tissue) in Rhamdia quelen after exposure to 16.6% of LC50 of tebuconazole, to bee product, and to tebuconazole + bee product for 96 h. Different small letters indicates statistical differences between the means (ANOVA followed by Tukey´s multiple range test). Mean ± SEM; n = 10. * P < 0.05.
CONTROL TEB H TEB+H BP TEB+BP PP TEB+PP
Kidney
GST 0.52 ± 0.06ª 0.68 ± 0.08ª 0.58 ± 0.09ª 0.52 ± 0.11ª 0.25 ± 0.04b 0.04 ± 0.01c 0.53 ± 0.14ª 0.20 ± 0.03b
Non protein thiols 0.43 ± 0.07b 0.92 ± 0.08ª 0.48 ± 0.05ab 0.80 ± 0.13ª 0.59 ± 0.15ab 0.38 ± 0.06b 0.85 ± 0.15ª 0.41 ± 0.06b
Ascorbic Acid 1.75 ± 0.22b 0.71± 0.06c 2.12 ± 0.39b 1.80 ± 0.28b 8.55 ± 0.47ª 2.97 ± 0.13b 1.02 ± 0.07b 0.69 ± 0.07c
Brain
GST 0.62 ± 0.12b 0.68 ± 0.09ab 1.16 ± 0.11ª 0.99 ± 0.23ª 0.61 ± 0.06b 0.55 ± 0.09b 0.33 ± 0.05b 1.00 ± 0.10ª
Non protein thiols 0.71 ± 0.03b 1.02 ± 0.05ª 0.65 ± 0.08b 0.51 ± 0.11bc 0.40 ± 0.06c 0.51 ± 0.09bc 0.78 ± 0.13b 0.57 ± 0.09bc
Ascorbic Acid 0.59 ± 0.07b 2.14 ± 0.19ª 0.51 ± 0.10b 1.90 ± 0.27ª 1.47 ± 0.36ab 2.70 ± 0.50ª 0.65 ± 0.05b 1.55 ± 0.16ab
Liver
GST 0.39 ± 0.05b 1.65 ± 0.29ª 1.00 ± 0.21ab 2.23 ± 0.45ª 0.65 ± 0.07ab 0.47 ± 0.13b 2.05 ± 0.21ª 0.54 ± 0.11b
Non protein thiols 0.94 ± 0.13ª 0.98 ± 0.06ª 1.07 ± 0.13ª 0.65 ± 0.11ab 0.98 ± 0.19a 0.48 ± 0.06b 1.13 ± 0.06ª 0.89 ± 0.12ª
Ascorbic Acid 1.08 ± 0.07c 2.24 ± 0.14b 0.92 ± 0.16c 1.76 ± 0.20bcd 8.34 ± 0.36a 2.64 ± 0.16b 2.38 ± 0.24b 0.76 ± 0.03d
Table 1. Glutathione-S-transferase, non protein thiols and ascorbic acid in Rhamdia quelen exposed to tebuconazole, honey, propolis or bee pollen and the combination of bee products and the fungicide. Different small letter after the means indicates significant difference, ANOVA followed by Tukey’s multiple range test, P<0.05, n = 10. Units: glutathione S-transferase, Pmol GS-DNB min-1 mg protein-1; reduced glutathione, mol GSH g-1 of wet tissue; non protein thiols, mol SH g-1 of tissue; ascorbic acid, mol g-1 of tissue. Different small letters indicates statistical differences between the means (ANOVA followed by Tukey´s multiple range test)
quelen exposed to TEB+BP, probably because GSH was used again for reversal of oxidative damage to lipids (Fig.1). Apparently, exposure to contaminants leads to rapid thiol depletion in several processes, such as peroxidation, conjugation, glutathiolation, and neutralization, and later, through adaptive responses, the exposure increases the levels of these compounds (Lee & Anderson, 2005).
We noted that ascorbic acid levels exposed to BP were higher than in controls, mainly in the liver and kidneys, probably indicating high metabolism of both organs compared to the relatively low kinetic parameters of the brain.
Phenolic substances are the active compounds most commonly found in natural products (Rhodes, 1996). As natural antioxidants, they can play a crucial physiological role by minimizing oxidative damage to animal tissues (Sant’Ana & Mancini Filho, 1999; Melo & Guerra, 2002). Honey, as a source of antioxidants, has been reported to be efficient against oxidative processes (Chen et al., 2000; McKibben & Engeseth, 2002). In addition to polyphenols, propolis contains a wide range of other compounds that are able to remove excess free radicals (Marquele et al., 2005). The biological activity of honey and of its by-products is also related to its floral origin (Barth, 2004). Another important remark concerns the doses of bee products used. As we used a single dose, lower concentrations could produce similar effects.
In conclusion, the data clearly suggest the potential of honey and bee pollen as protective agents against the oxidative damage induced by tebuconazole. Our main assumption is that the major antioxidant mechanism of bee products, reducing the lipid peroxidation induced by TEB, is associated with the recycling of glutathione. Future studies should focus on some issues such as the differences between bee products of different botanical and climatic regions and the validation for the use of bee products as protective agents on a commercial scale, mainly in agricultural regions where pesticide contamination is common.
Literature Cited
Ahmad, I., M. Pacheco & M. A. Santos. 2004. Enzymatic and enzymatic antioxidants as an adaptation to phagocytes induced damage in Anguilla anguilla L. following in situ harbor water exposure. Ecotoxicology Environmental Safety, 57: 290-295. Ângelo, P. M. & N. Jorge. 2007. Compostos fenólicos em alimentos
-Uma breve revisão. Revista do Instituto Adolfo Lutz, 66: 232-240. Barth, O. M. 2004. Melissopalynology in Brazil: a review of pollen analysis of honeys, propolis and pollen loads of bees. Scientia Agrícola, 61: 342-350.
Bradford, M. M. 1976. A rapid and sensitive method for the quantitation of microgram quantities of protein utilizing the principle of protein-dye binding. Analytical Biochemistry, 72: 248-254. Carr, R. S., M. B. Bally, P. Thomas & J. M. Neff. 1983. Comparison
of methods for determination of ascorbic acid in animal tissues. Analytical Chemistry, 55: 1229-1232.
Cattaneo, R., V. L. Loro, R. Spanevello, F. A. Silveira, L. Luz, D. S. Miron, M. B. Fonseca, B. S, Moraes & B. Clasen. 2008. Metabolic and histological parameters of silver catfish (Rhamdia
quelen) exposed to commercial formulation of
2,4-dichlorophenoxiacetic acid (2,4-D) herbicide. Pesticide Biochemistry Physiology, 92: 133-137.
Cericato, L., J. G. M. Neto, M. Fagundes, L. C. Kreutz, R. M. Quevedo, J. Finco, J. G. S. Rosa, G. Koakoski, L. Centenaro, E. Pottker, D. Anziliero & L. J. G. Barcellos. 2008. Cortisol response
to acute stress in jundiá Rhamdia quelen acutely exposed to
sublethal concentrations of agrichemicals. Comparative and Biochemistry Physiology part C, 148: 281-286.
Chen, L., A. Mehta, M. Berenbaum, A. R. Zangerl & N. J. Engeseth. 2000. Honey from differents floral sources as inhibitors of enzimatic browning in fruit and vegetable homogenates. Journal of Agricultural and Food Chemistry, 48: 4997-5000.
Cnubben, N. H. P., I. M. C. M. Rietjens, H. Wortelboer, J. Zanden & P. J. Bladeren. 2001. The interplay of glutathione-released process in antioxidant defense. Environmental Toxicology and Pharmacology, 10: 141-152.
Crestani, M., C. Menezes, L. Glusczak, D. S. Miron, R. Spanevello, A. Silveira, F. F. Goncalves, R. Zanella & V. L. Loro. 2007. Effect of clomazone herbicide on biochemical and histological aspects of silver catfish (Rhamdia quelen) and recovery pattern. Chemosphere, 67: 2305-2311.
Ellman, G. L. 1959. Tissue sulfhydryl groups. Archives of Biochemistry, 82: 70-77.
Ellman, G. L., K. D. Courtney & V. Andres Jr. 1961. A new and rapid colorimetric determination of acetylcholinesterase activity. Biochemistry and Pharmacology, 7: 88-95.
Ferreira, D., A. C. Motta, L. C. Kreutz, C. Toni, V. L. Loro & L. J. G. Barcellos. 2010. Assessment of oxidative stress in Rhamdia
quelen exposed to agrichemicals. Chemosphere, 79: 914-921.
Glusczak, L, D. S. Miron, B. S. Moraes, R. R. Simões, M. R. C. Schetinger, V. M. Morsch & V. L. Loro. 2007. Acute effects of glyphosate herbicide on metabolic and enzymatic parameters of silver catfish (Rhamdia quelen), Comparative Biochemistry Physiology, 146: 519-524.
Habig, W. H., M. J. Pabst & W. B. Jacoby. 1974. Glutathione S-transferase, the first enzymatic step in mercapturic acid formation. Journal of Biology and Chemistry, 249: 7130-7139. Hinton, D. E., H. Segner & T. Braunbeck. 2001. Toxic responses of the liver. In: Daniel, S. & Benson, W. H. (Eds.), Target Organ Toxicity in Marine and Freshwater Teleosts, 1: 225-266. Kreutz, L. C., L. J. G. Barcellos, T. O. Silva, D. Anziliero, D.
Martins, M. Lorenson, A. Marteninghe & L. B. Silva. 2008. Acute toxicity testing of agricultural pesticides on silver catfish (Rhamdia quelen), fingerlings. Ciência Rural, 38: 1050-1055. Lebokowska, M., M. Z. Radziwill, A. R. Narozniak & S. Kobiela.
2003. Toxicity assessment of wood preservatives.
Environmental International,28: 801-802.
Lee, R. F. & J. W. Anderson. 2005. Significance of cytochrome P450 system responses and levels of bile fluorescent aromatic compounds in marine wildlife following oil spills. Marine Pollution Bulletin, 50: 705-723.
Leja, M., A. Mareczek, G. Wyzgolik, J. Klepacz-Baniak & K. Czekonska. 2007. Food Chemistry, 100: 237-240.
Livingstone, D. R. 2001. Contaminant-stimulated Reactive Oxygen Species Production and Oxidative Damage in Aquatic Organisms. Marine Pollution Bulletin, 42: 656-666.
Lushchak, O. V., O. I. Kubrak, J. M. Storey, K. B. Storey & V. I. Lushchak. 2009. Low toxic herbicide roundup induces mild oxidative stress in goldfish tissues. Chemosphere, 76: 932-937. Marquele, F. D. I., V. M. Mambro, S. R. Georgetti, R. Casagrande, Y. M. Valim & M. J. Fonseca. 2005. Assessment of the antioxidant activities of Brazilian extracts of propolis alone and in topical pharmaceutical formulations. Journal of Pharmaceutical
and Biomedical Analysis,39: 455-462.
McKibben, J. & Engeseth, N. J. 2002. Honey as a protective agent against lipid oxidation in ground turkey. Journal of Agricultural and Food Chemistry, 50: 592-595.
Melo, G. C., L. Donatti, C. A. M. Rudniki & E. Fanta. 2008. Hepatic alterations in the fish Rhamdia quelen contaminated with Folidol 600. Ecotoxicology Environmental Safety, 71: 821-829. Melo, E. A. & N. B. Guerra. 2002. Ação antioxidante de
compos-tos fenólicos naturalmente presentes em alimencompos-tos. Boletim
Milenia Agrociências S.A. http://www.milenia.com.br, available on line. Downloaded at May 2008.
Morse, R. A. 1990. ABC and XYZ of Bee Culture. Santo Antonio: A. I. Root Company, 516p.
Nakajima, Y., K. Tsuruma, M. Shimazawa, S. Mishima & H. Hara. 2009. Comparison of bee products based on assays of antioxidant capacities. BMC Complementary and Alternative Medicine, 9: 4.
Nelson, D. P. & L. A. Kiesow. 1972. Enthalpy of decomposition of hydrogen peroxide by catalase at 25ºC (with molar extinction coefficients of H2O2 solution in the UV). Analytical Biochemistry, 49: 474-478.
Ohkawa, H., N. Ohishi & K. Yagi. 1979. Assay for lipid peroxides in animal tissues by thiobarbituric acid reaction. Analytical Biochemistry, 95: 351-358.
Rhodes, M. J. C. 1996. Physiologically-active compounds in plant food: an overview. Proceedings of the Nutrition Society, 55: 371-384.
Sant´Ana, L. S. & J. Mancini Filho. 1999. Ação Antioxidante de extratos de alecrim (Rosmarinus officinalis L.) em filés de peixe
da espécie pacu (Piaractusmesopotamicus Holmberg). Revista
Brasileira de Plantas Medicinais, 2: 27-31.
Storey, K. B. 1996. Oxidative stress: animal adaptations in nature. Brazilian Journal of Medical and Biological Research,29: 1715-1733.
Toni, C., D. Ferreira, L. C. Kreutz, V. L. Loro & L. J. G. Barcellos. 2011. Assessment of oxidative stress and metabolic changes in
common carp (Cyprinus carpio) acutely exposed to different
concentrations of the fungicide tebuconazole. Chemosphere, 83: 579-584.
Torres, M. C. L., N. F. F. Soares & J. F. Maia. 2004. Parâmetros cinéticos da glutationa s-transferase e sua ativação por extratos de vegetais. Ciência e Tecnologia de Alimentos, 24: 243-248. Viuda-Martos, M., Y. Ruiz-Navajas, J. Fernández-López & J. A.
Pérez-Álvarez. 2008. Functional Properties of Honey, Propolis, and Royal Jelly. Journal of Food Sciences, 73: R117-R124.