2017 | Lavras | Editora UFLA | www.editora.ufla.br | www.scielo.br/cagro
Physicochemical composition and antioxidant potential of bee pollen
from different botanical sources in Alagoas, Brazil
Composição fisico-química e potencial antioxidante de pólen apícola de diferentes origens botânicas em Alagoas, Brasil
Maria Raphaella dos Santos Vasconcelos1, Alysson Wagner Fernandes Duarte2, Elane Pereira Gomes1, Silvio Chagas da Silva3, Ana Maria Queijeiro López1*
1Universidade Federal de Alagoas/UFAL, Instituto de Química e Biotecnologia/IQB, Maceió, AL, Brasil 2Universidade Federal de Alagoas/UFAL, Arapiraca, AL, Brasil
3Universidade Federal de Alagoas/UFAL, Instituto de Ciências da Computação, Maceió, AL, Brasil *Corresponding author: [email protected]
Received in April 2, 2017 and approved in June 22, 2017
ABSTRACT
Bee pollen results from the mixture of pollen and floral nectar with the salivary substances of bees and has increasingly been used as a food with therapeutic properties. In this study, 30 samples of bee pollen from Apis mellifera apiaries in three mesoregions of Alagoas (Brazil) - Mata Atlântica, South Coast and Caatinga, were collected during the dry season of 2008/09 and analysed. Mata Atlântica and Caatinga had good production of bee pollen. In the same season, Mata Atlântica contained a higher diversity of pollen types for feeding bees with a predominance of herbaceous pollen (63%), whereas the Caatinga samples contained monofloral pollen. Physicochemical data were analysed with the nonparametric Kruskal-Wallis statistical test. The Caatinga samples were analysed to determine their contents
of total phenolic compounds (25.85 ± 10.80 mg gallic acid eq/g) and flavonoids (45.62 ± 32.19 mg quercetin eq/g) and their antioxidant
activity (for instance, 70.62 ± 4.50% in the DPPH test), which were possibly affected by the environmental conditions of this biome.
Index terms:Apis mellifera; total phenolics; floral origin.
RESUMO
O pólen apícola resulta da mistura de pólen e néctar floral com substâncias salivares da abelha, e emerge como um alimento com propriedades terapêuticas. Neste trabalho foram analisadas 30 amostras desse material de apiários (Apis mellifera), coletadas durante a estação seca de 2008/09 em três mesorregiões de Alagoas - Mata Atlântica, Costa Sul e Caatinga. A Mata Atlântica e a Caatinga foram regiões boas produtoras de pólen apícola. Na mesma época, a Mata Atlântica apresentou a maior diversidade de tipos de pólen para alimentar abelhas, com predominância de herbáceas (63%), enquanto as amostras de Caatinga foram monoflorais. Os dados físico-químicos foram analisados pelo teste estatístico não paramétrico de Kruskal-Wallis. As amostras da Caatinga se destacaram quanto ao teor de fenóis (25,85 ± 10,80 eq. mg Ácido Gálico/g), flavonoides totais (45,62 ± 32,19 eq. mg Quercetin/g), e atividade antioxidante (através do teste do DPPH, por exemplo, 70,62 ± 4,50%), provavelmente devido à condição ambiental deste bioma.
Termos para indexação:Apis mellifera; fenóis totais; origem floral.
INTRODUCTION
Apiculture meets the requirements of sustainability in the agriculture sector and is one of the few activities in the northeast region of Brazil that represents a new dynamic for income management, since the biome and tropical climate in this area provides food and development conditions for bees throughout the year (Alves; Santos, 2014).
One of the products of apiculture is the staple food for developing larvae, bee pollen, and the human consumption of natural functional/therapeutic products has stimulated its production (Mohdaly et al., 2015; Sattler et al., 2015). Pollen has a high protein content and contains all of the essential
amino acids, 27 minerals (especially potassium, calcium, magnesium, phosphorus, iron and sodium), 18 enzymes (including catalase, amylase and sucrase), antibacterial materials, vitamins, fatty acids, other organic acids, lipids,
flavonoids and carbohydrates (glucose, fructose, sucrose, trehalose, isomaltose, maltose, raffinose, erlose, rhamnose
and melezitose), for a total ca. of 250 substances (Bonvehí; Torrentó; Lorente, 2001; Komosinska-Vassev et al., 2015; Nogueira et al., 2012). Additionally, some compounds found
in this food, such as polyphenols; flavonoids; carotenoids;
hepatoprotective, anti-atherosclerotic and immune enhancing activities require long-term clinical studies (Anjos et al., 2017; Almaráz-Abarca et al., 2007; Almeida et al., 2017; Bonvehí; Torrentó; Lorente, 2001; Komosinska-Vassev et al., 2015).
The main difficulty for bee pollen applications in
modern phytomedicine is related to the wide variation in the flower origin, air temperature and chemical composition of the plant soil, since these oscillations may contribute differently to the properties, biological activity and therapeutic effects of bee pollen. Even bee pollen from the same plant species harvested in distinct areas will contain differences in their chemical quality (Denisow; Denisow-Pietrzyk, 2016), and extensive research is required before bee pollen can be used in therapy, although it can unequivocally be recommended as a valuable dietary supplement. After studying bee pollen from Portugal, Morais et al. (2011) and Estevinho et al. (2012) reported that one of the fundamental aspects
for the beneficial qualities of bee pollen is its botanical
and geographical declaration of origin. Generic pollen
composition data were previously considered sufficient, but now, the usefulness of specific data is increasingly
being acknowledged since several studies indicate appreciable differences among the compositions of bee pollen from variable regions.
Therefore, this study aimed to assess the influence
of botanical origin on the physicochemical composition and antioxidant potential of pollen samples from Apis mellifera from the mesoregions of the Atlantic Forest or Mata Atlântica (“MA”), South Coast (SC) and Dryland or Caatinga (“C”) of Alagoas, Northeast Brazil during a dry season.
MATERIAL AND METHODS
This research was conducted with samples collected in a dry season (2008/2009) in three experimental apiaries from cities in different mesoregions (Atlantic Forest, Dryland and Coast) in the State of Alagoas, i.e., Viçosa (09° 22’ 47.9” S, 36° 17’ 7.7” W, altitude 265 m), Batalha (09° 40’ 35.4” S, 37° 03’19.2” W, altitude 225 m) and Barra de São Miguel (09° 47’ 56” S, 35° 52’ 50.9” W, altitude 19 m).
Harvesting pollen samples
Thirty collections (ten per apiary) were collected every fortnight using sterile pots after the rational beekeeping collector was installed. The samples were transported in isothermal boxes to the Institute of Chemistry and Biotechnology (IQB), Federal University of Alagoas (UFAL), and refrigerated.
Preparation and analysis of individual pollen slides
The anthers (male plant organ) of flower buds were
sectioned, and their pollen was removed with the aid of a stereoscopic microscope. The pollen grains were then included in non-coloured glycerine-gelatine, and the slides
were sealed with paraffin (three slides for each pollen type)
and observed under a microscope (640-1600×).
Preparation and analysis of mixed pollen slides
One gram of fresh pollen was weighed and macerated with 10 mL of 70% alcohol. The suspension was centrifuged (1368 g)twice for 15 min, and the supernatant was discarded. Pollen grains were counted (350 grains
per slide), and their classification profile was obtained according to the identification of their types based on
comparative analysis via optical microscopy of the slides prepared with bee pollen samples and the slides with
pollen collected on the same day from flowering plants
of the studied region.
Hydroethanolic pollen extracts (HPE)
The extracts were obtained according to the methodology described by Carpes et al. (2007) with
modifications. Briefly, 1 g of pollen from each of the ten
apiary samples was mixed together. From this mixture (10 g), another 1 g of pollen was collected and macerated in a crucible on ice (5 min) using 10 mL of aqueous 70% ethanol p.a. (prepared using deionized distilled water). These suspensions were shaken (70 °C, 150 rpm, 30 min) and centrifuged (1368 g, 10 min), and the supernatant was separated. The pellets (pollen) were resubmitted to the process described above, and the supernatants were
combined and filtered. The filtrates were stored in Falcon
tubes at 6-8 °C and named the hydroethanolic pollen extract (HPE), which corresponded to a concentration of 50 mg pollen/mL.
Pollen solutions (PS)
The pollen solution was obtained from samples of 500 mg of pollen homogenized in 10 mL of 0.1 M phosphate buffer, pH 6.2 (inside a crucible on ice). These pollen solutions (50 mg/mL) were centrifuged in Falcon tubes (at 4 °C for 3 min at 906 g).
Determination of pH and total protein
bovine serum albumin (BSA) for a standard curve (0 to 100 µg/mL), and the spectrophotometer was adjusted at 660 nm. The results were expressed as mg of BSA equivalents per g of pollen (mg BSA eq/g).
Determination of total carbohydrates
The total carbohydrates were determined in triplicate starting from the hydroethanolic pollen extracts (HPE) using the method described by Yemm and Willis (1954). For the standard curve, sucrose was used (0 a 100 µg/mL). The absorbance was measured at 620 nm.
Determination of total lipids
The determination of total lipids was carried out in triplicate using the method of Bligh and Dyer (Manirakiza; Covaci; Schepens, 2001). The residue was dried (1 h in an oven at 105 °C) and weighed (analytical balance), and the differences were expressed as percentages.
Determination of total phenolics
The content of total phenolic compounds was determined using the spectrophotometric method of
Folin-Ciocalteu (FC) modified by Carpes et al. (2007) using a
standard curve (linear regression of the absorbance) of gallic acid (0.5-100 µg/mL). Aliquots (2.5 mL) of FC reagent were added to 0.5 mL of diluted HPE (1:100), and 5 min later, 2.0 mL of 4% (w/v) sodium carbonate were added (Na2CO3). The reaction tubes were stored for 2 h at room temperature in the dark. The absorbance was measured at 740 nm, and the average results (triplicates) were expressed as mg of gallic acid equivalents per g of pollen (mg GA eq/g).
Determination of total flavonoids
The total flavonoid content was determined according
to the method described by Al et al. (2009) using a standard curve (linear regression of the absorbance) for quercetin
(5.0-150.0 μg/mL). Each 1 mL of diluted HPE (1:100) was added
to 0.3 mL of 5% NaNO3. After 5 min, 0.3 mL of 10% AlCl3 was added to the mixtures, which were homogenized, and after 6 min, the samples were neutralized with 2 mL of 1 M NaOH. The absorbance of the products was measured at 510 nm. The analyses were performed in triplicate.
Antioxidant capacity using dpph radicals
The antioxidant activity was determined by the methods described by Baltrusaityte, Venskutonis and Ceksteryte, (2007) based on DPPH (2,2-diphenyl-1-picrylhydrazyl) radical scavenging. Quercetin (Q), gallic acid (GA), and ascorbic acid (AA) were used as standards
(50 mg/mL). To a volume of 50 µL of HPE from each sample was added 2 mL of DPPH reagent (6.5×10⁻⁵ M). The blank was prepared with 50 µL of 70% ethanol and 2 mL of reagent and read at time zero. After 16 min, the absorbance of the reaction mixture was read at 515 nm. Analyses were performed in triplicate. The inhibition was estimated according to the following equation: I = [(AB – AA) / AB] ×100, where I = Inhibition percentage; AA = absorbance of the sample; and AB = absorbance of the blank.
Determination of the ferric reducing antioxidant power (FRAP)
The antioxidant potential was determined based on the reduction of Fe3+ to Fe2+ (Kuçuk et al., 2007). To each volume of 2.5 mL of HPE (1:25) were added 2.5 mL of phosphate buffer (0.2 M, pH 6.6) and 2.5 mL of potassium ferricyanide (K3Fe(CN)6) (1%). This mixture was incubated at 50 °C for 20 min, and 2.5 mL of trichloroacetic acid (10%) was added to the mixture under agitation in a tube shaker. Then, the samples were centrifuged (1368 g, 10 min), and 2.5 mL of the harvested supernatant was mixed with 2.5 mL of deionized distilled water and 0.5 mL of 0.1% FeCl3. The absorbance at 700 nm was measured, and the average results (from triplicate samples) were expressed as mg of gallic acid equivalents/g of pollen (mg GA eq/g).
Statistical analysis
The averages and standard errors of the data were calculated. Kolmogorov-Smirnov and Shapiro-Wilk normality tests were conducted with the data. For comparison of the statistical parameters of the bee pollen from the studied regions, a chi-square test as well as the Kruskal-Wallis non-parametric test were used. The correlation between the analysed parameters was examined with a non-parametric Spearman test using the statistical software STATSOFT (2001).
RESULTS AND DISCUSSION
Bee pollen production
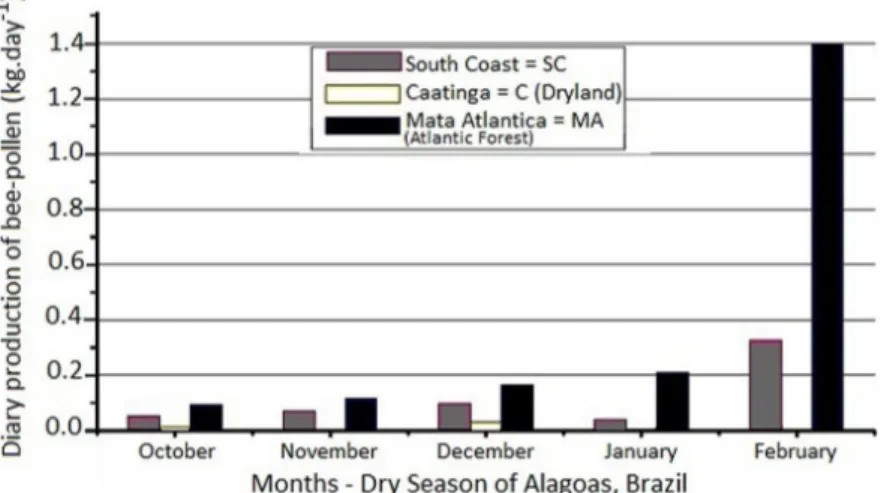
Figure 1 shows the bee-pollen production. In the Caatinga (“C”) mesoregion, which is characterized by a
scarcity of rainfall and flowering, the bee pollen collection
was almost negligible in terms of productivity (0.004 kg in November and 0.008 kg in January). The daily average rainfall record for January in this region was 1.11 mm, and there was only one month in which rains were recorded in this dry season (Table 1). In the South Coast (“SC”), where rains are more frequent (with an average rainfall of 6.8 mm in February), there was a production of 0.36 kg of bee pollen. Despite the decreasing tendency of the
production throughout the season in all the mesoregions, regular rainfall in “SC” and Atlantic Forest (“MA”) provided a better yield compared toCaatinga.
Bee pollen source
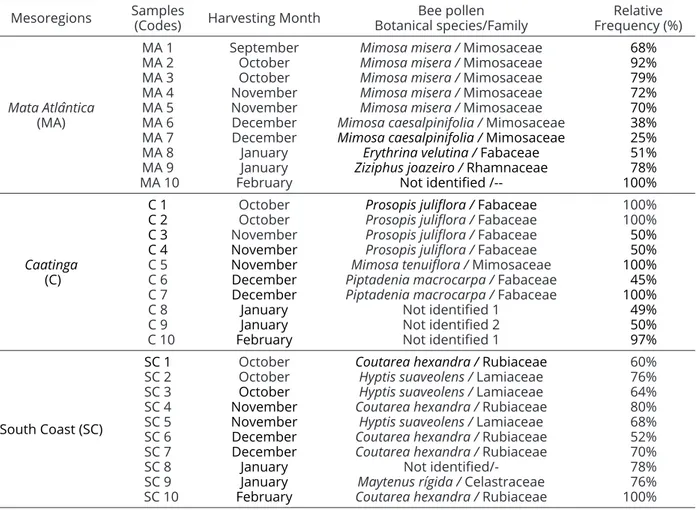
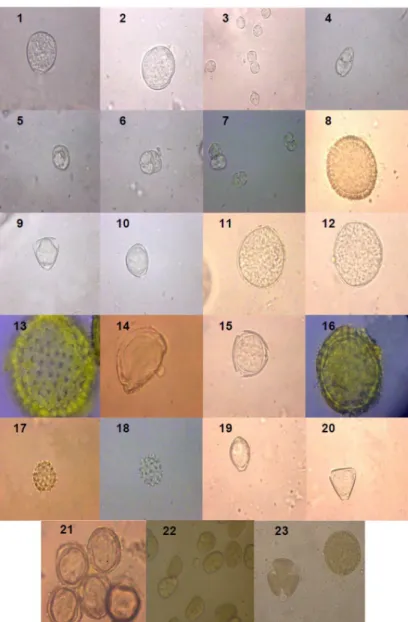
Table 2 illustrates the flower origin of pollen samples found in the hives studied in the mesoregions of the “MA”, “SC” and “C” of Alagoas during the dry season (2008/09) and their relative frequencies in these samples, whilst Figure 2 shows the pollen grain types that were found in the samples.
Cities (Mesoregions)
Samples (Code)
Altitude
(m) a Temperature(°C) a Rainfall (mm) a
Viçosa (Mata Atlântica - MA) MA 210 29 1500.0
Batalha (Caatinga - C) C 256 31 481.3
Barra de São Miguel (South
Coast - SC) SC 2 29 2050.0
Average daily precipitation (mm/day) a
Months (October - February)
(Code) Oct Nov Dec Jan Feb
Viçosa (Mata Atlântica - MA) MA 0.61 0 0 0.1 0.1
Batalha (Caatinga - C) C 0 0 0 1.11 0
Barra de São Miguel (South
Coast - SC) SC 0.3 0.3 0.7 1.5 6.8
Table 1: Average altitude, temperature, and daily rainfall precipitation (dry season) in the Mata Atlântica (MA), Caatinga (C) and South Coast (SC) mesoregions of Alagoas, Brazil where the bee-pollen of Africanized bees were collected (dry season - 2008/09).
aSecretaria de Recursos Hídricos e Meio Ambiente do Estado de Alagoas (SRHMA, 2009).
Table 2: Botanical species/family and their relative frequencies (%) of pollen found during the dry season (2008/09) in apiaries from the mesoregions ofMata Atlântica (“MA”), Caatinga(C) and South Coast(“SC”) of Alagoas, Brazil.
Mesoregions Samples
(Codes) Harvesting Month
Bee pollen
Botanical species/Family FrequencyRelative(%)
Mata Atlântica (MA) MA 1 MA 2 MA 3 MA 4 MA 5 MA 6 MA 7 MA 8 MA 9 MA 10 September October October November November December December January January February
Mimosa misera / Mimosaceae
Mimosa misera / Mimosaceae
Mimosa misera / Mimosaceae
Mimosa misera / Mimosaceae
Mimosa misera / Mimosaceae
Mimosa caesalpinifolia / Mimosaceae
Mimosa caesalpinifolia / Mimosaceae Erythrina velutina / Fabaceae Ziziphus joazeiro / Rhamnaceae
Not identified
/--68% 92% 79% 72% 70% 38% 25% 51% 78% 100% Caatinga (C) C 1 C 2 C 3 C 4 C 5 C 6 C 7 C 8 C 9 C 10 October October November November November December December January January February
Prosopis juliflora / Fabaceae
Prosopis juliflora / Fabaceae
Prosopis juliflora / Fabaceae
Prosopis juliflora / Fabaceae
Mimosa tenuiflora / Mimosaceae
Piptadenia macrocarpa / Fabaceae
Piptadenia macrocarpa / Fabaceae
Not identified 1 Not identified 2 Not identified 1
100% 100% 50% 50% 100% 45% 100% 49% 50% 97%
South Coast (SC)
SC 1 SC 2 SC 3 SC 4 SC 5 SC 6 SC 7 SC 8 SC 9 SC 10 October October October November November December December January January February
Coutarea hexandra / Rubiaceae
Hyptis suaveolens / Lamiaceae
Hyptis suaveolens / Lamiaceae
Coutarea hexandra / Rubiaceae
Hyptis suaveolens / Lamiaceae
Coutarea hexandra / Rubiaceae
Coutarea hexandra / Rubiaceae
Not
identified/-Maytenus rígida / Celastraceae
Coutarea hexandra / Rubiaceae
60% 76% 64% 80% 68% 52% 70% 78% 76% 100%
Mata Atlântica-samples showed a higher diversity of pollen types for feeding bees, and Caatinga-samples were monofloral. Pollens from Mimosa misera and M. caesalpinifolia (Mimosaceae), followed by the pollens from Ziziphus joazeiro (Rhamnaceae) and Erythrina velutina (Fabaceae), were the most common pollens in the apiaries from “MA” (Table 2). Costa et al. (2015) reported that family Mimosaceae/Fabaceae was the most represented family in samples of bee pollen from the semiarid city of Itaberaba in Bahia (Brazil) during the dry season of 2007 followed by the families Asteraceae, Commelinaceae and Poaceae.
On the other hand, the bee pollen collected in “SA” was predominately (%) formed by plant pollen from Coutarea hexandra (Rubiaceae), followed by Hyptis suaveolens (Lamiaceae) and Maytenus rigida (Celastraceae), whereas in the Caatinga samples, there was a high frequency (%) of pollen from Prosopis juliflora and
Piptadenia macrocarpa (Fabaceae), followed by pollen from Mimosa tenuiflora (Mimosaceae) (Table 2).
Mimosa spp. are an important plant for the generation of bee pollen in apiaries of the Brazilian Northeast (Alves; Santos, 2014). In the southern coast of the northeastern state of Bahia, Brazil (city of Canavieiras), Dórea, Novais and Santos (2010) collected bee-pollen with high relative frequencies of Elaeis, M. pudica and Cecropia pollen types.
Total protein, carbohydrate and lipid content
All bee pollen samples had a pH within the limits
accepted by the current law and none showed a significant
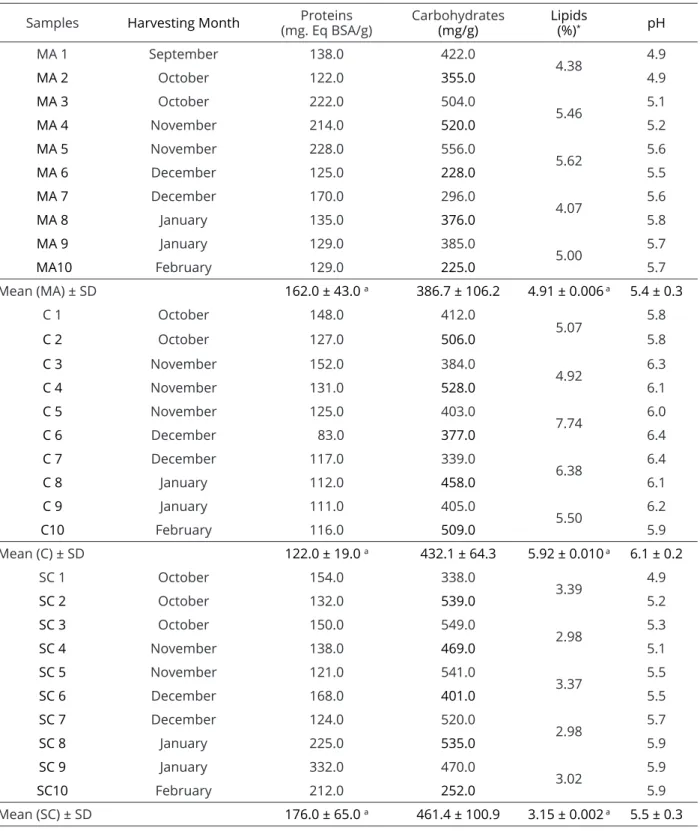
In the “MA”, the total protein content of pollen in the dry season ranged from 125.0 to 228.0 mg BSA eq/g, while in the Caatinga, it ranged from 83.0 to 152.0 mg BSA eq/g. In the “SC”, this variation was from 121.0 to
332.0 mg BSA eq/g. There were significant differences
among the means of the samples of the mesoregions that were studied (Table 3), according to the Kruskal–Wallis test. An interesting result was observed in Mata Atlântica bee
Figure 2: Photomicrographs of pollen types (magnitude 640 ×) in bee pollen collected during the dry season (2008/09) from different mesoregions of Alagoas (Northeastern Brazil). 1-2: Prosopis juliflora (Sw.) DC.; 3: Mimosa misera Benth.; 4-6: M. tenuiflora (Willd.) Poir; 7: M. caesalpinifolia Benth.; 8: Croton moritibensis Baill.; 9-10: Ziziphus joazeiro Mart; 11-12: Erythrina velutina Willd; 13: Centratherum punctatum Cass.; 14: Hyptis suaveolens (L.) Poit; 15: Maytenus rigida Mart.; 16: Sida sp.; 17-18: Elephantopus mollis Kunth.; 19-20: Coutarea hexandra (Jacq.) K. Schum.; 21: Spondias mombin L.; 22: Piptadenia macrocarpa Benth.; and 23: Croton sonderianus Muell.
Table 3: Total proteins, carbohydrates and lipids in bee pollen collected during the dry season (2008/09) in the mesoregions Mata Atlântica(“MA”), South Coast (“SC”) and Caatinga(C) ofAlagoas, Brazil.
Samples Harvesting Month (mg. Eq BSA/g)Proteins Carbohydrates (mg/g)
Lipids
(%)* pH
MA 1 September 138.0 422.0
4.38 4.9
MA 2 October 122.0 355.0 4.9
MA 3 October 222.0 504.0
5.46 5.1
MA 4 November 214.0 520.0 5.2
MA 5 November 228.0 556.0
5.62 5.6
MA 6 December 125.0 228.0 5.5
MA 7 December 170.0 296.0
4.07 5.6
MA 8 January 135.0 376.0 5.8
MA 9 January 129.0 385.0
5.00 5.7
MA10 February 129.0 225.0 5.7
Mean (MA) ± SD 162.0 ± 43.0 a 386.7 ± 106.2 4.91 ± 0.006 a 5.4 ± 0.3
C 1 October 148.0 412.0
5.07 5.8
C 2 October 127.0 506.0 5.8
C 3 November 152.0 384.0
4.92 6.3
C 4 November 131.0 528.0 6.1
C 5 November 125.0 403.0
7.74 6.0
C 6 December 83.0 377.0 6.4
C 7 December 117.0 339.0
6.38 6.4
C 8 January 112.0 458.0 6.1
C 9 January 111.0 405.0
5.50 6.2
C10 February 116.0 509.0 5.9
Mean (C) ± SD 122.0 ± 19.0 a 432.1 ± 64.3 5.92 ± 0.010 a 6.1 ± 0.2
SC 1 October 154.0 338.0
3.39 4.9
SC 2 October 132.0 539.0 5.2
SC 3 October 150.0 549.0
2.98 5.3
SC 4 November 138.0 469.0 5.1
SC 5 November 121.0 541.0
3.37 5.5
SC 6 December 168.0 401.0 5.5
SC 7 December 124.0 520.0
2.98 5.7
SC 8 January 225.0 535.0 5.9
SC 9 January 332.0 470.0
3.02 5.9
SC10 February 212.0 252.0 5.9
Mean (SC) ± SD 176.0 ± 65.0 a 461.4 ± 100.9 3.15 ± 0.002 a 5.5 ± 0.3
*Total lipids evaluated every two samples.
Féas et al. (2012) studied bee pollen (BP, n = 22) harvested from the Douro International Natural Park (DINP, Portugal) and found 9 botanical families in the mixture of the samples, with pH ranging from 4.3-5.2 and bee pollen extracts with an average of 21.8% crude protein.
Studies by Ketkar et al. (2014) with the monofloral Indian
mustard bee pollen showed an average concentration of proteins of 182.2 ± 5.9 mg/g. A common method used to assess proteins in foods, including pollen, is the
micro-Kjeldahl method, which quantifies total nitrogen. Using
a correction factor (6.25), we obtained the percentage of crude protein (Marchini; Reis; Moreti, 2006). However,
the Lowry method is much more specific and sensitive to
peptide bonds, and this approach was used in this study even though it required more time for analysis and the absorbance was highly variable for different proteins.
With respect to total carbohydrates, the averages for the mesoregions were very close and showed an average of 386.7 mg sucrose/g for the “MA”, 431.1 mg sucrose/gfor “C”, and 461.4 mg sucrose/g for “SC” (Table 3). The studied samples from all the regions
showed no statistically significant differences among them
(Kruskal–Wallis test, at a level of 95%). In the studies by Féas et al. (2012) with bee pollen from the Douro International Natural Park (DINP, Portugal), the average total carbohydrate was 67.7% for those samples.
Modro et al. (2009) found an average of 68.13% carbohydrates in bee pollen from the city of Viçosa in another state in southeastern Brazil (Minas Gerais). Marchini, Reis, and Moreti (2006) obtained a mean of 28.4% for samples of bee pollen from their studies. Studies by Ketkar et al. (2014) with the monofloral Indian mustard bee pollen showed an average concentration of carbohydrates of 560.6 ± 17.4 mg/g.
The averages recorded for lipids in samples collected during the dry season were higher for the “C” mesoregion (4.92-7.74%), while for the “MA” samples, this parameter ranged from 4.07-5.62%. For the “SC” samples, it varied
from 2.98-3.39% with no significant differences among the
samples (Kruskal–Wallis test) (Table 3). These values were within the limits prescribed by law in bee pollen (a minimum of 1.8% of total lipids) (Brazil, 2001).
Modro et al. (2009) evaluated pollen samples collected from an experimental apiary in a municipality of Minas Gerais (Viçosa) during the months of August-December, and they found values from 1.78 to 6.55% for total lipids. Similar results were observed in samples collected in Piracicaba, São Paulo, as well as in southeastern Brazil, with fats in bee pollen ranging from 2.2 to 5.1% over one year (Marchini; Reis; Moreti,
2006). The method used by these authors involves a Soxhlet extractor, as required by current legislation. In bee pollen samples from the Doro region (Portugal), Féas et al. (2012) found 5.2% crude fat, and linolenic acid was the main fatty acid, followed by linoleic, palmitic and
oleic acids, and the liposoluble pro-vitamin β-carotene.
On the other hand, Ketkar et al. (2014), who studied the
monofloral Indian mustard bee pollen, observed an average
concentration of fats of 137.7±6.8 mg/g, which was almost double the levels found in the samples of this study.
Total phenolic content
As seen in Table 4, based on the linear regression of the gallic acid standard curve (Abs740nm = 0.00078335x – 0.05719, R2 = 0.9995), the total phenolic content of samples of bee pollen from the Caatinga mesoregion had a higher average level (25.85 mg GA eq/g) than the others, despite the scarcity of rainfall during the studied season. Samples from the coast, where the highest average annual rainfall was observed (Table 1), showed a lower content of total phenolics. These observations corroborate the study by Leblanc et al. (2009), which showed that pollen from the Sonoran Desert (USA) also had a high phenolic content (29.38 mg GA eq/g). Bonvehí, Torrentó, and Lorente (2001), detected total phenolics ranging from 8.7 to 14.6 mg GA eq/g in 11 samples of pollen from western Spain, whilst Liu et al. (2006) detected 8.0 to 11.2 mg GA eq/g in a study of the preference of Apis cerana for plant pollen with a low phenolic content. Leja et al. (2007) found similar values (12.9 mg GA eq/g) in two bee pollen samples from 12 samples studied in a zone cropped with Zea mays and 15.1 mg GA eq/g in another with Trifolium spp.
However, according to Carpes et al. (2007), the content of total phenolic compounds extracted from pollen is solvent-dependent, and the most efficient extraction occurs with 60-80% ethanol. The bee pollen sample from Alagoas (without determining the area or season of harvest) extracted with 70% ethanol (HPE) presented less than 8.1 mg GA eq/g, which is a value close to the value found in this paper for samples collected in the “SC” mesoregion.
On the other hand, studies by Ketkar et al. (2014) of
monofloral Indian mustard bee pollen showed an average
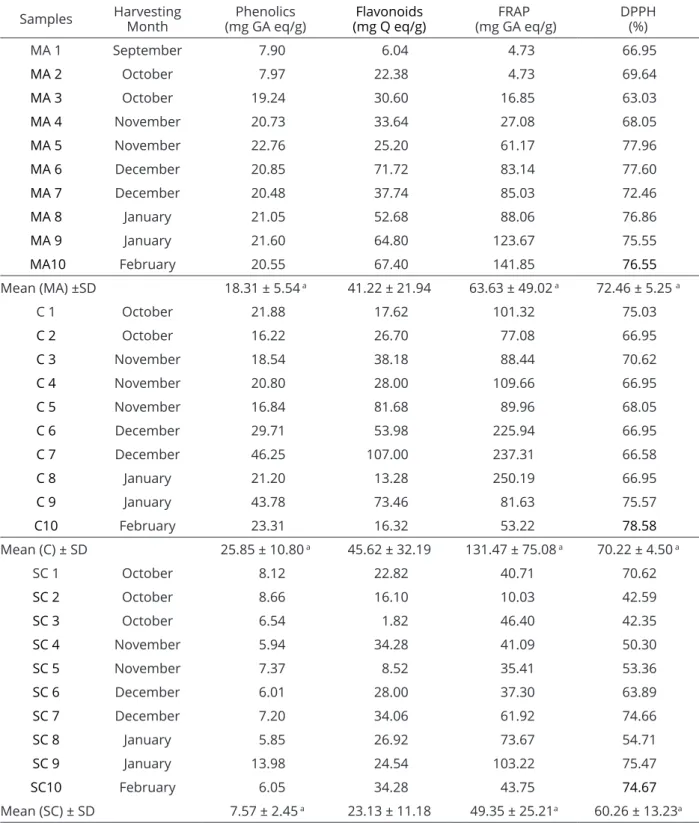
Table 4: Total content of phenolics, flavonoids and antioxidants (determined by the FRAP method and percentage inhibition of free radicals by the DPPH assay) from bee pollen samples collected from Mata Atlântica(“MA”), Caatinga (“C”) and the South Coast (“SC”) of Alagoas, Brazil during the dry season (2008/09).
a95% significance, (p<0.05), according to the Kruskal-Wallis test.
Samples Harvesting
Month
Phenolics
(mg GA eq/g) (mg Q eq/g)Flavonoids
FRAP
(mg GA eq/g) DPPH(%)
MA 1 September 7.90 6.04 4.73 66.95
MA 2 October 7.97 22.38 4.73 69.64
MA 3 October 19.24 30.60 16.85 63.03
MA 4 November 20.73 33.64 27.08 68.05
MA 5 November 22.76 25.20 61.17 77.96
MA 6 December 20.85 71.72 83.14 77.60
MA 7 December 20.48 37.74 85.03 72.46
MA 8 January 21.05 52.68 88.06 76.86
MA 9 January 21.60 64.80 123.67 75.55
MA10 February 20.55 67.40 141.85 76.55
Mean (MA) ±SD 18.31 ± 5.54 a 41.22 ± 21.94 63.63 ± 49.02 a 72.46 ± 5.25 a
C 1 October 21.88 17.62 101.32 75.03
C 2 October 16.22 26.70 77.08 66.95
C 3 November 18.54 38.18 88.44 70.62
C 4 November 20.80 28.00 109.66 66.95
C 5 November 16.84 81.68 89.96 68.05
C 6 December 29.71 53.98 225.94 66.95
C 7 December 46.25 107.00 237.31 66.58
C 8 January 21.20 13.28 250.19 66.95
C 9 January 43.78 73.46 81.63 75.57
C10 February 23.31 16.32 53.22 78.58
Mean (C) ± SD 25.85 ± 10.80 a 45.62 ± 32.19 131.47 ± 75.08 a 70.22 ± 4.50 a
SC 1 October 8.12 22.82 40.71 70.62
SC 2 October 8.66 16.10 10.03 42.59
SC 3 October 6.54 1.82 46.40 42.35
SC 4 November 5.94 34.28 41.09 50.30
SC 5 November 7.37 8.52 35.41 53.36
SC 6 December 6.01 28.00 37.30 63.89
SC 7 December 7.20 34.06 61.92 74.66
SC 8 January 5.85 26.92 73.67 54.71
SC 9 January 13.98 24.54 103.22 75.47
SC10 February 6.05 34.28 43.75 74.67
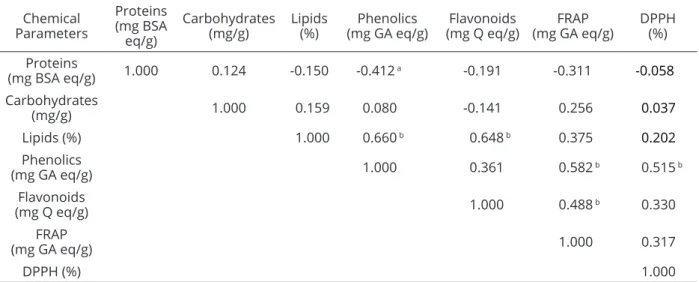
Through the Kruskal-Wallis test (Table 4), significant differences were observed among the mesoregions regarding the content of phenolics (95%, p <0.05), which showed a negative correlation (-0.412) with the total protein content and a positive correlation with the lipid content (0.660) at a level of 99% (p <0.01) (Table 5).
Total flavonoid content
In relation to the total flavonoid content (Table 4), after
building the linear regression of the quercetin standard curve (Abs510nm = 0.01619x - 0.00308, R2 = 0.99715), the bee pollen collected in the “C” mesoregion of Alagoas showed the highest average (45.62 mg Q eq/g), followed by the bee pollen from “MA” (41.22 mg Q eq/g) and then the “SC” region (23.22 mg Q eq/g). Between total
flavonoids and lipids, there is a correlation of 0.648 at the
level of 99% (p <0.01) (Table 5). The correlation between
the total phenolic and flavonoid contents was 0.361.
Samples of bee pollen from the Doro region
(Portugal) showed a total content of flavonoids varying
from 4.5 to 7.1 mg catechin eq/g of extract (Féas et al., 2012), which was much less than the values found in this
study. Studies with the monofloral Indian mustard bee pollen
(Ketkar et al., 2014) showed an average concentration of
total flavonoids of 1.22 ±0.053 mg Q eq/g, and using
high-performance liquid chromatography-photo diode array
(HPLC-PDA) analysis, the authors detected the presence of kaempferol (0.065 ±0.0005 mg Q eq/g) and quercetin (0.051
Table 5: Spearman coefficient correlation between the parameters evaluated in the bee pollen samples collected from the mesoregions of Mata Atlântica (“MA”), South Coast (“SC”) and Caatinga (“C”) of Alagoas, Brazil during the dry season (2008/09).
a 95% significance, (p<0.05); b 99% significance, (p<0.01). Chemical
Parameters
Proteins (mg BSA
eq/g)
Carbohydrates (mg/g)
Lipids
(%) (mg GA eq/g)Phenolics (mg Q eq/g)Flavonoids
FRAP
(mg GA eq/g) DPPH(%)
Proteins
(mg BSA eq/g) 1.000 0.124 -0.150 -0.412 a -0.191 -0.311 -0.058
Carbohydrates
(mg/g) 1.000 0.159 0.080 -0.141 0.256 0.037
Lipids (%) 1.000 0.660 b 0.648 b 0.375 0.202
Phenolics
(mg GA eq/g) 1.000 0.361 0.582 b 0.515 b
Flavonoids
(mg Q eq/g) 1.000 0.488 b 0.330
FRAP
(mg GA eq/g) 1.000 0.317
DPPH (%) 1.000
±0.0004 mg Q eq/g), which can be used as markers for determining the quality of bee pollen. Almeida et al. (2017)
also found both flavonoids to be the predominant ones in the
bee pollen sampled in their studies, which showed that they can be used to determine the botanical origin of such foods.
Antioxidant activity: DPPH radical scavenging
method versus ferric reducing-antioxidant power
(FRAP)
According to Sánchez-Moreno (2002), the DPPH method is considered accurate and easy to measure the antioxidant capacity of fruits, vegetables or extracts. However, the averages evaluated for antioxidant activity using this method in the present study were very similar
for the three mesoregions, and there were no significant
differences among them (Tables 4 and 5).
Bee pollen samples showed antioxidant activities that ranged from 63.03 to 77.96% in “MA”, 66.58 to 78.58% in “C”, and 42.35 to 75.47% in “SC” with the averages showing high antioxidant activity in the “C” samples, followed by “MA” and “SC”. Leja et al. (2007) determined the antioxidant activity in the bee pollen of 12 plant species and found substantial differences in the radical-scavenging activity (8.6-91.5% of DPPH neutralization). Studies by Féas et al. (2012) in the Doro region showed that the
scavenger activity and β-carotene bleaching assays values
Regarding the antioxidant activity determined by the FRAP method (Table 4), the highest average was found for the “C” mesoregion (131.47 mg GA eq/g), which
corroborates the findings with the DPPH test and the
studies of Leblanc et al. (2009) with the pollen collected during the dry season in places where rain is scarce (higher antioxidant activity than the pollen collected in the rainy season). The samples from the “SC” showed the lowest average antioxidant activity (49.35 mg GA eq/g), which was probably due to a milder climate compared to the “C” region as well as due to the rainfall, which was much higher in this region than in the “C” region.
The correlation between the antioxidant activity determined by the FRAP method and the total phenolic
and flavonoid contents (Table 5) were 0.582 and 0.488,
respectively. In relation to the antioxidant activity measured by the DPPH method and the total phenolic and
flavonoid contents (Table 5), the correlations were 0.515
and 0.330. On the other hand, regarding both antioxidant methods, the correlation was 0.317 (Table 5).
According to Almaráz-Abarca et al. (2007)
regarding the identification of antioxidant activity, the
content of phenolic compounds in pollen is more important
than the flavonoids content, but vitamins A, E and C;
polyunsaturated fatty acids; and phytosterols (Kanashiro et al., 2007; Lee; Kim, 2010; Sahin et al., 2011) are also effective nutrients for the prevention of oxidative stress and related disorders.
CONCLUSIONS
This study showed that Mata Atlântica (“MA”) and South Coast (“SC”) were the most promising mesoregions for bee pollen production in the dry season. The “MA” region showed a higher diversity of pollen types for feeding bees during the dry season with 63% predominance of herbaceous pollen, while in the “C”
mesoregion, the bee pollen samples were monofloral since the predominant plants there only begin to flower
during the rainy season. Bee pollen collected in the coastal mesoregion showed a higher protein content than pollen from other regions during the dry season.
Regarding the total phenol and flavonoid contents,
in addition to the antioxidant activity, the bee pollen collected in mesoregions “MA” and “C” was superior, but in the last one, despite scarce rainfall and reduced plant diversity, the pollen had a higher content of these bioactive compounds and a higher antioxidant potential,
reflecting a promising area to produce apitherapeutics
with different properties.
ACKNOWLEDGEMENTS
The authors are grateful to all the beekeepers who provided the biological material for this research and to the “Banco do Nordeste do Brasil SA-BNB” (grant number 1950/004-2007) and “Fundação de Amparo à Pesquisa de
Alagoas - FAPEAL” for financial support.
REFERENCES
AL, M. L. et al. Physicochemical and bioactive properties of different floral origin honeys from Romania. Food Chemistry, 112(4):863-867, 2009.
ALMEIDA, J. F. et al. Lyophilized bee pollen extract: A natural
antioxidant source to prevent lipid oxidation in refrigerated sausages. LWT – Food Science and Technology, 76(B):
299-305, 2017.
ALMARÁZ-ABARCA, N. et al. Antioxidant activity of polyphenolic extract of monofloral honeybee-collected
pollen from mesquite (Prosopis juliflora, Leguminosae).
Journal of Food Composition and Analysis, 20(2):119-124, 2007.
ALVES, R. F.; SANTOS, F. A. R. Plant sources for bee pollen
load production in Sergipe, northeast Brazil. Palynology,
38(1):90-100, 2014.
ANJOS, O. et al. Application of FTIR-ATR spectroscopy on the bee pollen characterization. Journal of Apicultural Research,
56(3):1-9, 2017.
BALTRUSAITYTE, V.; VENSKUTONIS, P. R.; CEKSTERYTE, V. Radical scavenging activity of different floral origin honey and beebread phenolic extracts. Food Chemistry, 101(2):502-514, 2007.
BONVEHÍ, J. S.; TORRENTÓ, M. S.; LORENTE, E. C. Evaluation of polyphenolic and flavonoid compounds in
honeybee-collected pollen produced in Spain. Journal of Agricultural
and Food Chemistry, 49(4):1848-1853, 2001.
BRASIL. Instituto Adolfo Lutz. Manual de métodos de análises
físico-químicas. 4ª ed. São Paulo: Instituto Adolfo Lutz, 2005. p.117.
BRASIL, Ministério do Meio Ambiente. Instrução Normativa nº
3, de 19 de janeiro de 2001. Regulamento Técnico para Fixação de Identidade e Qualidade de Pólen Apícola. Brasília: Ministério da Agricultura e do Abastecimento,
CARPES, S. T. et al. Study of preparations of bee pollen extracts, antioxidant and bacterial activity. Ciência e Agrotecnologia, 31(6):1818-1825, 2007.
COSTA, S. N. et al. Pollen sources used by Apis mellifera
Latreille in the semiarid region. Ciência Animal Brasileira,
16(4):491-497, 2015.
DENISOW, B.; DENISOW-PIETRZYK, M. Biological and therapeutic properties of bee pollen: A review. Journal Science of Food Agriculture, 96:4303-4309, 2016.
DÓREA, M. C.; NOVAIS, J. S.; SANTOS, A. R. Botanical profile of
bee pollen from the southern coastal region of Bahia, Brazil.
Acta Botanica Brasilica, 24(3):862-867, 2010.
ESTEVINHO, L. M. et al. Portuguese bee pollen: Palynological study, nutritional and microbiological evaluation. International Journal of Food Science and Technology,
47(2):429-435, 2012.
FÉAS, X. et al. Organic bee pollen: Botanical origin, nutritional
value, bioactive compounds, antioxidant activity and microbiological quality. Molecules, 17(7):8359-837, 2012.
KANASHIRO, A. et al. Elastase release by stimulated neutrophils inhibited by flavonoids: Importance of the catechol group. Zeitschrift f¨urNaturforschung C, 62(5-6):357-361, 2007.
KETKAR, S. S. et al. Investigation of the nutraceutical potential
of monofloral Indian mustard bee pollen. Journal of
Integrative Medicine, 12 (4):379-389, 2014.
KOMOSINSKA-VASSEV, K. et al. Bee pollen: Chemical
composition and therapeutic application. Evidence Based
Complementary and Alternative Medicine. Article ID 297425, 6p, 2015.
KUÇUK, M. et al. Biological activities and chemical composition
of three honeys of different types from Anatolia.Food Chemistry, 100(2):526-534, 2007.
LEBLANC, B. W. et al. Antioxidant activity of sonoran desert bee
pollen. Food Chemistry, 115(4):1299-1305. 2009.
LEE, J. H.; KIM, G. H. Evaluation of antioxidant and inhibitory activities for different subclasses flavonoids on enzymes
for rheumatoid arthritis. Journal of Food Science,
75(7):H212-H217, 2010.
LEJA, M. et al. Antioxidative properties of bee pollen in selected
plant species. Food Chemistry, 100(1):237-240, 2007.
LIU, F. L. et al. Pollen phenolics and regulation of pollen foraging in honeybee colony. Behavior Ecology Sociobiology,
59(4):582-588, 2006.
LOWRY, O. H. et al. Protein measurement with the Folin phenol
reagent. Journal of Biological Chemistry, 193(1):265-275,
1951.
MANIRAKIZA, P.; COVACI, A.; SCHEPENS, P. Comparative study on total lipid determination using Soxhlet, Roese-Gottlieb, Bligh and Dyer extraction methods. Journal of Food Composition and Analysis, 14(1):93-100, 2001.
MARCHINI, L. C.; REIS, V. D. A.; MORETI, A. C. C. C. Composição
físico-química de amostras de pólen coletado por abelhas Africanizadas Apis mellifera Hymenoptera: Apidae) em Piracicaba, Estado de São Paulo. Ciência Rural,
36(3):949-953, 2006.
MOHDALY, A. A. A. et al. Phenolic extract from propolis and
bee pollen: Composition, antioxidant and antibacterial activities. Journal of Food Biochemistry, 39:538-547, 2015.
MODRO, A. F. H. et al. Analysis of pollen load based on color, physicochemical composition and botanical source. Anais da Academia Brasileira de Ciências, 81(2):281-285, 2009. MORAIS, M. et al. Honeybee-collected pollen from five Portuguese Natural Parks: Palynological origin, phenolic content, antioxidant properties and antimicrobial activity. Food and Chemical Toxicology, 49(5):1096-1101, 2011.
NOGUEIRA, C. et al. Commercial bee-pollen with different
geographical origins: A comprehensive approach.
International Journal of Molecular Sciences, 13(9):11173-11187, 2012.
SAHIN, H. et al. Honey, pollen, and propolis extracts show potent inhibitory activity against the zinc metalloenzyme carbonic anhydrase. Journal of Enzyme Inhibition and Medicinal Chemistry, 26(3):440-444, 2011.
SÁNCHEZ-MORENO, C. Methods used to evaluate the free radical scavenging activity in foods and biological systems. Food Science and Technology International, 8(3):121-137, 2002.
SATTLER, J. A. G. et al. Impact of origin on bioactive compounds
and nutritional composition of bee-pollen from southern
Brazil: A screening study. Food Research International,
77(2):82-91, 2015.
STATSOFT, INC. STATISTICA (data analysis software system),
version 6. Available in: <www.statsoft.com>. Access in:
January, 12, 2017. 2001.
YEMM, E. W.; WILLIS, A. J. The estimation of carbohydrates in plant extracts by anthrone. Biochemical Journal,