RECURRENT SELECTION IN INBRED POPCORN FAMILIES
Máskio Daros1; Antônio Teixeira do Amaral Jr.1*; Messias Gonzaga Pereira1; Fabrício Santana Santos1; Ana Paula Cândido Gabriel1; Carlos Alberto Scapim2; Silvério de Paiva Freitas Jr.1; Lucas Silvério2
1
UENF Lab. de Melhoramento Genético Vegetal Av. Alberto Lamego, 2000, Parque Califórnia 28013600 Campos dos Goytacazes, RJ - Brasil.
2
UEM - Depto. de Agronomia, 8702-900 - Maringá, PR - Brasil. * Corresponding author <amaraljr@uenf.br>
ABSTRACT: Although much appreciated in Brazil, commercial popcorn is currently cropped on a fairly small scale. A number of problems need to be solved to increase production, notably the obtaintion of seeds with good agronomic traits and good culinary characteristics. With the objective of developing superior genotypes in popcorn, a second cycle of intrapopulation recurrent selection based on inbred S1 families was carried out. From the first cycle of selection over the UNB-2U population, 222 S1 families were obtained, which were then divided into six sets and evaluated in a randomized complete block design with two replications within the sets. Experiments were carried out in two Brazilian localities. The analysis of variance revealed environmental effects for all evaluated traits, except popping and stand, showing that, for most traits, these environments affected genotype behavior in different ways. In addition, the set as source of variation was significant for most of the evaluated traits, indicating that dividing the families into sets was an efficient strategy. Genotype-by-environment interaction was detected for most traits, except popping expansion and stand. Differences among genotypes were also detected (1% F-test), making viable the proposition of using the genetic variability in the popcorn population as a basis for future recurrent selection cycles. Superior families were selected using the Smith and Hazel classic index, with predicted genetic gains of 17.8% for popping expansion and 26.95% for yield.
Key words: breeding program, S1 families, yield, popping expansion
SELEÇÃO RECORRENTE EM FAMÍLIAS ENDOGÂMICAS
EM MILHO PIPOCA
RESUMO: Embora muito apreciada no Brasil, o milho pipoca comercial é normalmente cultivado em pequena escala. Para aumentar a produção, alguns problemas precisam ser resolvidos, principalmente a obtenção de sementes com boas características agronômicas e culinárias. Com o objetivo de obter genótipos superiores de milho pipoca, foi conduzido um segundo ciclo de seleção recorrente intrapopulacional, com base em famílias endogâmicas S1. Duzentas e vinte e duas famílias S1 foram obtidas a partir do ciclo 1 da população UNB-2U e foram avaliadas em delineamento de blocos casualizados com duas repetições dentro de ‘sets’, em dois locais no Brasil. A presença de significância estatística para ‘sets’ para as características número de espigas doentes e sadias, capacidade de expansão, número de plantas quebradas e número de espigas mal empalhadas, comprova a eficiência e a necessidade do uso de modelo estatístico hierarquizado por ‘sets’. Constatou-se significância (1% teste F), para famílias dentro de ‘sets’, revelando suficiente variabilidade genética a ser explorada em ciclos futuros, essencial para o sucesso do programa. A seleção das famílias superiores, realizada com base no Índice Clássico de Smith e Hazel, proporcionou ganhos preditos de 17,8% para capacidade de expansão e de 26,95% para produção de grãos.
Palavras-chave: programa de melhoramento, famílias S1, rendimento e capacidade de expansão
INTRODUCTION
Although much appreciated in Brazil, commer-cial popcorn is currently cropped on a fairly small scale (Andrade, 1996; Linares, 1987; Zanette, 1989). A num-ber of problems need to be solved to increase production, notably the obtaintion of seeds with good agronomic traits (Pacheco et al., 1998) and good culinary characteristics, especially popping (Gama et al., 1990; Pereira & Amaral
Jr., 2001). Few breeding studies have been carried out on the crop, with the result that the popcorn commercially available in Brazil is of poor quality (Andrade, 1996). This is why 75% of the popcorn consumed in Brazil is imported (Galvão et al., 2000).
to improve the country’s production:consumption ratio. Over the years, the importance of introducing improved popcorn cultivars and superior hybrids has been demon-strated in Brazil. To make this point, Linares (1987) cites the example of the USA, where popping maize produc-tion increased from 24,000 to 2,560,000 tons in 37 years (1934 to 1971). Yield figures kept pace with this increase,
going from 1.8 t ha-1 in 1920 to 3.3 t ha-1 in 1973.
Re-leasing new cultivars onto the national market will sig-nificantly stimulate production in Brazil. Turnover in the USA alone is currently around 1.155 billion dollars an-nually (Pacheco et al., 1998; Galvão et al., 2000).
Popcorn breeding programs are under way at a number of locations in Brazil, including Viçosa and Sete Lagoas (Minas Gerais State), Maringá and Londrina (Paraná State), and Piracicaba and Campinas (São Paulo State). A popcorn breeding program at Campos dos Goytacazes has also been developed, aimed at releasing varieties with characteristics tailored for cultivation in the north and northwest regions of Rio de Janeiro State.
The initial program stages involved assessing the potential of the UNB-2U population and identifying more efficient breeding strategies to produce improved variet-ies (Pereira & Amaral Jr., 2001). The first recurrent se-lection cycle based on full-sib family sese-lection resulted in predicted gains of 4.69% (yield) and 10.39% (popping expansion) (Daros et al., 2002). In the second cycle,
re-current selection based on S1 families was thought more
appropriate, and was the second-best strategy in terms of gains achieved with UNB-2U (Pereira & Amaral Jr., 2001).
Selection based on inbred family performance has been successfully used to increase yield in popping maize
populations. For example, using direct selection on S1
progeny at Viçosa, Vilarinho (2001) obtained gains of
1.08 mL g-1 (popping expansion) and 12.97 kg ha-1 (grain
yield) for the second recurrent selection cycle in inbred families, even with an estimated genotypic correlation of –0.39 between the two traits.
This study was intended as a continuation of the popcorn breeding program at the Universidade Estadual do Norte Fluminense Darcy Ribeiro (Rio de Janeiro State,
Brazil), with selection of S1 families derived from the
UNB-2U cycle 1 population. Expectations for the near future include the possible release an improved variety with high commercial value for the north and northwest regions of Rio de Janeiro State.
MATERIAL AND METHODS
The UNB-2U cycle 1 population (UNB-2U-C1) was subjected to intrapopulation recurrent selection based
on inbred families (S1). The first cycle was based on
full-sib recurrent selection (Daros et al., 2002). Two hundred
and twenty-two S1 families were obtained. Some of the
seeds from each family were stored for later assessment and some subjected to evaluation tests. The tests were run in December 2001 in Campos do Goytacazes (21º45’15’’ S, 41º19’28’’ W) (northern region of Rio de Janeiro State) and in January 2002 in Itaocara (21º40’09’’ S, 42º04’34’’ W), (northwest region of Rio de Janeiro State).
A randomized complete block design was used, with two replications in six sets, each consisting of 37 families and five controls. Each family was cultivated in a 5.0 m row with inter-row spacing of 1.0 m and 0.2 m spacing between plants. Initially, fifty seeds were sown per row. One month after sowing, the plants were thinned to 25 plants per row. Soil preparation, fertilizer applica-tion and cultural practices were in compliance with the recommendations (EMBRAPA, 1993; Fancelli & Dourado Neto, 2000).
The following traits were evaluated: a) stand (ST) number of plants in the row; b) broken plants (BP) -number of plants with the stem broken below the upper ear at harvest; c) poorly hulled ears (PHE) - number of ears not completely covered by husk; d) number of ears (NE) - ears harvested in each plot; e) number of diseased ears (NDE) - number of diseased ears harvested in the
plot; f) grain yield (GY) - weight of grain in kg ha-1; g)
popping expansion (PE).
Popping expansion was assessed in a popcorn machine developed by Embrapa/Instrumentação Agropecuária, incorporating an electronic resistor and thermostat. Two 30-mL grain samples were obtained from each plot. After pre-heating the machine to 270°C, each sample was cooked for 2.5 minutes. Expanded volume was measured in a 1000 ml graded test tube. Popping ex-pansion was calculated as the ratio of expanded volume to initial volume.
Variance analysis was carried out on the traits measured, based on the randomized complete block de-sign, with two replications within sets in two environ-ments according to the genetic-statistical model
pro-posed by Hallauer & Miranda Filho (1981), ie: Yijkl = µ
+ Ei + Sj + ESij + R/ESijk + F/Sjl + EF/Sijl + ξijkl , where
µ is the general mean; Ei is the fixed effect of the ith
en-vironment; Sj is the effect of the jth set; ES
ij is the effect
of environment-by-set interaction; R/ESijk is the effect
of the kth
replication within the environment-by-set
in-teraction; F/Sjl is the effect of the lth family within the
set; EF/Sijl is the effect of the environment-by-family
in-teraction within the set; and ξijkl is the experimental
er-ror.
The genetic parameters, phenotypic ( 2 f
σ ) and
genotypic (
σ
g2) variance and heritability on the familymean basis ( 2
h
) were estimated as follows: f =MSFre2
σ ;
re MSE MSF
g
− =
2
σ ; and 2
2 2
f g
h
σ σ
= ; where: MSF and MSE are
re-spectively the family mean square and error mean square;
r is the number of replications; e is the number of
envi-ronments.
Superior progenies were selected, based on the Smith (1936) and Hazel (1943) classic index and using the Genes computer program (Cruz, 2001) to compute the
solution to matrix system b=P-1Ga
, where b is the
dimen-sion vector 7 × 1 of the weighting coefficients of the
in-dex, P-1 is inverse of the 7 × 7 dimension matrix of
phe-notypic covariance among the traits, G is the 7 × 7
di-mension matrix of genotypic covariance among the traits
and a the economic weights. The following values were
attributed as economic weights: number of diseased ears (-20), popping (1,200), stand (10), broken plants (-20), number of poorly hulled ears (-550), number of ears (20) and grain weight (40). The weights were defined by ob-serving the most favorable gains for grain yield and pop-ping expansion, as well as gains for other desirable traits. A total of forty progenies were selected to make up the recombination batch and form the second cycle
popula-tion (UNB-2U C2) using the S1 seeds placed in storage.
RESULTS AND DISCUSSION
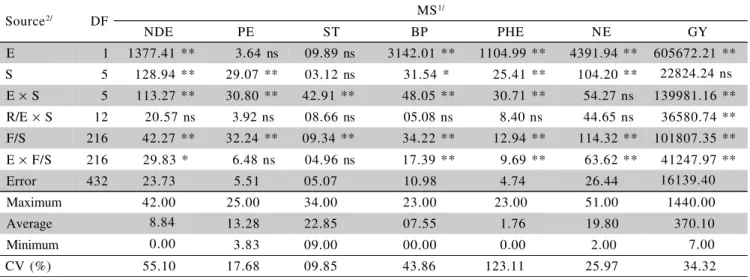
The coefficient of variation for the seven evalu-ated traits was considered high for all traits, except stand and popping expansion (Table 1). Coimbra (2000) also reported coefficient of variation values considered very high for some traits in popcorn, such as proportion of
bro-ken plants, proportion of lodged plants, weight of dis-eased ears, poorly hulled ears and plants attacked by fall armyworm. According to the author, the high values of the coefficients are compatible with those observed in other studies for this crop. The relatively high value for the grain yield coefficient of variation may be attributed to the size of plot used (one row plot), as well as the type of progeny. Inbred progenies are usually more sensitive to environmental effects presenting relatively high re-sidual variance. Despite this, considering the high
pro-portion of genetic variance between S1 families ( 2
A
σ
+0.25 2
D
σ
), the most effective method is to select the bestfamilies on the basis of grain yield and other traits. The results of popcorn half-sib progeny selection analyzed by Pacheco et al. (1998), also reported CV (%) values for percentage of lodged and broken plants of 156.40% and 50.50%, respectively, for the CMS-42 popu-lation. For the CMS-43 population, the respective CV (%) values for percentage of lodged and broken plants were 143.80% and 59.30%. The analysis of variance results indicate environmental effects for the evaluated traits, except popping and stand (Table 1), showing that the en-vironments differed sufficiently to affect most of the evaluated traits.
One of the problems frequently faced in field ex-periments is plant failure. This affects the stand and makes it difficult to compare the treatments (Coimbra, 2000). In our experiments, the stand varied from 9 to 25 plants per plot. The stand variance analysis figures (Table 1) show that the variation source families were
signifi-cant within sets (F/Sjl), with a 1% probability in the
F-test. Therefore, no correction for stand was made since this would not have been a suitable procedure for the
Source2/ DF MS
1/
NDE PE ST BP PHE NE GY
E 1 1377.41 ** 3.64 ns 09.89 ns 3142.01 ** 1104.99 ** 4391.94 ** 605672.21 ** S 5 128.94 ** 29.07 ** 03.12 ns 31.54 * 25.41 ** 104.20 ** 22824.24 ns
E × S 5 113.27 ** 30.80 ** 42.91 ** 48.05 ** 30.71 ** 54.27 ns 139981.16 ** R/E × S 12 20.57 ns 3.92 ns 08.66 ns 05.08 ns 8.40 ns 44.65 ns 36580.74 **
F/S 216 42.27 ** 32.24 ** 09.34 ** 34.22 ** 12.94 ** 114.32 ** 101807.35 ** E × F/S 216 29.83 * 6.48 ns 04.96 ns 17.39 ** 9.69 ** 63.62 ** 41247.97 **
Error 432 23.73 5.51 05.07 10.98 4.74 26.44 16139.40
Maximum 42.00 25.00 34.00 23.00 23.00 51.00 1440.00
Average 8.84 13.28 22.85 07.55 1.76 19.80 370.10
Minimum 0.00 3.83 09.00 00.00 0.00 2.00 7.00
CV (%) 55.10 17.68 09.85 43.86 123.11 25.97 34.32
Table 1 - Mean squares, general mean, maximum and minimum family mean values and coefficients of variation of the seven evaluated traits in the S1 families.
1/NDE = number of diseased ears; PE = popping expansion; ST = stand; BP = broken plants; PHE = poorly hulled ears; NE = number of
ears; GY = grain yield in kg ha-1.
2/E = Environments; S = Sets; R = Replications; F = Families.
present data set. Variations in stand figures here were probably genetic in origin, as opposed to environmental, in the absence of significant environmental effects for the trait.
Except for number of ears, the other traits pre-sented significant set-by-environment interaction figures (Table 1), indicating that genotype-by-environment inter-action was significant. This was confirmed for most traits by the significance of the ExF/S figure (Table 1).
The prospects for successfully continuing the pro-gram were shown by the significance of the mean square figures at an F-test probability of 1%, for all the traits considered in relation to families within sets. They indi-cate that there is enough genetic variability to be ex-ploited in future cycles. In addition, they show that the objective of the program - improving the population by recurrent selection without losing genetic variability - has probably been achieved by these first two recurrent se-lection cycles.
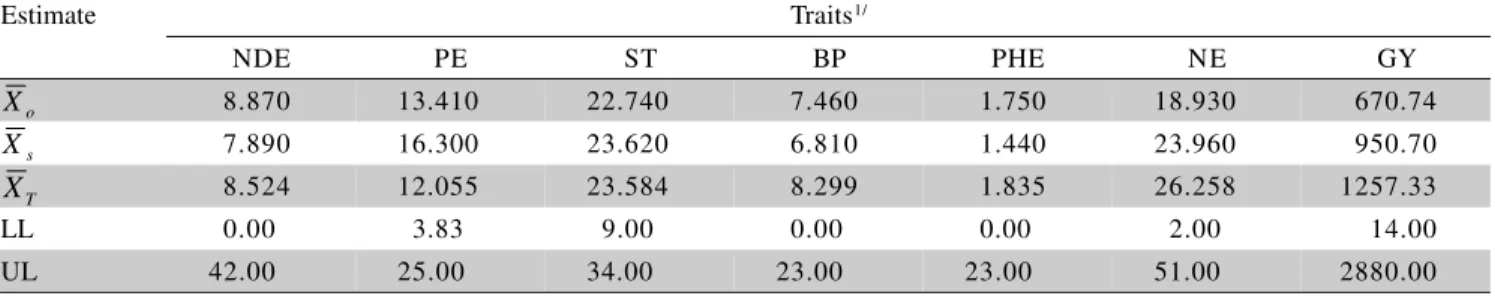
The estimated mean values for the initial popu-lation, plants selected, controls and variation amplitude (maximum and minimum mean values for the family) for the population under selection showed considerable dif-ferences, especially for the main traits considered - pop-ping and grain yield (Table 2). The existence of families with mean values higher than those of the selected
fami-lies and controls, combined with the relatively high heri-tability and genetic gain figures, guarantee the viability of continuing with recurrent selection cycles.
The difference in the variation amplitude also in-dicates genetic variability in the population. Excellent re-sults in obtaining superior materials were also reported by Pacheco et al. (1998), using the upper and lower lim-its for popping and grain yield to predict superior recom-bination in the CMS-42 and CMS-43 populations of the second recurrent selection cycle. The upper limit can rise through selection gain, which means that a maximum value detected in a given cycle can be lower than the maximum for the following cycle, and thus successively with the increase and recombination of favorable alleles in the population.
In the controls, grain yield (Table 2) was higher than both the mean of the original population and the mean of the selected families. This was expected since heterosis for grain yield in maize is widely acknowledged (Falconer, 1987; Hallauer & Miranda Filho, 1981) and
the observed inbreeding yield drop for the S1 families is
natural. However, given that the superior S1 families will
be recombined, this will restore the productive potential of the population, and there is some predicted genetic gain for yield as the most productive families are recom-bined, increasing the frequency of favorable alleles.
Genetic Parameters
Traits1/
NDE PE ST BP PHE NE GY
10.567 8.060 2.335 8.555 3.2350 28.580 25451.840
4.632 6.680 1.066 5.809 2.048 21.968 21416.987
23.738 5.519 5.073 10.981 4.745 26.446 16139.407
% 43.85 82.91 45.71 67.91 63.37 76.87 84.15
GG% -4.940 17.800 1.770 -5.440 -9.580 16.400 26.950
GG -0.219 1.193 0.201 -0.202 -0.083 1.552 90.380
Table 3 - Phenotypic variance (σ2f), genotypic variance (
σ
2g), residual variance (σ
2), heritability on the family mean( 2
x
h
%) and genetic gain (GG) estimated for the evaluated traits.1/ NDE = number of diseased ears; PE = popping expansion; ST = stand; BP = broken plants; PHE = poorly hulled ears; NE = number of
ears; GY = grain yield in kg ha-1.
2
f
σ 2
g
σ 2 σ
2 x h
Estimate Traits1/
NDE PE ST BP PHE NE GY
8.870 13.410 22.740 7.460 1.750 18.930 670.74
7.890 16.300 23.620 6.810 1.440 23.960 950.70
8.524 12.055 23.584 8.299 1.835 26.258 1257.33
LL 0.00 3.83 9.00 0.00 0.00 2.00 14.00
UL 42.00 25.00 34.00 23.00 23.00 51.00 2880.00
Table 2 - Estimates of the means of the original population (Xo), selected families (Xs), controls (XT), lower limit (LL)
and upper limit (UL) of the populations evaluated.
1/NDE = number of diseased ears; PE = popping expansion; ST = stand; BP = broken plants; PHE = poorly hulled ears; NE = number of
ears; GY = grain yield in kg ha-1.
o
X
s
X
T
Based on the genetic component estimates (Table 3), residual variance was lower than the genotypic vari-ance for popping expansion and grain yield. In addition, these two traits presented high heritability values (above 80%). Such results lead us to expect significant genetic gains from selection for both popping expansion and grain yield, the two most important traits in popcorn breeding.
In this study, the use of the Smith (1936) and Hazel (1943) selection index (Table 4) resulted in higher genetic gain for grain yield than for popping expansion. One explanation for the observed results lies in the economic weights assigned to individual traits. These economic weights are linked to the possibility of obtain-ing satisfactory gain for poppobtain-ing expansion (of the or-der of three units) while also ensuring good grain yield for the population, without which there is obviously no justification for the future release of an improved vari-ety.
However, for both traits (popping and grain yield), genetic gains were very high, especially by comparison with the results of the first cycle of this same population. One reason for this is the type of
progeny used: full-sib for the first cycle and S1 families
for the second. Since additive variance is much
more significant between S1 families than between
full-sib families, the results are quite justifiable (Vilarinho, 2001). Another factor that helps to clarify this situation is the greater number of progenies evalu-ated in the second cycle, allowing a wider selection dif-ferential.
The relevance of the selection index for a pop-corn breeding program was confirmed by Matta (2000) whose results also showed improvements for both pop-ping expansion and grain yield.
The forecast for popping expansion gain in the first recombination cycle was 10.39%, based on an ini-tial mean value equivalent to an increase of 0.573 units/
year (Table 4). However, after evaluating the popping mean obtained from the original population for cycle 2, the real gain was higher, with an increase of 22.00% on the original population, representing 1.185 units/year (Table 4).
CONCLUSIONS
The effect of sets was significant for the NED, PE, BP, PHE and NE traits, confirming that the use of this source of variation is both efficient and nec-essary.
The effect of family within the set was also sig-nificant, showing that the genetic variability of the popu-lation is high, with the prospect of further gains in fu-ture recurrent selection cycles.
Estimates of significant genetic gains for the most important traits (grain yield and popping expansion) promise further success as the breeding program contin-ues.
REFERENCES
ANDRADE, R.A. Cruzamentos dialélicos entre seis variedades de milho-pipoca (Diallelic crossing of six popcorn varieties). Viçosa: UFV, 1996.
79p. (Dissertação – M.S.).
COIMBRA, R.R. Seleção entre famílias de meios-irmãos da população DFT1-Ribeirão de milho pipoca (Selection between half-sib families in
the DFT1-Ribeirão popcorn population).Viçosa: UFV, 2000. 54p.
(Dissertação – M.S.).
CRUZ, C.D. Programa Genes: Versão Windows; aplicativo computacional em genética e estatística.Viçosa: UFV, 2001. 648p.
DAROS, M.; AMARAL JR., A.T.; PEREIRA, M.G. Genetic gain for grain yield and popping expansion in full-sib recurrent selection in popcorn. Crop Breeding and Applied Biotechnology, v.2, p.339-344, 2002.
EMPRESA BRASILEIRA DE PESQUISA AGROPECUÁRIA. Recomendações técnicas para o cultivo do milho (Technical
recommendations for maize cultivation). Sete Lagoas: EMBRAPA,
CNPMS, 1993. 204p.
FALCONER, D.S. Introdução à genética quantitativa (Introduction to
quantative genetics). 1.ed. Viçosa: UFV, 1987. 279p.
FANCELLI, A.L.; DOURADO NETO, D. Produção de milho (Maize
production). Guaíba: Agropecuária, 2000. 360p.
GALVÃO, J.C.C.; SAWAZAKI, E.; MIRANDA, G.V. Comportamento de híbridos de milho pipoca em Coimbra, Minas Gerais(Behaviour of
popcorn hybrids in Coimbra, Minas Gerais). Revista Ceres, v.47,
p.201-218, 2000.
GAMA, E.E.G.; MAGNAVACA, R.; SILVA, J.B. da; SANS, L.M.A.; VIANA, P.A.; PARENTONI, S.N.; PACHECO, C.A.P.; CORREA, L.A.; FERNANDES, F.T. Milho-pipoca (Popping maize). Informe
Agropecuário, v.14, p.12-16, 1990.
HALLAUER, A.R.; MIRANDA FILHO, J.B. Quantitative genetics in maize breeding. Ames: Iowa State University Press, 1981. 468p. HAZEL, L.N. The genetic basis for constructing selection indexes. Genetics,
v.28, p.476–490, 1943.
LINARES, E.Seleção recorrente recíproca em famílias de meio-irmãos em milho pipoca (Zea mays L.) (Reciprocal recurrent selection in half-sib
popcorn families). Piracicaba: USP/ESALQ, 1987. 78p. (Dissertação
-M.S.).
MATTA, F. de P. Seleção entre e dentro de famílias de meios-irmãos na população de milho pipoca Beija-flor(Zea mays L.) (Selection between and within half-sib families of the Beija-flor popcorn population) Viçosa:
UFV, 2000. 83p. (Dissertação - M.S.).
CYCLE 1 CYCLE 2
Estimate Traits
PE GY PE GY
11.04 1060.00 13.410 670.74 12.52 1140.00 16.300 950.70 11.08 1110.83 12.05 1257.33
LI 7.79 380.00 3.830 14.00
LS 15.32 1680.00 25.000 2880.00 GG (%) 10.39 4.69 17.80 26.95
Table 4 - Estimates of the original population mean (Xo),
selected population mean (
s
X ), lower and upper
limits and genetic gains (%) predicted for popping expansion (PE) and grain yield (GY) in both cycles.
o
X
s
X
T
Received July 31, 2003 Accepted September 03, 2004 PACHECO, C.A.P.; GAMA, E.P.; GUIMARÃES, P.E.O.; SANTOS, M.X.;
FERREIRA, A.S. Estimativas de parâmetros genéticos nas populações CMS-42 e CMS-43 de milho pipoca (Estimates of genetic parameters
in CMS-42 and CMS-43 popcorn populations). Pesquisa Agropecuária
Brasileira, v.33, p.1995-2001, 1998.
PEREIRA, M.G.; AMARAL JR., A.T. Estimation of genetic components in popcorn based on the nested design. Crop Breeding and Applied Biotechnology, v.1, p.3–10, 2001.
SAS INSTITUTE INC. SAS user’s guide: statistics. 5.ed. Cary, 1985. 958p. SMITH, H.F. A discriminant function for plant selection. Annals of
Eugenics, v.7, p.240–250, 1936.
VILARINHO, A.A. Seleção de progênies endogâmicas S1 e S2 em programas de melhoramento intrapopulacional e de produção de híbridos de milho pipoca (Zea mays L.) Viçosa: UFV, 2001. 79p. (Dissertação – M.S.).
WHITTELL, G. The Times. 2002. http://www.estado.estadao.com.br/ editorias/2002/05/02/ger 011.html-29k (20 nov. 2002).