Submitted7 March 2016
Accepted 26 August 2016
Published20 October 2016
Corresponding author
John J. Lees,
Academic editor
Mark Young
Additional Information and Declarations can be found on page 24
DOI10.7717/peerj.2495 Copyright
2016 Lees et al.
Distributed under
Creative Commons CC-BY 4.0
OPEN ACCESS
The influence of flight style on the
aerodynamic properties of avian wings
as fixed lifting surfaces
John J. Lees1, Grigorios Dimitriadis2and Robert L. Nudds1
1Faculty of Life Sciences, University of Manchester, Manchester, United Kingdom
2Department of Aerospace and Mechanical Engineering, University of Liège, Liège, Belgium
ABSTRACT
The diversity of wing morphologies in birds reflects their variety of flight styles and the associated aerodynamic and inertial requirements. Although the aerodynamics underlying wing morphology can be informed by aeronautical research, important differences exist between planes and birds. In particular, birds operate at lower, transitional Reynolds numbers than do most aircraft. To date, few quantitative studies have investigated the aerodynamic performance of avian wings as fixed lifting surfaces and none have focused upon the differences between wings from different flight style groups. Dried wings from 10 bird species representing three distinct flight style groups were mounted on a force/torque sensor within a wind tunnel in order to test the hypothesis that wing morphologies associated with different flight styles exhibit different aerodynamic properties. Morphological differences manifested primarily as differences in drag rather than lift. Maximum lift coefficients did not differ between groups, whereas minimum drag coefficients were lowest in undulating flyers (Corvids). The lift to drag ratios were lower than in conventional aerofoils and data from free-flying soaring species; particularly in high frequency, flapping flyers (Anseriformes), which do not rely heavily on glide performance. The results illustrate important aerodynamic differences between the wings of different flight style groups that cannot be explained solely by simple wing-shape measures. Taken at face value, the results also suggest that wing-shape is linked principally to changes in aerodynamic drag, but, of course, it is aerodynamics during flapping and not gliding that is likely to be the primary driver.
SubjectsAnimal Behavior, Zoology
Keywords Flight, Wings, Aerodynamics, Flight style, Lift, Drag
INTRODUCTION
Birds exhibit a remarkable range of wing morphologies and flight styles. Aerodynamic theory, primarily derived from aeronautical research, broadly explains the basis for many of the observed avian wing types. Clearly, however, important differences exist between aircraft and birds. In particular, birds operate at intermediate, transitional Reynolds
numbers (Re≈105) and have twisted, roughened wings composed of discreet, deformable
elements (Carruthers et al., 2010). The former property makes birds of interest to the
designers of unmanned air vehicles (UAVs), which operate at similar transitionalRe.
Despite broad interest regarding the aerodynamics of avian flight, however, there are relatively few comparative, empirical studies relating wing morphology to measured aerodynamic parameters.
Wings can be categorised according to their shape, which may then be related to the flight
style with which their aerodynamic and inertial properties are associated (Rayner, 1988;
Viscor & Fuster, 1987). Aspect ratio (AR, the ratio of wing span to mean chord) is a critical
morphological determinant of wing performance, with largeAR(characteristic of high
speed or soaring species) reducing induced drag and providing greater maximum lift to drag
ratios, particularly at slow speeds, where induced drag is relatively high (Withers, 1981).
Low ARwings are associated with high flapping frequency, increased thrust generation
and enhanced manoeuvrability during flapping flight and are accordingly characteristic
of many songbirds as well as species utilising ground take-off (Drovetski, 1996). Wingtip
shape indices, such as the level of pointedness and convexity and wing loading are also intimately linked to flight style (Lockwood, Swaddle & Rayner, 1998;Viscor & Fuster, 1987).
For example, migrants such as ducks have high wing loading and short, narrow (highAR)
and pointed wings associated with reduced wing inertia and induced and profile drag, suited
to fast airspeeds (U, m s−1) and high flapping frequencies (Alerstam et al., 2007;Lockwood,
Swaddle & Rayner, 1998). Accessory wing structures may also tune the aerodynamics of
wings. For example, slotted wingtips common to soaring birds help to reduce the high
induced drag requirements of low speed flight (Lockwood, Swaddle & Rayner, 1998).
Although explanations for the observed variation in avian wing morphology are well
established, quantitative, comparative avian aerodynamic studies are relatively few (Dial,
Heers & Tobalske, 2012;Kruyt et al., 2014;Nachtigall & Kempf, 1971;Withers, 1981). This
may be in part due to the difficulty in measuring wing aerodynamics on free flying birds in the wild or in wind tunnels. Aerodynamic parameters, however, can be derived from the gliding or soaring performance of birds. Components of lift and drag are inferred
from parameters such as sink speed/airspeed and glide angle (Henningsson & Hedenström,
2011;Pennycuick, 1968;Raspet, 1960;Rosen & Hedenstrom, 2001); the changing profiles
of sections along the wing (Carruthers et al., 2010); the wake properties (Henningsson
& Hedenström, 2011; Pennycuick et al., 1992) and pressure distributions over the wing
(Usherwood, Hedrick & Biewener, 2003) at different flight velocities. Nonetheless, the
continuous changes inARand angle of attack in both gliding and particularly in flapping
birds preclude systematic quantifications of the aerodynamic properties of wings as a function of shape or position (i.e., as a fixed lifting surface). The control of wing-shape and wing position relative to the freestream can only be obtained from instrumented
wings which are either static or robotically controlled (Bahlman, Swartz & Breuer, 2014).
These simplified experiments are important as a foundation for understanding the more
complex aerodynamics of dynamic, flapping flight across different flight groups (Spedding
et al., 2008). Furthermore, testing static wings can reveal novel passive aerodynamic
mechanisms, for example, the reduction of flow separation, which may be applicable to
small, fixed-wing air vehicles (Álvarez et al., 2001;Bokhorst et al., 2015). Understanding the
link between extant avian wing morphology and aerodynamics may also inform predictions
regarding the flight capabilities of extinct species (Wang & Clarke, 2015;Wang, Mcgowan
& Dyke, 2011).
Comparative aerodynamic wind tunnel data for static bird wings are few (Drovetski,
Withers, 1981).Withers (1981)focused on the fixed wings of 8 bird species, ranging from swifts to hawks. Although the form of lift and drag characteristics were similar to those
seen in man-made wings, normalised values of the lift and drag coefficients (Clift,Cdrag,
respectively) were lower and higher, respectively in the bird wings. These quantitative
differences can be the result of low Reynolds numbers (Re), rough surface quality, high
flexibility and morphological differences, overall resulting in low Clift:Cdrag ratios in
birds compared to aeroplanes. The diversity of flight styles and wing shapes used in the study, however, and low sample numbers representing each group preclude a more detailed assessment of the relationship between morphology, flight style and static wing aerodynamics. Here, the aerodynamic properties of the fixed wings of 10 bird species comprising three broad flight style groups were determined. We tested the hypothesis that the morphologies associated with different flight styles drive differences in the static lift and drag properties of avian wings.
MATERIALS AND METHODS
Wings were obtained from 10 species of bird (Table 1), including the common snipe,
Gallinago gallinago (Linnaeus, 1758), Eurasian magpie, Pica pica (Linnaeus, 1758),
European golden plover,Pluvialis apricaria(Linnaeus, 1758), jackdaw,Corvus monedula
(Linnaeus, 1758), Eurasian jay,Garrulus glandarius(Linnaeus, 1758) mallard duck,Anas
platyrhynchos(Linnaeus, 1758) teal duck,Anas crecca(Linnaeus, 1758), woodcock,Scolopax rusticola(Linnaeus, 1758) woodpigeon,Columba palumbus(Linnaeus, 1758) and wigeon
duck,Anas Penelope(Linnaeus, 1758). Wings were pinned in a fully extended position and
dried using borax (sodium tetraborate, minerals-water Ltd, Essex, UK). Although birds actively change wing area depending on their speed and angle of attack, a fully extended wing allows a benchmark for comparison between species. In some instances, contraction of the wings occurred during the drying process, mainly at the outermost primaries. This is an unavoidable consequence of sample preparation. It is likely, however, that the effect upon wing measures such as camber, shape and area was small and, importantly, there is no reason to expect that broad morphological differences between flight style groups were not maintained. In order to compare the aerodynamic properties of the wings in isolation, it was necessary to remove the body and rectrices of the birds prior to drying and mounting. Lift and drag data presented are thus likely to be underestimates of those in gliding birds. Although the exposed proximal ends of the prepared wings will have resulted in an increased drag compared to those smoothly faired to a bird’s body, minimum drag
coefficients and lift coefficients will be minimally affected (Withers, 1981). This source of
error is also consistent for all of the wings tested. Wing morphological measures, including
semi span (bsemi, m), and projected area (S, m2) were taken from photographs using image
J (version 1.48V, US National Institutes of Health, Bethesda, MD, USA (2014)).ARwas
calculated from these measures as 2bsemi2/S. Wing pairs were attached to force/torque
sensors mounted in the centre of the University of Liège Multi-Disciplinary Low Speed
Wind Tunnel. This subsonic closed loop wind tunnel has a working section of 2×1.5×5
m (width×height×length) and a speed range of 2–60 m/s, with an average turbulence
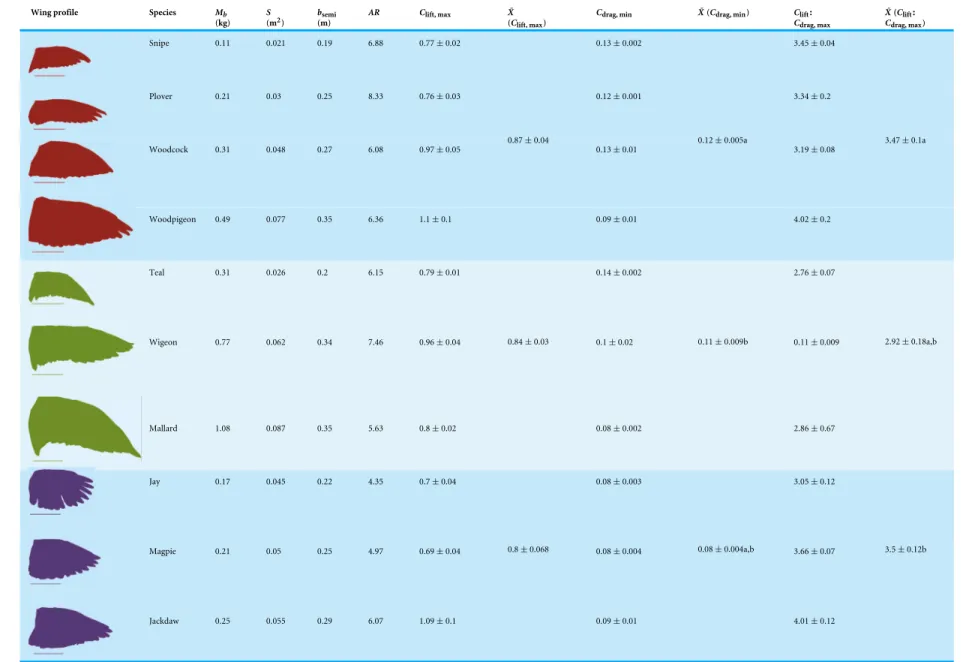
Table 1 Wing morphological measures and aerodynamic parameters of the differing flight style groups.Values are presented as the mean±se. Wing profile colours represent the three distinct flight styles as defined inViscor & Fuster, (1987); forward and bounding flapping flight (red), high frequency flapping flight (green) and undu-lating flight (purple). Letters indicate values, which are significantly different, as determined by ANOVA. Scale lines on wing outlines represent 0.1 m.
Wing profile Species Mb
(kg) S(m2) b(m)semi AR Clift, max X(¯C lift, max)
Cdrag, min X¯(Cdrag, min) Clift:
Cdrag, max
¯ X(Clift:
Cdrag, max)
Snipe 0.11 0.021 0.19 6.88 0.77±0.02 0.13±0.002 3.45±0.04
Plover 0.21 0.03 0.25 8.33 0.76±0.03 0.12±0.001 3.34±0.2
Woodcock 0.31 0.048 0.27 6.08 0.97±0.05 0.13±0.01 3.19±0.08
Woodpigeon 0.49 0.077 0.35 6.36 1.1±0.1
0.87±0.04
0.09±0.01
0.12±0.005a
4.02±0.2
3.47±0.1a
Teal 0.31 0.026 0.2 6.15 0.79±0.01 0.14±0.002 2.76±0.07
Wigeon 0.77 0.062 0.34 7.46 0.96±0.04 0.1±0.02 0.11±0.009
Mallard 1.08 0.087 0.35 5.63 0.8±0.02
0.84±0.03
0.08±0.002
0.11±0.009b
2.86±0.67
2.92±0.18a,b
Jay 0.17 0.045 0.22 4.35 0.7±0.04 0.08±0.003 3.05±0.12
Magpie 0.21 0.05 0.25 4.97 0.69±0.04 0.08±0.004 3.66±0.07
Jackdaw 0.25 0.055 0.29 6.07 1.09±0.1
0.8±0.068
0.09±0.01
0.08±0.004a,b
4.01±0.12
3.5±0.12b
Notes.
Lees
e
t
al.
(2016),
P
eerJ
,
DOI
level of 0.15%. To obtain accurate force readings, sensors of differing sensitivity were used depending on the magnitude of forces (in turn dependent on wing size) and consisted of Nano17 and Nano25 6-axis force/torque sensors (ATI Industrial Automation, Apex, NC,
USA). Lift and drag were measured at angles of attack (α,◦
) ranging from−20◦to 30◦in
10◦
increments. Wings were tested at airspeeds (U) of 8–16 m s−1, which were measured
using a pitot tube. The angle of attack of the sensor was set using an electronic spirit level
prior to each trial. Theαof the wings was arbitrarily defined as the angle of the head of the
sensor in the horizontal axis, which was close toαat mid-bsemi(when not aerodynamically
loaded) as a result of the wing mounting procedure. Henceα only represents a relative
point of comparison as the localαvaries continuously along the wing and at differentU as
a result of aeroelastic deformations. In order to minimize dihedral or anhedral effects, the leading edge of the wing (at the propatagium perpendicular to the angle of the secondary feather rachises) was set to a horizontal position with respect to the horizontal axis of the
sensor when at 0◦
α. To facilitate species comparisons, lift and drag were converted toClift
andCdragrespectively, using:
Clift= lift
0.5ρU2S (1)
Cdrag= drag
0.5ρU2S (2)
whereρis air density (kg m3). Species were placed into flight style groups following Viscor
(Viscor & Fuster, 1987) for statistical comparison. These consisted of forward flapping
species which primarily use a sustained horizontal flight (FF, Common snipe, European golden plover, woodcock and woodpigeon) at an elevated energetic cost, birds with high frequency flapping flight (HF, teal duck, wigeon duck and mallard duck) which is often coupled to their high respiratory frequency and is common to many aquatic and migratory species and species which utilize undulating flight (UF, jay, Eurasian magpie and jackdaw), in which there is a period of powered flight followed by a period of gliding.
Statistics
Analysis of variance (ANOVA) was used to test for differences between flight style
groups inClift at theαresulting in the maximumClift(Clift, max),Cdragat the αresulting
in the minimum Cdrag (Cdrag, min) and Clift:Cdrag at the α resulting in the maximum
Clift:Cdrag(Clift:Cdrag, max). Differences in the incremental responses ofClift, max,Cdrag, min andClift:Cdrag, maxtoARandSwere investigated using analysis of covariance (ANCOVA). The slopes and intercepts were tested for differences and where the interaction term (i.e.,
flight style xAR) was non-significant, the analysis was rerun assuming parallel lines (i.e.,
the interaction term was removed). Where interaction terms were significant, post hoc
Fisher’s least significant difference procedure multiple comparison tests were employed. ANOVAs were conducted using SPSS v.22 (IBM, Somers, NY, USA) and ANCOVAs were conducted using the statistics toolbox in Matlab R2013a (The MathWorks, Inc., Natick, MA, USA). We felt that the use of phylogenetically controlled statistical analyses was not required given the relatively small sample size of the data and the fact that within flight
style groups most of the species are closely related, with HF consisting of birds from the same family (Anatidae), UF consisting of birds from the same family (Corvidae) and 3 of the 4 species in the FF group consisting of birds from the same order (Charadriiformes). Therefore testing for differences between flight style groups and evolutionarily related groups would essentially be the same statistical test.
RESULTS
Lift
Lift was influenced by bothUandα, increasing linearly withUat positiveαand decreasing
linearly withU at negativeα (Fig. 1,Tables 2and3). The influence ofαupon the slope
of the relationship between lift andU differed between species. In general, there was a
significant increase in slope withαfrom 0◦
to 10◦
. Beyond these intermediateαinterspecies
differences in lift were less pronounced. In some cases, lift decreased beyond the optimal
α, meaning peak lift did not always correspond to maximumα. Maximum lift increased
withS, but did not correlate withAR.
The relationship betweenCliftandαat low and intermediate values ofα(beyond which
Cliftremained relatively constant) was best fit using either linear curve fits or polynomial
curves of both second and third order (Fig. 2andTable 4).
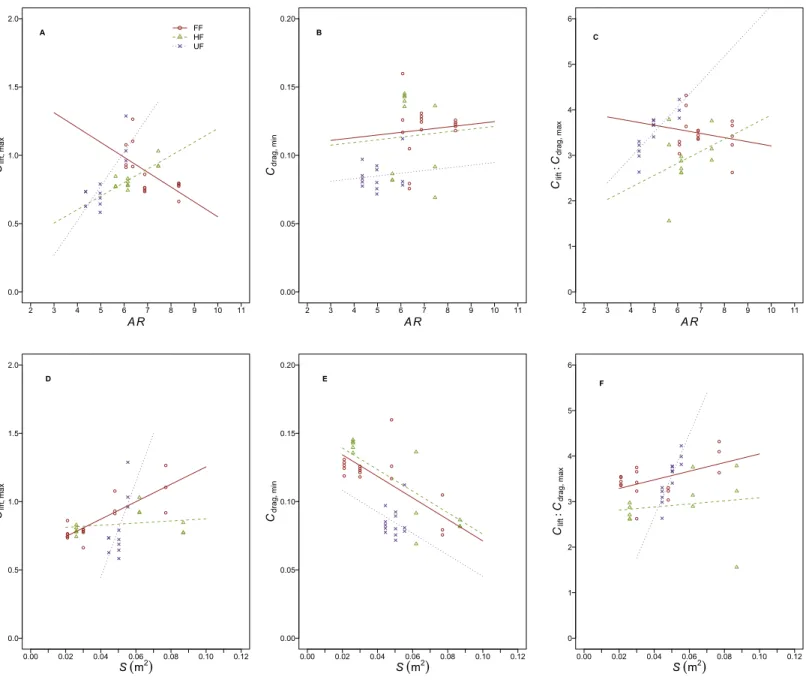
The incremental change inClift, maxwithARdiffered (flight style,F2,32=0.19,r2=0.005,
p=0.83;AR,F1,32=0.34,r2=0.005, p=0.56; flight style xAR,F2,32=18.8,r2=0.5,
p<0.001) between flight style groups (Fig. 3AandTable 5). Apost hoctest showed the slope
of this relationship to differ between all three flight style groups, withClift, maxincreasing
withARin HF and UF birds but decreasing in FF birds. The incremental change inClift, max
with Sdiffered (flight style,F2,32=3.06,r2=0.08,p=0.06;S,F1,32=15.8,r2=0.21,
p<0.001 ; flight style xS,F2,32=10.9,r2=0.29,p<0.001) between flight style groups (Fig. 3D). Apost hoc test showed both the slope and intercept of this relationship to differ between flight style groups with the exception of the intercept of FF and HF birds, which were similar.
The incremental increase in the relationship between maximumCliftand wing loading
(Q, kg/m2) differed between flight style groups (flight style,F2,32=1.85,r2=0.08,
p=0.17;Q,F1,32=2.54,r2=0.05,p=0.12; flight style xQ,F2,32=5.48,r2=0.22,
p<0.01). Apost hoctest indicated the slope of this relationship to differ in UF birds when
compared to FF and HF species, which were similar. The intercept only differed between FF and UF birds.
There was a significant effect of species uponClift, max(F9,28=11.08,p<0.001).Clift, max
was highest in the woodpigeon (1.1±0.1N) and jackdaw (1.1±0.1N). Apost hoctest
showedClift, maxto be significantly higher in these two species than in any other birds
except the wigeon (0.96±0.04N).Clift, maxhowever did not differ (F2,35=0.56,p=0.57)
between flight styles (Table 1).
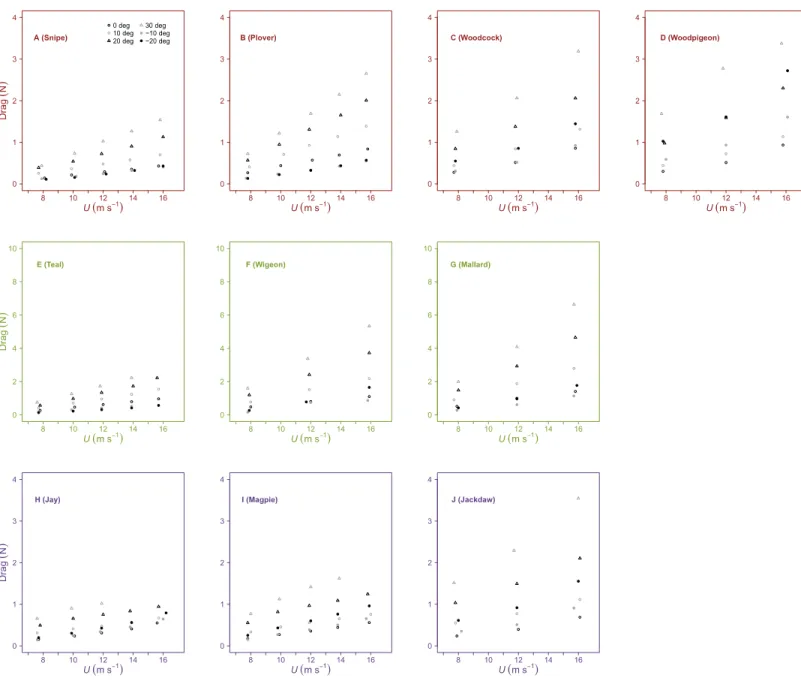
Drag
Drag increased withU at allαand, in general, drag increased with less negative values of
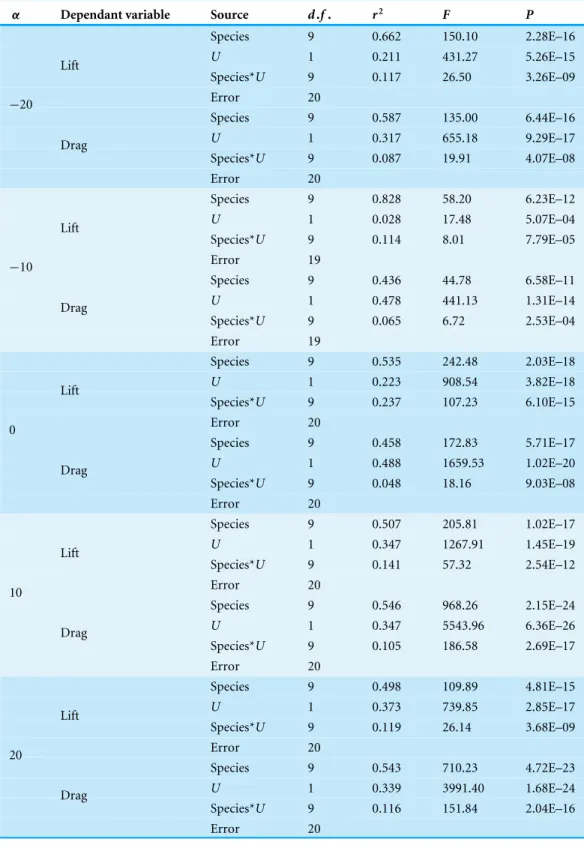
Table 2 Summary of the ANCOVA analysis for the aerodynamic properties of static wings with air-speed at different angles of attack.
α Dependant variable Source d.f. r2 F P
Species 9 0.662 150.10 2.28E–16
U 1 0.211 431.27 5.26E–15
Species*U 9 0.117 26.50 3.26E–09
Lift
Error 20
Species 9 0.587 135.00 6.44E–16
U 1 0.317 655.18 9.29E–17
Species*U 9 0.087 19.91 4.07E–08
−20
Drag
Error 20
Species 9 0.828 58.20 6.23E–12
U 1 0.028 17.48 5.07E–04
Species*U 9 0.114 8.01 7.79E–05
Lift
Error 19
Species 9 0.436 44.78 6.58E–11
U 1 0.478 441.13 1.31E–14
Species*U 9 0.065 6.72 2.53E–04
−10
Drag
Error 19
Species 9 0.535 242.48 2.03E–18
U 1 0.223 908.54 3.82E–18
Species*U 9 0.237 107.23 6.10E–15
Lift
Error 20
Species 9 0.458 172.83 5.71E–17
U 1 0.488 1659.53 1.02E–20
Species*U 9 0.048 18.16 9.03E–08
0
Drag
Error 20
Species 9 0.507 205.81 1.02E–17
U 1 0.347 1267.91 1.45E–19
Species*U 9 0.141 57.32 2.54E–12
Lift
Error 20
Species 9 0.546 968.26 2.15E–24
U 1 0.347 5543.96 6.36E–26
Species*U 9 0.105 186.58 2.69E–17
10
Drag
Error 20
Species 9 0.498 109.89 4.81E–15
U 1 0.373 739.85 2.85E–17
Species*U 9 0.119 26.14 3.68E–09
Lift
Error 20
Species 9 0.543 710.23 4.72E–23
U 1 0.339 3991.40 1.68E–24
Species*U 9 0.116 151.84 2.04E–16
20
Drag
Error 20
(continued on next page)
Table 2(continued)
α Dependant variable Source d.f. r2 F P
Species 9 0.498 101.74 2.09E–12
U 1 0.399 734.77 8.44E–15
Species*U 9 0.094 19.29 5.71E–07
Lift
Error 16
Species 9 0.523 403.40 3.95E–17
U 1 0.372 2582.50 4.07E–19
Species*U 9 0.102 78.56 1.56E–11
30
Drag
Error 16
Notes.
U, airspeed (m s−1), Lift and Drag are presented in N.
andU increased with increasingα. Minimum values of drag increased withSbut were not
correlated withAR.
Cdragchanged curvilinearly withα, decreasing slightly in magnitude fromα= −20◦to
0◦and increasing at higherα(Fig. 2andTable 4).
The incremental change in Cdrag, min with AR was not different (flight style xAR,
F2,34=0.11,r2=0.01,p=0.89) between flight style groups (Fig. 3B andTable 5).
Furthermore,Cdrag, minwas not affected byARbut differed between flight style groups
(flight style,F2,36=3.5,r2=0.16,p<0.05;AR,F1,36=0.19,r2=0.004,p=0.66). Apost
hoctest suggested that UF birds have a lowerCdrag, minthan the HF group (mean difference
=0.03, 95% CI [0.0046–0.0482]) and the FF species (mean difference=0.03, 95% CI
[0.005–0.055]). The incremental change inCdrag, minwithSdid not differ (flight style xS,
F2,34=1.9,r2=0.03,p=0.16) between flight style groups (Fig. 3EandTable 5).Cdrag, min
decreased withS(common slope= −0.79) and differed between flight style groups (flight
style,F2,36=16.33,r2=0.3,p<0.001;S,F1,36=39.54,r2=0.36,p<0.001). Apost hoc
test showed UF birds to be lower in terms ofCdrag, minthan HF birds (mean difference=
0.03, 95% CI [0.002–0.2]) but not FF birds.
The incremental change in minimumCdrag withQwas different between flight style
groups, and was negative in FF and HF birds but positive in UF species (flight style,
F2,34=13.78,r2=0.32,p<0.001; Q,F1,34=3.57,r2=0.04,p=0.07; flight style xQ,
F2,34=10.24,r2=0.24,p<0.001). Apost hoctest showed a difference in the slope and intercept of this relationship between HF birds compared to the other two style groups, which were similar.
There was a significant effect of species uponCdrag, min(F9,30=12.94,p<0.001). The
lowest Cdrag, minvalues were found in the jay (0.085±0.003), magpie (0.082 ±0.004),
mallard (0.083±0.002), woodpigeon (0.087±0.009) and jackdaw (0.09±0.011). Apost
hoc test showed that these values were not significantly different but were significantly
lower than in all species except the wigeon and woodpigeon. The highest value ofCdragwas
found in the teal duck (0.14±0.002). A post hoc test showed that this value was higher
than in any other species with the exception of the snipe and woodcock.Cdrag, min(Table 1)
was significantly influenced by flight style (F2,37=10.09,p<0.001). Apost hoctest showed
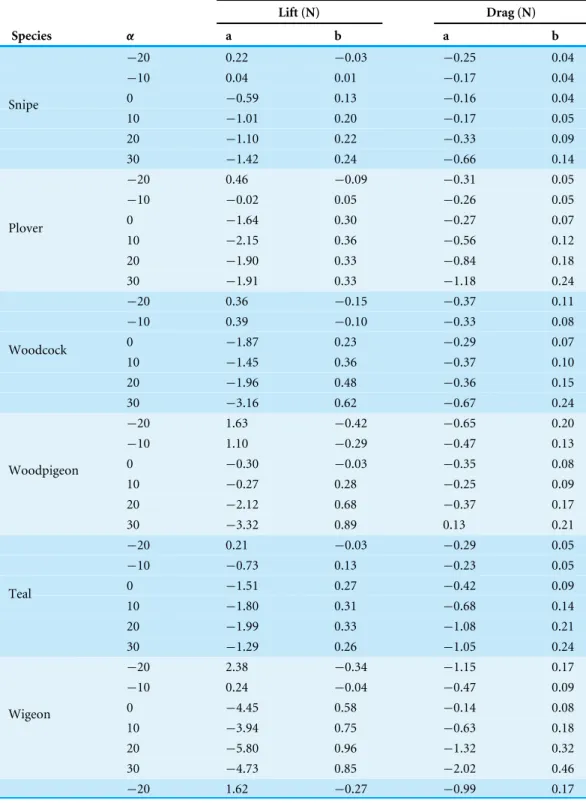
Table 3 Summary of the regressions from the ANCOVA analysis of static wing aerodynamic proper-ties with airspeed at different angles of attack.Regressions are presented asY=bU+a, whereYis the dependant variable,ais a constant,bis the regression slope andUis airspeed (m s−1).
Dependant variable
Lift (N) Drag (N)
Species α a b a b
−20 0.22 −0.03 −0.25 0.04
−10 0.04 0.01 −0.17 0.04
0 −0.59 0.13 −0.16 0.04
10 −1.01 0.20 −0.17 0.05
20 −1.10 0.22 −0.33 0.09
Snipe
30 −1.42 0.24 −0.66 0.14
−20 0.46 −0.09 −0.31 0.05
−10 −0.02 0.05 −0.26 0.05
0 −1.64 0.30 −0.27 0.07
10 −2.15 0.36 −0.56 0.12
20 −1.90 0.33 −0.84 0.18
Plover
30 −1.91 0.33 −1.18 0.24
−20 0.36 −0.15 −0.37 0.11
−10 0.39 −0.10 −0.33 0.08
0 −1.87 0.23 −0.29 0.07
10 −1.45 0.36 −0.37 0.10
20 −1.96 0.48 −0.36 0.15
Woodcock
30 −3.16 0.62 −0.67 0.24
−20 1.63 −0.42 −0.65 0.20
−10 1.10 −0.29 −0.47 0.13
0 −0.30 −0.03 −0.35 0.08
10 −0.27 0.28 −0.25 0.09
20 −2.12 0.68 −0.37 0.17
Woodpigeon
30 −3.32 0.89 0.13 0.21
−20 0.21 −0.03 −0.29 0.05
−10 −0.73 0.13 −0.23 0.05
0 −1.51 0.27 −0.42 0.09
10 −1.80 0.31 −0.68 0.14
20 −1.99 0.33 −1.08 0.21
Teal
30 −1.29 0.26 −1.05 0.24
−20 2.38 −0.34 −1.15 0.17
−10 0.24 −0.04 −0.47 0.09
0 −4.45 0.58 −0.14 0.08
10 −3.94 0.75 −0.63 0.18
20 −5.80 0.96 −1.32 0.32
Wigeon
30 −4.73 0.85 −2.02 0.46
−20 1.62 −0.27 −0.99 0.17
(continued on next page)
Table 3(continued)
Dependant variable
Lift (N) Drag (N)
Species α a b a b
−10 0.16 −0.01 −0.63 0.11
0 −3.69 0.57 −0.37 0.11
10 −4.47 0.84 −0.92 0.24
20 −6.46 1.08 −1.81 0.41
Mallard
30 −6.53 1.10 −2.91 0.60
−20 0.35 −0.08 −0.37 0.07
−10 0.25 −0.04 −0.33 0.06
0 0.52 0.01 −0.24 0.05
10 0.33 0.09 −0.02 0.04
20 −0.24 0.20 0.08 0.06
Jay
30 −1.05 0.30 0.03 0.08
−20 0.62 −0.13 −0.42 0.09
−10 0.34 −0.06 −0.34 0.06
0 0.20 0.04 −0.20 0.05
10 −0.40 0.20 −0.07 0.05
20 −1.62 0.39 −0.05 0.08
Magpie
30 −2.25 0.44 −0.34 0.14
−20 0.58 −0.22 −0.38 0.12
−10 0.22 −0.12 −0.30 0.07
0 0.98 −0.01 −0.22 0.05
10 0.26 0.25 −0.01 0.07
20 −1.38 0.53 0.004 0.13
Jackdaw
30 −3.77 0.77 −0.44 0.25
Notes.
α, angle of attack (◦).
of the UF group (0.08±0.003).Cdragat theαcorresponding to the maximumClift:Cdrag
was significantly different between species (F9,30=11.18,p<0.001) and between flight
style groups (F2,37=8.14,p<0.01). MeanCdragvalues were highest in the HF species (0.23
±0.02) and lowest in the UND species (0.14±0.01).
Lift:Drag
PeakClift:Cdragwas recorded atα=0◦and 10◦(Fig. 2) and values decreased above or below
this optimalα, with negative values at the lowestα(−20◦).
The incremental change inClift:Cdrag, maxwithAR(Fig. 3CandTable 5) differed between
flight style groups (flight style,F2,34=8.11,r2=0.26,p<0.01;AR,F1,34=2.65,r2=0.04
p=0.11; flight style xAR F2,34=4.71,r2=0.15,p<0.05). Apost hoc test showed the slope and intercept of this relationship to differ only between FF and UF species.
The incremental change inClift:Cdrag, maxwithS(Fig. 3FandTable 5) was positive and
different between flight style groups (flight style, F2,34=8.86,r2=0.27,p<0.001;S,
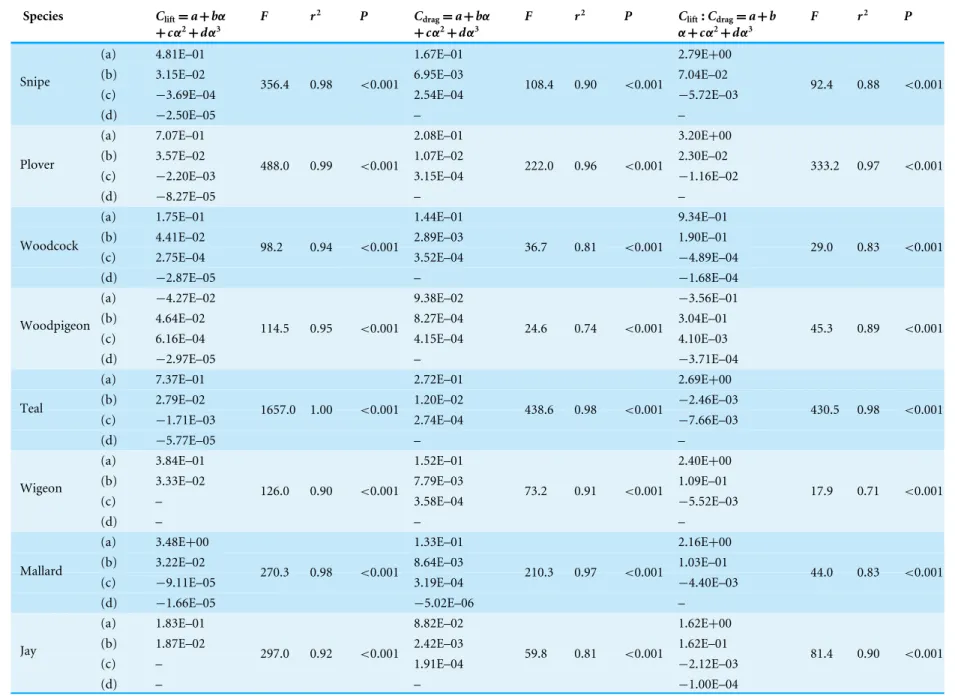
Table 4 Summary of the regression analyses for the aerodynamic properties of static bird wings as a function of their angle of attack.Regressions are presented as
Y=a+bα+cα2+dα3, whereais a constant andb,canddare the first, second and third order terms, respectively. Higher order terms are omitted where they did not improve the model fit further.
Species Clift=a+bα
+cα2+dα3
F r2 P Cdrag=a+bα
+cα2+dα3
F r2 P Clift:Cdrag=a+b
α+cα2+dα3
F r2 P
(a) 4.81E–01 1.67E–01 2.79E+00
(b) 3.15E–02 6.95E–03 7.04E–02
(c) −3.69E–04 2.54E–04 −5.72E–03
Snipe
(d) −2.50E–05
356.4 0.98 <0.001
–
108.4 0.90 <0.001
–
92.4 0.88 <0.001
(a) 7.07E–01 2.08E–01 3.20E+00
(b) 3.57E–02 1.07E–02 2.30E–02
(c) −2.20E–03 3.15E–04 −1.16E–02
Plover
(d) −8.27E–05
488.0 0.99 <0.001
–
222.0 0.96 <0.001
–
333.2 0.97 <0.001
(a) 1.75E–01 1.44E–01 9.34E–01
(b) 4.41E–02 2.89E–03 1.90E–01
(c) 2.75E–04 3.52E–04 −4.89E–04
Woodcock
(d) −2.87E–05
98.2 0.94 <0.001
–
36.7 0.81 <0.001
−1.68E–04
29.0 0.83 <0.001
(a) −4.27E–02 9.38E–02 −3.56E–01
(b) 4.64E–02 8.27E–04 3.04E–01
(c) 6.16E–04 4.15E–04 4.10E–03
Woodpigeon
(d) −2.97E–05
114.5 0.95 <0.001
–
24.6 0.74 <0.001
−3.71E–04
45.3 0.89 <0.001
(a) 7.37E–01 2.72E–01 2.69E+00
(b) 2.79E–02 1.20E–02 −2.46E–03
(c) −1.71E–03 2.74E–04 −7.66E–03
Teal
(d) −5.77E–05
1657.0 1.00 <0.001
–
438.6 0.98 <0.001
–
430.5 0.98 <0.001
(a) 3.84E–01 1.52E–01 2.40E+00
(b) 3.33E–02 7.79E–03 1.09E–01
(c) – 3.58E–04 −5.52E–03
Wigeon
(d) –
126.0 0.90 <0.001
–
73.2 0.91 <0.001
–
17.9 0.71 <0.001
(a) 3.48E+00 1.33E–01 2.16E+00
(b) 3.22E–02 8.64E–03 1.03E–01
(c) −9.11E–05 3.19E–04 −4.40E–03
Mallard
(d) −1.66E–05
270.3 0.98 <0.001
−5.02E–06
210.3 0.97 <0.001
–
44.0 0.83 <0.001
(a) 1.83E–01 8.82E–02 1.62E+00
(b) 1.87E–02 2.42E–03 1.62E–01
(c) – 1.91E–04 −2.12E–03
Jay
(d) –
297.0 0.92 <0.001
–
59.8 0.81 <0.001
−1.00E–04
81.4 0.90 <0.001
(continued on next page)
Table 4(continued)
Species Clift=a+bα
+cα2+dα3
F r2 P C
drag=a+bα
+cα2+dα3
F r2 P C
lift:Cdrag=a+b
α+cα2+dα3
F r2 P
(a) 2.08E–01 8.30E–02 1.85E+00
(b) 2.36E–02 2.31E–03 2.69E–01
(c) – 2.45E–04 −2.89E–03
Magpie
(d) –
582.4 0.96 <0.001
–
44.0 0.78 <0.001
−3.78E–04
249.3 0.97 <0.001
(a) 2.11E–01 1.10E–01 1.40E+00
(b) 5.26E–02 2.94E–03 2.50E–01
(c) 2.73E–04 4.05E–04 −1.40E–03
Jackdaw
(d) 3.51E–05
63.1 0.92 <0.001
–
26.9 0.75 <0.001
−2.18E–04
31.0 0.84 <0.001
Notes.
Clift, lift coefficient;Cdrag, drag coefficient.
Lees
e
t
al.
(2016),
P
eerJ
,
DOI
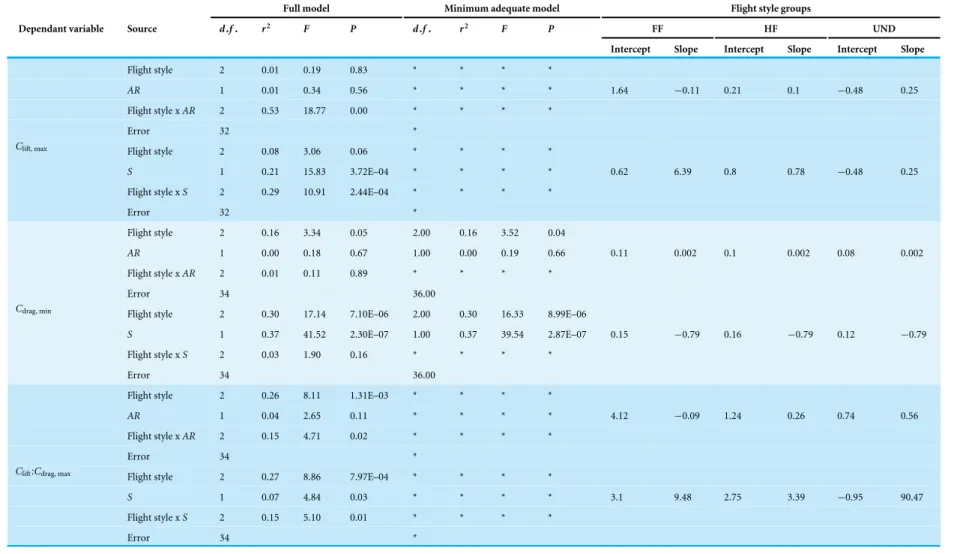
Table 5 Summary of the ANCOVA analysis for the aerodynamic properties of static wings with morphological measures.
Full model Minimum adequate model Flight style groups
Dependant variable Source d.f. r2 F P d.f. r2 F P FF HF UND
Intercept Slope Intercept Slope Intercept Slope
Flight style 2 0.01 0.19 0.83 * * * *
AR 1 0.01 0.34 0.56 * * * * 1.64 −0.11 0.21 0.1 −0.48 0.25
Flight style xAR 2 0.53 18.77 0.00 * * * *
Error 32 *
Flight style 2 0.08 3.06 0.06 * * * *
S 1 0.21 15.83 3.72E–04 * * * * 0.62 6.39 0.8 0.78 −0.48 0.25 Flight style xS 2 0.29 10.91 2.44E–04 * * * *
Clift, max
Error 32 *
Flight style 2 0.16 3.34 0.05 2.00 0.16 3.52 0.04
AR 1 0.00 0.18 0.67 1.00 0.00 0.19 0.66 0.11 0.002 0.1 0.002 0.08 0.002 Flight style xAR 2 0.01 0.11 0.89 * * * *
Error 34 36.00
Flight style 2 0.30 17.14 7.10E–06 2.00 0.30 16.33 8.99E–06
S 1 0.37 41.52 2.30E–07 1.00 0.37 39.54 2.87E–07 0.15 −0.79 0.16 −0.79 0.12 −0.79
Flight style xS 2 0.03 1.90 0.16 * * * *
Cdrag, min
Error 34 36.00
Flight style 2 0.26 8.11 1.31E–03 * * * *
AR 1 0.04 2.65 0.11 * * * * 4.12 −0.09 1.24 0.26 0.74 0.56
Flight style xAR 2 0.15 4.71 0.02 * * * *
Error 34 *
Flight style 2 0.27 8.86 7.97E–04 * * * *
S 1 0.07 4.84 0.03 * * * * 3.1 9.48 2.75 3.39 −0.95 90.47 Flight style xS 2 0.15 5.10 0.01 * * * *
Clift:Cdrag, max
Error 34 *
Notes.
AR, aspect ratio;S, wing area (m2);Clift, max, lift coefficient at the angle of attack resulting in the maximum lift coefficient;Cdrag, min, drag coefficient at the angle of attack resulting in the minimum drag coefficient;Clift:Cdrag, max,Clift:Cdragat the angle of attack resulting in the maximumClift:Cdrag.
Lees
e
t
al.
(2016),
P
eerJ
,
DOI
10.7717/peerj.2495
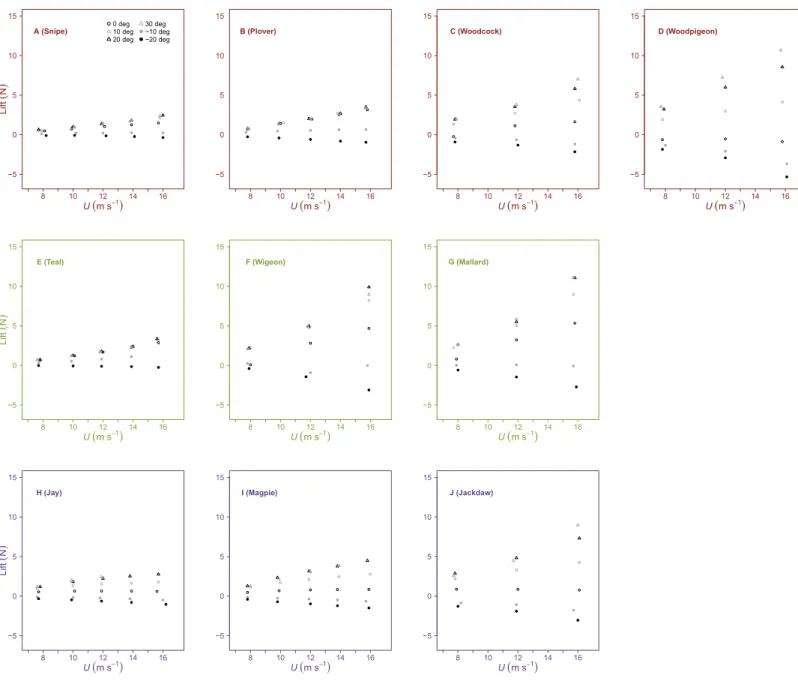
Figure 1 Variation in lift with airspeed and wing angle of attack.Lift (N) was linearly related to airspeed (U, m s−1), increasing at positive angles of attack (α,◦) and decreasing at negative
α. The incremental change in Lift withUwas significantly different between species at similar values ofα. Peak lift did not always correspond to the maximumα. Rows contain individuals from species of differing flight style; forward and bounding flap-ping flight (row 1), high frequency flapflap-ping flight (row 2) and undulating flight (row 3). Data points represent values from individual trials. Colours represent the three distinct flight styles as defined inViscor & Fuster (1987); forward and bounding flapping flight (red), high frequency flapping flight (green) and undulating flight (purple).
style groups, which were similar. Similarly, the intercept value was lower for UF species compared to those of HF or FF birds.
The incremental change in peak Clift:Cdrag with Qwas different between flight style
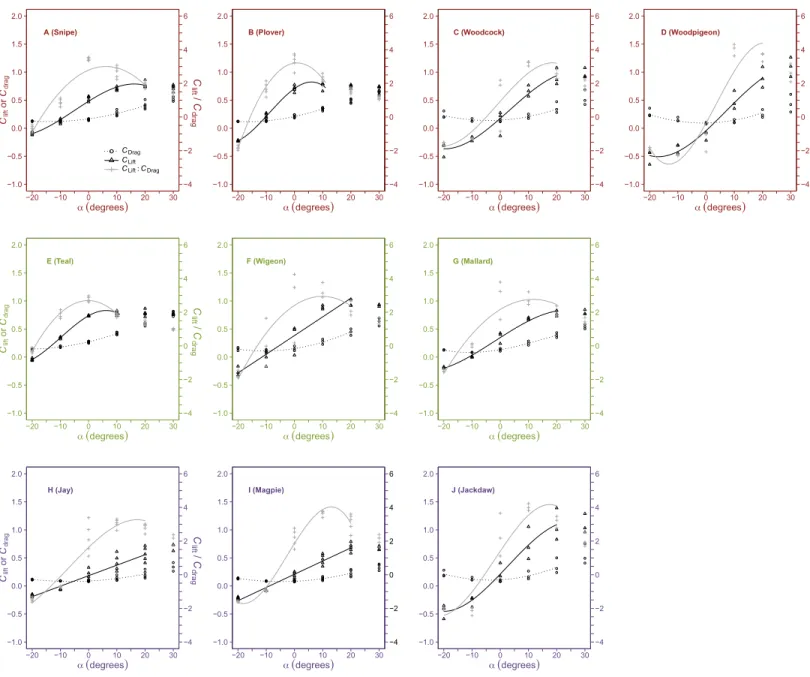
Figure 2 Variation in dimensionless aerodynamic parameters with wing angle of attack.The relationships between the lift coefficient (Clift, open triangles, solid black lines), drag coefficient (Cdrag, open circles, dotted lines) andClift:Cdrag(crosses, grey lines) and angle of attack (α,◦) varied be-tween species but were most commonly described by either second or third order polynomials. MaximumCliftcommonly occurred at high, positive αbut was not different between flight style groups; forward and bounding flapping flyers (row 1), high frequency flapping flyers (row 2) and un-dulating flyers (row 3). MinimumCdragoccurred at intermediateα(0◦) and was lower in undulating flyers. The optimalαforClift:Cdragvaried be-tween species and maximalClift:Cdragvalues were significantly lower in the high frequency flapping flyers (anseriformes) compared to other flight style groups. Data points represent values from individual trials. Differences between groups were determined from the ANOVA. Colours represent the three distinct flight styles as defined inViscor & Fuster (1987); forward and bounding flapping flight (red), high frequency flapping flight (green) and undulating flight (purple).
Figure 4 Variation in drag with airspeed and wing angle of attack.Drag (N) increased linearly with airspeed (U, m s−1) at all angles of attack (α, ◦). The incremental change in drag withUwas higher at larger values of
αand significantly different between species at similar values ofα. Rows contain individuals from species of differing flight style as defined inViscor & Fuster (1987); forward and bounding flapping flight (row 1, red out-line), high frequency flapping flight (row 2, green outline) and undulating flight (row 3, purple outline).
There was an effect of species uponClift:Cdrag, max(F9,30=4.34,p<0.01), which was
highest in the woodpigeon (4±0.2) and Jackdaw (4±0.12). These values were significantly
different from the lowest values ofClift:Cdrag, maxseen in the teal (2.76±0.07) and the
mallard (2.86±0.67).Clift:Cdrag, max(Table 1) was also influenced by flight style (F2,37=5.6,
p<0.01). Apost hoctest showed HF birds to have significantly lower maximum values of
Clift:Cdrag, max(2.92±0.18) than FF (3.47±0.1) and UF (3.5±0.12) birds, which were similar.
DISCUSSION
Here we present the first statistically validated quantitative assessment of the aerodynamic properties of static wings from birds that differ in their flight styles The findings suggest that the differences in morphology associated with differing flight styles manifest only in
differences in drag and not lift performance asCdrag, minbut notClift, maxdiffered between
flight style groups. Differences between flight style groups in the incremental responses of aerodynamic parameters to morphological measures, however, indicate that general wing-morphological measures based upon planform cannot alone predict the gliding performance of avian wings as fixed lifting surfaces.
The lift values recorded were realistic relative to theMbof the species from which the
wings were taken. Mean lift values at the optimal angle of attack (with respect to lift) were
sufficient to support the body weight of the birds (Fig. 5). In order to facilitate statistical
comparison of the different species based upon the influence of wing morphology alone, it
was necessary to remove the confounding effects of the bird’s body and rectrices . (Maybury
& Rayner, 2001). In reality, however, lift values of the whole bird would be even higher,
taking into account the extra component of lift generated by these features. The three species in which mean lift values fell below those required to support body weight over much of the airspeed range are the members of the Anatidae (teal duck, wigeon duck and
mallard), which is unsurprising given the highQcharacteristic of species with high-speed
wings such as ducks. The duck wings have relatively lowSand rely on high frequency high
speed flapping flight at highU (Savile, 1957). Teal, wigeon and mallard ducks fly at speeds
of around 19.7, 20.6 and 18.5 m/s (Alerstam et al., 2007), explaining why lift values only
exceeded body weight at the highest airspeeds tested.
Clift values were similar to those reported previously for both static wings (Nachtigall
& Kempf, 1971;Reddig, 1978;Withers, 1981) and for birds flying in a wind tunnel (Parrott,
1970;Pennycuick, 1968).Withers (1981)obtained a maximalClift value of 0.9 at anα of
15◦
in dried woodcock wings and overall had a maximumCliftrange of 0.8–1.15. Similarly
our meanClift was 0.97 at theα corresponding toClift, maxof 30◦ in the woodcock and
values across the 10 species ranged from 0.69 to 1.1. These are within the expected range for
similarly cambered rigid wings such as the Eppler 387 at similarRe(∼70×103) (Spedding
et al., 2008). Unlike these rigid wings however, the lift:drag polars of the bird wings here
did not show any abrupt step changes. This may, in part, be the result of the flexibility of the feathers which delay the onset of flow separation by reducing the angle of attack
asRe increases. Feather roughness also reduces flow separation, further improving the
performance of the wing (Bokhorst et al., 2015).
In classical aerodynamics, the Clift is nearly constant with airspeed, so that the lift
increases quadratically with airspeed. Here it increases curvi-linearly with airspeed (Fig.
2). This is likely to result from the flexibility of bird wings, which results in a unique wing
conformation for any given value ofα andU. Although for statistical comparisons, it
was necessary to compare wings at their optimalα with respect toClift, when evaluating
Figure 5 Mean lift in comparison to body weight.Mean values of lift (N,±maximum and minimum values) at the angle of attack corresponding to the maximum mean lift value (at airspeeds between 8 and 16 m s−1) were of sufficient magnitude to support body weight (N, indicated by the dashed line) across all flight style groups; Forward and bounding flapping flyers (FF, red open circles,N=4), high frequency flapping flyers (HF, green open triangles,N=3) and undulating flyers (UF, purple crosses,N=3). In HF species, however, body support could was only achieved at the highest airspeeds. Body weights were esti-mates fromDunning (1993).
visualised as a two-dimensional nonlinear curve fit (Fig. 6) of the form:
Clift=Clift0+Clift1U+Clift2α+Clift3αU+Clift4α2+Clift5α3
CDrag=CDrag0+CDrag1U+CDrag2α+CDrag3αU+CDrag4α2+CDrag5α3.
Despite a variety of flight styles,Clift, maxdid not differ between flight style groups. This
is in agreement with previous findings for static wings (Withers, 1981) and also with studies
of rotating wings, in whichCliftis more representative of that of a continuous downstroke
(Dial, Heers & Tobalske, 2012;Usherwood & Ellington, 2002). Wing shape evolution is
driven by a combination of aerodynamic and ecological selection pressures, modified by the constraints of phylogeny. Flapping flight involves complex conformational changes in the wing, in which pitch and span are continuously varying and the wing tip travels faster than the root. The different kinematic and aerodynamic demands of flapping and gliding mean that wings cannot be optimised for both. Wings may therefore be ‘tuned’ towards optimal performance in one flight style or the other. For example, the tuning of wing morphology to flapping as opposed to gliding has been demonstrated in swifts which show
higher span efficiency but higher total drag during flapping (Henningsson, Hedenström
Figure 6 Example of a non-linear curve fit of the lift coefficient,Cliftwith airspeed and angle of attack.
As a result of the changing conformation of the wings at any combination of angle of attack (α,◦) and air-speed (U, m s−1), lift and drag properties (such asC
lift) of avian wings may be best visualised using a two-dimensional nonlinear curve (here shown for the jackdaw).
& Bomphrey, 2014). Here, the similarities in lift performance of morphologically diverse
static wings, suggest that specialisations to different flapping flight styles result primarily in difference in drag when wings are in a gliding position. Additionally, the observed
Clift, maxvalues may be tightly constrained within the range observed, at the expense of drag
for any given wing shape.Withers (1981)proposed a correlation between the lift and drag
performance of bird wings, in which low profile drag coefficients (Cdrag, pro) were associated
with low maximumCliftbut highClift:Cdrag. The lack of any significant differences inClift, max
between flight style groups here suggest that any differences inClift:Cdrag result primarily
from differences inCdragand are not strongly influenced by such a trade-off.
Cdrag values were similar to those previously measured for static avian wings with the
exception of the low values reported for swifts (Apus apus (Linnaeus, 1758)) (∼0.03)
(Withers, 1981). These birds might be expected to have lower values than the species tested
here as a result of their exceptional gliding capabilities. Drag data for free-flying birds
or those in a wind tunnel are biased towards soaring or gliding species (Henningsson &
Hedenström, 2011;Parrott, 1970;Raspet, 1960;Tucker, 1987). As with other static wing
data,Cdragis lower in these species than in our wings, but their upper values fall within
ourCdragenvelope. For example, ourCdrag, minvalues ranged from 0.8 to 0.14 which is at
the upper end of the values for the swift and vulture (Henningsson & Hedenström, 2011;
Parrott, 1970). Pigeons flying at 10 m s−1, however have estimatedC
drag values of around
for species tested here (Pennycuick, 1968). Although drying and mounting wings separate from the birds’ bodies is likely to elevate their drag characteristics to some extent, the
similarities between both ourClift andCdragvalues and those of free-flying birds indicate
that this effect is minimal during gliding flight. One marked difference, however, between our wings and those of free-flying birds is the constant wingspan throughout the range of flight speeds. With the apparent exception of the black vulture, free flying birds actively reduce their wingspan, area and therefore aspect ratio with increasing airspeeds, reducing
profile drag and maintaining a moderateClift(Henningsson & Hedenström, 2011;Parrott,
1970;Pennycuick, 1968).
Unlike Clift, max,Cdrag, min differed between the different flight style groups and was
significantly lower in the undulating flyers. Undulating flight, common to corvid species involves periods of flapping flight in order to gain height, separated by bouts of gliding
flight. AsCliftappears unaffected by wing shape in gliding, it seems that selection has driven
aerodynamic adaptations towards reducing drag in species that rely on phases of gliding
flight. In the corvids, lowCdrag, minvalues, in addition toCdragvalues atαcorresponding to
the maximumClift:Cdragmay, in part be explained by the slotting of their wing tips. Slotting
is associated with primary feathers that are separated both horizontally and vertically in
flight, spreading vorticity and reducing induced drag (Tucker, 1993). Pertinently, the
separation of feathers characteristic of wing slotting was observed in the wind tunnel in UF species but not in HF or FF species. Although the minimum and maximum values of aerodynamic parameters were chosen as reference points for the purposes of statistical
comparison, some of the species tested will fly at combinations ofαandUwhich result in
values of lift and drag outside of these values. It is possible that observed values ofClift, max,
Cdrag, minandClift:Cdrag, maxare not adaptive but, instead, simply the secondary result of morphological adaptations to more dynamic, non-cruising flight.
The ratio of lift to drag is indicative of the overall glide performance of an aerofoil in terms of the ‘shallowness’ of the glide angle that a bird is able to utilize. Conventional
aerofoils may haveClift:Cdrag, maxvalues of 200 or more at highRe (Shyy et al., 1999). At
lowerRe values similar to those used here, Clift:Cdrag, maxof between 10 and 12.6 have
been reported for birds trained to fly in wind tunnels (Henningsson & Hedenström, 2011).
TheseClift:Cdragratios were, however, obtained primarily for specialist gliding and soaring
species (Harris hawk,Parabuteo unicinctus(Temminck, 1824), laggar falcon,Falco jugger
(Gray, 1834) and swift) and are not directly comparable to the present data as they include the lift and drag influences of the body, rectrices and the smooth fairing of the wings to the body. However, more comparable testing on static wings from similarly specialised
species still reveal equally high maximumClift:Cdragratios (∼17), validating the static wing
methodology (Withers, 1981). Non gliding-specialist birds similar to those tested here,
however, have more conservative values ofClift:Cdrag, (3.8–6) (Withers, 1981). Such low
Clift:Cdrag may be more broadly representative of avian wings, particularly when tested in
isolation from the body.
Given that the lift to drag ratio is fundamental to the gliding performance of the wing,
the differences inClift:Cdrag, max between flight style groups are intuitive. For example,
the lowerClift:Cdrag, maxof HF compared to UF species is expected and likely results from
selection for shallow glide angles between bouts of flapping. Such features are not required by HF species, whose pointed wings are suited to fast flapping frequencies and high-speed performance during migration. The reasons underlying the differences between HF and FF species are less clear. Planform measures such as aspect ratio and span are similar
between the groups tested, as areClift, maxandCdrag, min. The observed differences in glide
performance may therefore result from more complex morphological measures such as
wing profile and camber along the wing. These measures will differ in response toU and
α as a result of wing twisting. Interspecific differences in these responses may contribute
to the differingClift:Cdrag,profiles seen between FF and HF species.
Withers (1981)found correlations betweenARandCdrag,CliftandClift:Cdrag, but did not
take flight style groups into account. The relationships found here between aerodynamic and morphological properties are complex and different between the flight style groups.
Clift, maxincreased withARin UF and HF species as expected. The reason for the decrease inClift, maxwithARin FF species is unclear, but may result from morphological parameters not measured here and which are therefore not controlled for in our statistical tests. For
example,Withers (1981)found the magnitude of camber and the position of maximum
thickness to be strongly correlated withClift, max. It is possible that camber was lower in
the highARFF birds relative to that of the other flight style groups at the sameAR. In
reality, however, camber is very difficult to measure for inclusion as a controlled variable as it differs along the wing from root to tip and is modified (as mentioned previously)
by a combination of airspeed andα. This issue could be resolved using photogrammetric
techniques during wind tunnel testing. Another likely confounding factor is the difference
inSat any givenAR.ARincreased withSin the UF species but decreased in the other flight
style groups (Table 1). The result of this relationship betweenARandSis thatClift, max
increases very rapidly withSin UF species compared to the other groups.Cdrag, minwas
unaffected byARsuggesting a minimal role of induced drag in determining overall drag
at low angles of attack and correspondingly ofClift. The lowerCdrag, minfor UF compared
to other flight style groups at a givenARis therefore unrelated toARand likely results
from other morphological parameters such as camber and nose radius, with an additional
effect of the slotted wing tips (Withers, 1981). Given that lifting of the primary feather
tips is required for the slotted wing to fully function and feather deformation will have a strong influence on camber, feather morphological and structural parameters such as rachis stiffness may also influence differences in the drag performance observed between
different flight style groups. Overall,Clift:Cdrag, maxchanged withARin a similar pattern to
that ofClift, max, indicating that FF species do not benefit from increased glide performance
as theirARincreases. In contrast, UF species benefit from a relatively large increase in glide
performance with increasingAR. Together these data suggest that adaptations towards
flapping flight in FF birds negate the increases inClift(and thereforeClift:Cdrag) performance
that are expected to result from increasedAR.
to free-flying birds, it was assumed that these effects were consistent across the wings tested. Although in reality this is very difficult to establish, it seems unlikely that the drag effects of the exposed proximal surface differ between species or flight style groups. Furthermore, these effects are likely to be small in comparison to the more significant effects of wing
morphology that are of interest here. For example, the lowCdragvalues of the corvids are
unlikely to have occurred as a result of lower drag at the proximal surface compared to other birds. Changes in span-wise flow resulting from slotted tips in these species may have influenced the measured aerodynamic parameters but such changes do not invalidate our methodology as they may be representative of the case for birds in the wild.
It was recently suggested that wing morphology is only weakly correlated with flight
style categories and is, instead primarily phylogenetically determined (Wang & Clarke,
2015). In this study, we aimed to quantify the effects of wing shape associated with different
flight style groups upon the passive aerodynamic properties of the wing. Although it seems likely that the observed aerodynamic differences represent relevant functional differences between flight style groups, in reality it is often difficult to untangle the relative effects of phylogeny and ecology. In addition, although it is appealing to infer that any differences between flight style groups are adaptive, there remains the possibility that the passive aerodynamic properties of the wings within different flight style groups are not wholly adaptive or relevant to the flight performance of the birds but are merely the product of shared evolutionary history within the groups or the product of alternative selection pressures upon wing shape. However, it seems unlikely that the observed morphological variation in avian wing shape is linked solely to phylogenetic inertia. Closely related species with different ecologies show differences in wing shape that are adaptive and clearly linked
to flight style (Drovetski, 1996). Indeed, even within species basic wing morphological
measures, as well as feather mechanical properties (De la Hera et al., 2010) are plastic and
allow acclimation to differing aerodynamic requirements (Vanhooydonck et al., 2009).
Here, there are clear morphological differences between flight style groups. Within these groups, birds are both closely related (with the exception of the woodpigeon in the FF group) and share common ecologies, and the data indicate that the morphologies associated with different flight styles are linked to differences in aerodynamic performance. The full adaptive nature of these aerodynamic performance differences, however, remains to be determined.
ACKNOWLEDGEMENTS
We are grateful to Edouard Verstraelen, Abdul Razak Norizham and Thomas Andrianne at the University of Liège for their help with the wind tunnel experiments and Mathieu Torfs for his help in machining parts. We would also like to thank Michael Habib, Colin Palmer and an anonymous reviewer for their helpful comments on an earlier version of this manuscript.
ADDITIONAL INFORMATION AND DECLARATIONS
Funding
The study was funded by a grant from the Leverhulme Trust (RPG-2012-759) to R.N. The funders had no role in study design, data collection and analysis, decision to publish, or preparation of the manuscript.
Grant Disclosures
The following grant information was disclosed by the authors: The Leverhulme Trust: RPG-2012-759.
Competing Interests
The authors declare there are no competing interests.
Author Contributions
• John J. Lees conceived and designed the experiments, performed the experiments,
analyzed the data, wrote the paper, prepared figures and/or tables, reviewed drafts of the paper.
• Grigorios Dimitriadis contributed reagents/materials/analysis tools, wrote the paper,
reviewed drafts of the paper.
• Robert L. Nudds conceived and designed the experiments, wrote the paper, reviewed
drafts of the paper.
Data Availability
The following information was supplied regarding data availability:
The raw data has been supplied asData S1.
Supplemental Information
Supplemental information for this article can be found online athttp://dx.doi.org/10.7717/
peerj.2495#supplemental-information.
REFERENCES
Alerstam T, Rosén M, Bäckman J, Ericson P, Hellgren O. 2007.Flight speeds among
bird species: allometric and phylogenetic effects.PLoS Biology5:1656–1662
DOI 10.1371/journal.pbio.0050197.
Álvarez JC, Meseguer J, Meseguer E, Pérez A. 2001.On the role of the alula in the steady
flight of birds.Ardeola48:161–173.
Bahlman JW, Swartz SM, Breuer KS. 2014.How wing kinematics affect power
require-ments and aerodynamic force production in a robotic bat wing.Bioinspiration &
Biomimetics9:Article 025008DOI 10.1088/1748-3182/9/2/025008.
Bokhorst EV, Kat R, Elsinga GE, Lentink D. 2015.Feather roughness reduces flow
sepapration during low Reynolds number glides of swifts.Journal of Experimental
Carruthers AC, Walker SM, Thomas ALR, Taylor GK. 2010.Aerodynamics of aerofoil
sections measured on a free-flying bird.Proceedings of the Institution of Mechanical
Engineers Part G-Journal of Aerospace Engineering 224:855–864
DOI 10.1243/09544100JAERO737.
De la Hera I, Hedenstrom A, Perez-Tris J, Telleria JL. 2010.Variation in the mechanical
properties of flight feathers of the blackcapSylvia atricapillain relation to migration.
Journal of Avian Biology41:342–347 DOI 10.1111/j.1600-048X.2009.04835.x.
Dial TR, Heers AM, Tobalske BW. 2012.Ontogeny of aerodynamics in mallards:
comparative performance and developmental implications.Journal of Experimental
Biology215:3693–3702DOI 10.1242/jeb.062018.
Drovetski SV. 1996.Influence of the trailing-edge notch on flight performance of
galliforms.Auk113:802–810DOI 10.2307/4088858.
Dunning JB. 1993.CRC handbook of avian body masses. Boca Raton: CRC Press.
Henningsson P, Hedenström A. 2011.Aerodynamics of gliding flight in common swifts.
The Journal of Experimental Biology 214:382–393DOI 10.1242/jeb.050609.
Henningsson P, Hedenström A, Bomphrey R. 2014.Efficiency of lift production in
flapping and gliding flight of swifts.PLoS ONE9:e90170
DOI 10.1371/journal.pone.0090170.
Kruyt JW, Quicazan-Rubio EM, Van Heijst GF, Altshuler DL, Lentink D. 2014. Hummingbird wing efficacy depends on aspect ratio and compares with
he-licopter rotors.Journal of The Royal Society Interface11:Article 20140585
DOI 10.1098/Rsif.2014.0585.
Lockwood R, Swaddle JP, Rayner JMV. 1998.Avian wingtip shape reconsidered: wingtip
shape indices and morphological adaptations to migration.Journal of Avian Biology
29:273–292DOI 10.2307/3677110.
Maybury WJ, Rayner JMV. 2001.The avian tail reduces body parasite drag by controlling
flow separation and vortex shedding.Proceedings of the Royal Society B-Biological
Sciences268:1405–1410DOI 10.1098/rspb.2001.1635.
Nachtigal W. 1979.Der Taubenflügel in Gleitflugstellung: Geometrische Kenngroßen
der Flügelprofile und Luftkrafterzeugung.Journal für Ornithologie120:30–40
DOI 10.1007/BF01647339.
Nachtigall W, Kempf B. 1971.Vergleichende Untersuchungen zur flugbiologischen
Funktion des Daumenfittichs (Alula spuria) bei Vögeln.Zeitschrift Fur Vergleichende
Physiologie71:326–341DOI 10.1007/BF00298144.
Nachtigall W, Wieser J. 1966.Profilmessungen am taubenflugel.Zeitschrift Fur
Vergle-ichende Physiologie52:333–346DOI 10.1007/BF00302288.
Parrott GC. 1970.Aerodynamics of gliding flight of a black vultureCoragyps atratus.
Journal of Experimental Biology53:363–374.
Pennycuick CJ. 1968. A wind-tunnel study of gliding flight in the pigeonColumba livia.
Journal of Experimental Biology49:509–526.
Pennycuick CJ, Heine CE, Kirkpatrick SJ, Fuller MR. 1992.The profile drag of a hawk’s
wing, measured by wake sampling in a wind tunnel.Journal of Experimental Biology
165:1–19DOI 10.1016/0022-0981(92)90286-J.
Raspet A. 1960.biophysics of bird flight.Science132:191–200
DOI 10.1126/science.132.3421.191.
Rayner JMV. 1988. Form and function in avian flight. In: Johnston RF, ed.Current
Ornithology. New York: Plenum Press, 1–66.
Reddig E. 1978.Der Ausdrucksflug der Bekassine (Capella gallinago gallinago).Journal
für Ornithologie119:357–387DOI 10.1007/BF01643130.
Rosen M, Hedenstrom A. 2001.Gliding flight in a jackdaw: a wind tunnel study.Journal
of Experimental Biology204:1153–1166.
Savile D. 1957.Adaptive evolution in the avian wing.Evolution11:212–224
DOI 10.2307/2406051.
Shyy W, Klevebring F, Nilsson M, Sloan J, Carroll B, Fuentes C. 1999.Rigid and flexible
low Reynolds number airfoils.Journal of Aircraft36:523–529 DOI 10.2514/2.2487.
Spedding GR, Hedenstrom AH, Mcarthur J, Rosen M. 2008.The implications of
low-speed fixed-wing aerofoil measurements on the analysis and performance of flapping
bird wings.Journal of Experimental Biology211:215–223DOI 10.1242/jeb.007823.
Tucker VA. 1987.Gliding birds: the effect of variable wing span.Journal of Experimental
Biology133:33–58.
Tucker VA. 1993.Gliding birds—reduction of induced drag by wing tip slots between the
primary feathers.Journal of Experimental Biology180:285–310.
Usherwood J, Ellington C. 2002.The aerodynamics of revolving wings II. Propeller force
coefficients from mayfly to quail.Journal of Experimental Biology205:1565–1576.
Usherwood JR, Hedrick TL, Biewener AA. 2003.The aerodynamics of avian take-off
from direct pressure measurements in Canada geese (Branta canadensis).Journal of
Experimental Biology 206:4051–4056DOI 10.1242/jeb.00624.
Vanhooydonck B, Herrel A, Gabela A, Podos J. 2009.Wing shape variation in the
medium ground finch (Geospiza fortis): an ecomorphological approach.Biological
Journal of the Linnean Society98:129–138 DOI 10.1111/j.1095-8312.2009.01269.x.
Viscor G, Fuster JF. 1987.Relationships between morphological parameters in birds
with different flying habits.Comparative Biochemistry and Physiology A: Molecular
& Integrative Physiology87:231–249DOI 10.1016/0300-9629(87)90118-6.
Wang X, Clarke JA. 2015.The evolution of avian wing shape and previously
unrecog-nized trends in covert feathering.Proceedings of the Royal Society B: Biological Sciences
282:1–9DOI 10.1098/rspb.2015.1935.
Wang X, McGowan AJ, Dyke GJ. 2011.Avian wing proportions and flight styles: first
step towards predicting the flight modes of mesozoic birds.PLoS ONE6:1–8
DOI 10.1371/journal.pone.0028672.
Withers PC. 1981.An aerodynamic analysis of bird wings as fixed aerofoils.Journal of