Intra- and extra-organizational foundations of innovation processes at the information
and communication technology sector under the crisis in Portugal*
Ana Ferreira1# and Ana Lúcia Teixeira1
* Preprint of an article published in [International Journal of Innovation Management, 20, 5,
2016, 1650056_1-1650056_44] [10.1142/S1363919616500560] © [copyright World Scientific
Publishing Company] [http://www.worldscientific.com/doi/10.1142/S1363919616500560]
1
Centro Interdisciplinar de Ciências Sociais CICS.NOVA - Faculdade de Ciências Sociais e
Humanas - Universidade Nova de Lisboa (CICS.NOVA.FCSH/UNL) Avenida de Berna, 26 C,
1069-061, Lisboa, Portugal
#
Corresponding author: Centro Interdisciplinar de Ciências Sociais CICS.NOVA - Faculdade de
Ciências Sociais e Humanas - Universidade Nova de Lisboa (CICS.NOVA.FCSH/UNL) Avenida
de Berna, 26 C, 1069-061, Lisboa, Portugal.
Abstract
This paper characterizes the joint impacts of intra and extra-organizational contexts on
innovation development. Assessing these contexts in 309 firms of the Information and
Communication Technology services sector during the crisis in Portugal, we performed a cluster
analysis and identified two profiles. These were mostly discriminated by financial resources and
clients and not by science and technology activities. Subsequently, these profiles were related to
innovation, top managers’ perceptions and expectations for the future. The data shows that
under favourable contexts innovation increases, the firm is perceived to drive innovation and
confidence in the companies’ future emerges. In more unfavourable scenarios, innovation is
compromised, the environment is perceived to block innovation and confidence is halted.
Establishing companies’ profiles for the first time in Portugal, this paper suggests that intra and
extra-organizational contexts have to be jointly tackled not only to foster present innovation
development but also to promote companies’ future activities.
Keywords
1. Introduction
The beginning of the 21st century witnessed steady increases in innovation activities in
companies operating in Portugal (OECD and Eurostat, 2005). However, between 2010 and 2012
there is an inversion of this trend with innovation activities presenting pronounced decreases
(European Commission, 2014). In fact, 2010 is the year when the sovereign debt crisis bursts in
Europe and 2011, the year of the beginning of the Troika’s intervention in Portugal. This is a
period characterized by a social and economic downturn and a changing political context [1]
(OECD, 2013). If these broad surveys sketch the overall socio-economic scenario and that of
innovation activities, they do not allow us to characterize the firm and/or environmental
underpinnings of these patterns during the crisis.
As expected, most studies addressing the triggers and blockers of innovation focused on
non-crisis periods and revealed that innovation is framed by intra- and extra-organizational
dimensions (reviewed in (Becheikh et al., 2006; Gupta et al., 2007; van der Panne et al., 2003)).
At the intra-organizational level, innovation was shown to be associated with firms’ 1) general
characteristics; structure and past activities (Beneito, 2003; Romijn and Albaladejo, 2002;
Koberg et al., 1996; Papadakis and Bourantas, 1998; Cainelli et al., 2006; Camisón-Zornoza et
al., 2004); 2) management team and procedures (Michie and Sheehan, 2003; Beugelsdijk, 2008;
de Jong and Den Hartog, 2007; Camelo‐Ordaz et al., 2006; Murimbika and Urban, 2014); 3)
functional assets and mobilized strategies (Jensen et al., 2007; Anderson et al., 2014; Jantunen,
2005); and 4) culture (Brattström et al., 2012; Brower et al., 2009; Madrid et al., 2014). At the
extra-organizational context, indicators of firms’ 1) sector of economic activity and related
variables (Beneito, 2003); 2) geographical location (Romijn and Albaladejo, 2002; Sternberg
and Arndt, 2001); 3) suppliers and clients(Freel, 2006; Arranz and Fdez. de Arroyabe, 2008;
Souitaris, 2001); 4) competitors (Nieto and Santamaría, 2007; Souitaris, 2001; Vermeulen et al.,
2007); 5) networking and internationalization strategies (Oliveira and Carvalho, 2010; Salavisa
et al., 2012; de Faria et al., 2010; Fleming et al., 2007; Romijn and Albaladejo, 2002); 6) public
Leydesdorff, 2000); and 7) surrounding culture (Taylor and Wilson, 2012; Efrat, 2014) were
shown to frame the development of innovation activities.
Altogether, these studies suggest the multi-dimensional nature of innovation processes, but,
with relatively few exceptions mobilizing a confined number of variables either before (de Jong
and Vermeulen, 2006; Freel, 2006; Gupta et al., 2007; Camelo‐Ordaz et al., 2006) or at the
crisis onset (Frey et al., 2013; Archibugi et al., 2013), this has not been addressed.
Based on what was previously said, this paper focuses on firms operating in Portugal between
2010 and 2012, i.e. during the crisis. Combining variables of the different layers of the intra-
and extra-organizational dimensions (Input variables, Table 1) firms’ profiles will be
established (Cluster variable, Table 1) and tested for their associations with innovation
progression and outputs (Test Variables 1-4, Table 1). These dimensions and variables will be
evaluated via firms’ top managers, critical innovation actors that stand at the interface of the
internal and external contexts and are ultimately responsible for strategic control and
decision-making (Lazonick, 2006).
Moreover, we will focus on one single sector of economic activity: the ICT services sector. The
reasoning beyond this choice is the following: 1) the wide direct and indirect impacts of ICT
products and services on economic performance and their transversal impact on society; 2) the
fact that these firms present the highest investments on innovation and R&D; the fastest rates of
innovation development; the highest outputs to both internal and external markets and
productivity growth among industries in Portugal and in the European Union (EU); 3) the wide
economic impact of the crisis in ICT services companies operating in Portugal presenting
decreased annual turnovers since 2008, as well as decreased production values, gross value
added, gross operating surplus, assets, liabilities, equity capital and gross investments in
tangible goods since 2010 (INE, 2014); and 4) the strong decrease of innovation activities
presented by the sector (from 89% in 2008-2010 to 79% in 2010-2012)(European Commission,
2014).
Based on the above, this paper presents an alternative approach to the ones previously followed
and Marsili, 2006). These studies, strictly focusing in innovative companies, mostly relied on
the characterization of the rates, sources and nature of innovation activities in firms with
different sizes and sectors of economic activity. In spite of a comparative look into the
differential patterns of innovation behaviour across sectors or firms’ size, these papers were
unable to detail the specificities of the internal and external contexts framing the development of
innovation activities within the same sector, where similar patterns of innovation were
concomitantly shown to be present. Our study will precisely cover this path, aiming to
discriminate the internal and external contexts that elicit or stop innovation development during
the crisis.
2. Perceiving the internal and external impacts on innovation development
In addition to the role of the contexts of innovation to the triggering or blockage of these
processes, firms’ innovative behaviour was also previously related to top managers’ perceptions
of the intra-organizational context (e.g. organizational structure; culture) (Koberg et al., 2003;
Bock et al., 2012), as well as to top managers’ perceptions of the extra-organizational context
(e.g. environmental dynamism; networks) (Koberg et al., 2003; O'Regan and Ghobadian, 2005).
This was attributed to top managers’ critical role in strategic decision-making processes, actions
and eventually firms’ performance (Dean and Sharfman, 1996). Most importantly, these
perceptions are socially constructed (Sutcliffe and Huber, 1998) and have impacts on present
and future strategic decision processes (Chattopadhyay et al., 1999), such as the ones related to
innovation development.
Specifically regarding perceptions of the crisis impacts on innovation, it has been shown that
firms developing innovation activities in Portugal perceive the crisis to have negative impacts
on firms’ activities, with the most dynamic firms (in what relates to economic and innovative
performance) perceiving lower negative impacts [2] (Nunes, 2012). However, the authors did
not address top managers’ perceptions of the impacts of other intra- and extra-organizational
variables on innovation and it remains to be explored whether innovative and non-innovative
unfavourable perceptions of the crisis’ impacts on innovation. As such, this study will also aim
to unravel whether firms with different profiles present different perceptions of the impacts of
specific variables of the intra- and extra-organizational contexts on innovation (e.g. leaderships;
crisis) (Test variables 9-13, Table 1). To the best of our knowledge this has not been previously
addressed.
3. Linking the past, present and future
In addition to innovation’s multiple layers, these contingent change processes are intrinsically
future-oriented, since the outputs of innovation do not pre-exist their development, except as
historically and contextually-framed imagined futures, visions or expectations (Borup et al.,
2006). As the future is unknown (on the one hand, the development of a specific social action
changes conditions for the future, and on the other, the behaviours of other social actors are
beyond ones control (Barbalet, 2009a)), uncertainty is inherent to innovation progression. When
exacerbated, this uncertainty can eventually stop the development of innovation (Barbalet,
2001). If, uncertainty has been previously associated with specific indicators of firms’ internal
and external contexts (Freel, 2005; Galende, 2006; Pandit et al., 2011) it remains to be
addressed whether uncertainty of the companies’ future (Test variable 14; Table 1) relates to
firms’ profiles (Cluster variable; Table 1).
If, as previously said, uncertainty can block innovation progression it can also be outweighed by
the presence of confidence (Barbalet, 2001). Confidence is understood as secure expectations,
i.e. secure judgement on future contingent events, based on past and present experiences and
occurring at the boundaries of consciousness (Barbalet, 2009b). As such, confidence is
self-referential since one accepts the absence of concrete evidence on future outcomes. It is precisely
this acceptance that allows social action to proceed under uncertainty, and eventually allows
social actors to accomplish their desired outcomes (Barbalet, 2009b; Luhmann, 1979; Simmel,
2011).
In Portugal, an indirect evaluation of confidence in firms can be given by the analysis of a
2010 and 2012 (INE, 2014), aggregates firms’ qualitative evaluation of 1) their activities; 2)
demands in the preceding trimester; and 3) expected demands for the following trimester.
However, there is currently no direct characterization of the intra- and extra-organizational roots
(revealed in firms’ profiles: Cluster variable; Table 1) of confidence in the companies’ future
(Test variable 15; Table 1). As such, this paper evaluates whether both uncertainty and
confidence in the companies’ future are framed by firms’ profiles.
This paper is structured as follows: the next section delineates the aims and hypotheses of this
study. The methods and results are subsequently presented and these are followed by a summary
and discussion of the reported data. The paper further outlines the policy implications and
limitations of this; suggests potential directions for future research and finishes with concluding
remarks.
4. Aims and hypotheses
Following a quantitative methodology this paper focuses on ICT services firms to have an
up-to-date thorough characterization of Portuguese organizations articulating the firm level, with
the extra-organizational context. This characterization is currently unavailable. For this purpose
and spanning the different internal and external layers, 1) variables previously associated with
organizational processes (reviewed in (Papadakis et al., 2010)) and innovation development
(reviewed in (Becheikh et al., 2006; Gupta et al., 2007)) (Input variables, Table 1) will be
assessed. 2) These variables - all expressed in the same ordinal scale – will be mobilized to
build ICT services companies’ profiles (Cluster variable, Table 1). 3) These profiles will be
additionally characterized by the firms’ general characteristics and structure (Test variables 1-4;
Table 1). Finally 4) innovation development and outputs (Test variables 5-8, Table 1); 5)
perceived impacts of variables from the intra- and extra-organizational contexts on innovation
development (Test variables 9-13, Table 1); and 6) expectations for the future (Test variables
14-15, Table 1) will be related to firms’ profiles. To the best of our knowledge the associations
future under a crisis context have not been addressed.
Table 1. Variables mobilized in this study.
Input Variables Cluster Variable Test Variables Evol. of financial resources
Evol. of human resources
Evol. of internal bureaucratic structures and procedures
Evol. of discussion of strategic decisions Evol. of management of Human resources
Evol. of knowledge-management(A) Evol. of internal monitoring (B) Evol. of external monitoring (C) Evol. of planning and monitoring of projects
Evol. of R&D
Evol. of creativity stimuli(D) Evol. of employees’ motivation Evol. of employees’ autonomy Evol. of trust in employees Evol. of clients
Evol. of competitors Evol. of networks
Evol. of internationalization (E) Evol. of external bureaucracy (F) Evol. of formal internal and external communication (G)
Evol. of pressure on strategic decisions
Firms’ profiles Test variables on firms’ general characteristics and structure
T1. Size
T2. Date of incorporation
T3. Presence of discussion of strategic decision-making T4. Number of participants in strategic decision-making
Test variables on Innovation T5. Evol. of innovation T6. Finalized innovation activities T7. Patent initiation
T8. Patent finalization
Test variables on Perceptions
T9. Perceptions of the firms’ formal structure impacts on innovation
T10. Perceptions of the firms’ informal structure impacts on innovation
T11. Perceptions of the leaderships impacts on innovation T12. Perceptions of the government legislation and policies impacts on innovation
T13. Perceptions of the socio-economic crisis impacts on innovation
Test variables on Expectations
T14. Evol. of uncertainty in the companies’ future T15. Evol. of confidence in the companies’ future
Note: Evol.: Evolution between 2010 and 2012; (A) Activities that ease and regulate access to knowledge, e.g. identifying and organizing companies’ information and knowledge; supporting the learning of new skills; (B) E.g. monitoring of employees; (C) E.g. monitoring of competitors; financing mechanisms; (D) E.g. brainstorming sessions; team work; rotation of employees between departments; multidisciplinary teams and financial and/or non-financial incentives; (E) Includes exports; internationalization of human resources; having international partnerships, among others; (F) E.g. government regulations; legislation; (G) E.g. newsletters; meetings.
Based on the above, our hypotheses are that:
Hypothesis 1. Firms’ profiles are innovation profiles
Focusing on ICT services firms this paper characterizes the different internal and external layers
of organizational processes (reviewed in (Papadakis et al., 2010)) (Input variables, Table 1) and
establishes composite firms’ profiles based on a broad range of variables. These variables have
been previously associated with innovation progression (reviewed in (Becheikh et al., 2006;
Gupta et al., 2007; van der Panne et al., 2003)). In fact, many studies have shown that
innovation processes are based upon scientific and technological knowledge and are framed by
where innovation is embedded.
The scientific and technological basis of innovation is revealed, for instance, not only by the
numerous studies underlining the relevance of R&D for innovationbut also in the ones
suggesting that mobilizing S&T-based knowledge along with experience-based knowledge
(Jensen et al., 2007) increases innovation performance. Other authors have chosen to focus on
financial resources (Beneito, 2003; Canepa and Stoneman, 2007) or human resources (i.e.
qualifications, experience and skills (Romijn and Albaladejo, 2002)) and found that these
resources are positively associated innovation outputs. Others, revealed that R&D and
innovation are favoured by the mobilization of strategies targeting employees training,
motivation or autonomy as well as increasing trust in employees (Michie and Sheehan, 2003;
Brattström et al., 2012; Brower et al., 2009; Madrid et al., 2014; Beugelsdijk, 2008)). Studies
have also shown that companies with planning, monitoring and communication strategies also
have more positive innovation outputs (Huergo, 2006; Ebadi and Utterback, 1984). Finally, the
data on centralization of procedures and flexibility reveals two opposite patterns: whereas older
firms benefit from increasing levels of flexibility and decentralization of procedures, younger
firms benefit from decreasing levels of flexibility and centralization. This seems to be the case
since innovation in favoured in young firms that reduce uncertainty and focus their efforts on
the limited resources they have (Koberg et al., 1996; Walsh and Dewar, 1987).
Regarding the extra-organizational underpinning s of innovation, it was shown that participation
in networks and the establishment of international partnerships and access to foreign markets
were associated with successful innovation development (Oliveira and Carvalho, 2010; Salavisa
et al., 2012; de Faria et al., 2010; Romijn and Albaladejo, 2002). Finally, while competitors
seem to negatively impact on innovation performance, clients present positive impacts (Nieto
and Santamaría, 2007; Souitaris, 2001). Altogether this data points to the multi-dimensionality
of innovation processes, a characteristic that has only been seldom addressed. One of these
studies shows that innovation investments at the beginning of the crisis in Europe (2008) were
dependent on firms’ economic performance; human resources; investments on R&D; and access
simultaneously dependent on companies’ size and exports in 2010 (Frey et al., 2013).
Mobilizing a different approach to the ones just reported, and focusing on a sample of ICT
services’ firms (both innovative and non-innovative) we will establish ICT services firms’
profiles based on a wide range of variables. This strategy has not been previously mobilized.
Since our firms’ profiles will be established with variables that in addition to their relevance for
organizational processes in general, are specifically critical for innovation development, it is our
expectation that firms’ profiles are also innovation profiles. That is to say that the development
of innovation activities and innovation outputs (Test variables 5-9; Table 1) are associated with
firms’ profiles. Additionally, this has not been previously addressed under the Portuguese
social-economic crisis context.
Additionally,
Hypothesis 2.1. Top managers’ perceptions of the intra-organizational impacts on innovation
are not independent of firms’ profiles.
Hypothesis 2.2. Top managers’ perceptions of the extra-organizational impacts on innovation
are not independent of firms’ profiles.
Specifically focusing at the intra-organizational impacts on innovation, studies have shown that
innovation is associated with firms’ formal structure, firms’ informal structure (in which firms’
organizational culture, understood as the pattern of values, beliefs, expectations and practices
shared by organizational members, has a central role) as well as with leaderships (Teece, 1996;
Tellis et al., 2009; Papadakis and Bourantas, 1998; de Jong and Den Hartog, 2007; Denti and
Hemlin, 2012). On the extra-organizational dimension specific policies and legislations (e.g.
establishing intellectual property rights; promoting collaborations with the academia) (Webster
and Packer, 1996; Etzkowitz and Leydesdorff, 2000) favour innovation development. Also,
innovation was shown to be promoted by firms’ embeddedness in favourable and dynamic
external environments (i.e. in which firms present high profit margins, have low competition
and high customers’ loyalty) (Lumpkin and Dess, 2001; Covin et al., 2000). However, firms
were shown to follow two opposite strategies. While some studies suggest that firms respond
conservatively to environmental changes, decreasing costs, limiting information processing,
increasing centralization and operational efficiencies, others suggest that firms adapt to
changing environments engaging on proactive innovation strategies (Hansen, 2014; Nickell et
al., 2013; Uzkurt et al., 2012). However the impacts of these strategies on firms’ performance
have shown divergent results, with some studies suggesting that increasing innovativeness
through decline is financially beneficial (Nickell et al., 2013) while others not being able to
support these premises (Hansen, 2014). As previously said, the overall innovation frequencies
of the highly innovative ICT services’ sector presented a 10% decrease between 2010 and 2012
(European Commission, 2014). This implies that 1) independently of the overall very high
frequency of innovation activities presented by this sector (79%), more firms decreased, rather
than increased innovation activities in face of the crisis in Portugal; and 2) alternative strategies
to face the external turbulence associated with the socio-economic crisis might be in place.
In what regards top managers perceptions, they were shown to be socially constructed (Sutcliffe
and Huber, 1998). In fact, the authors showed that perceptions (of the firms’ environment) are
more similar among managers of the same firm, less similar among managers of firms of the
same sector of economic activities, and much less similar among managers of firms of different
sectors of economic activities (Sutcliffe and Huber, 1998). If this is the case, then it is relevant
to evaluate whether top managers working at the same sector of economic activities but in firms
presenting clearly different profiles, do have differential perceptions of self (of their company)
and others (of the extra-organizational context). Importantly, in innovative companies, top
managers’ perceptions of the companies’ organizational structure (Koberg et al., 2003); culture
(Bock et al., 2012) and environmental conditions (Koberg et al., 2003; O'Regan and Ghobadian,
2005), including the crisis (Nunes, 2012), were associated with the innovation. However, it
remains unknown how these perceptions in both innovative and non-innovative firms relate to
firms’ profiles built on a broad range of indicators. This paper addresses these issues via an
initial characterization of the impacts of top managers’ perceptions of firms’ formal and
Table 1) on innovation progression, and a subsequent assessment of the relation of these
perceptions with firms’ profiles during the crisis in Portugal.
Finally,
Hypothesis 3.1. Uncertainty in the companies’ future is not independent of firms’ profiles.
Hypothesis 3.2. Confidence in the companies’ future is not independent of firms’ profiles.
It has been previously shown that expectations over future relate to organizational
characteristics such as innovation strategy, management procedures, organizational culture and
commercialization process (Do et al., 2014). Previous studies have also shown that in
companies developing innovation activities, both confidence and uncertainty relate to
intra-organizational variables such as financial resources, human resources and R&D. Additionally, if
uncertainty was associated with extra-organizational indicators such as customers; suppliers and
competitors (Freel, 2005; Galende, 2006; Pandit et al., 2011; Zhou et al., 2005), the framing of
confidence by environmental indicators remains to be evaluated. In short, what these studies
clearly show is the social roots of future’s expectations, and specifically those of uncertainty
and confidence in the companies’ future. If this is the case, then it is to be expected that both
uncertainty and confidence are associated with firms’ profiles. The novelty of our study rests on
1) the mobilization of both innovative and non-innovative firms; 2) the establishment of firms’
profiles with a broad range of intra- and extra-organizational indicators; 3) the evaluation of the
relations between expectations and profiles under the crisis in Portugal.
4. Methods
We carried out an online survey to ICT services sector companies, identified as belonging to
Section J, divisions 61 to 63 of the statistical classification of economic activities in the
European Communities NACE-Rev. 2 (European Commission, 2008). The survey was
answered by ICT services firms’ top managers during 2013. We followed a quota sampling
methodology. The sample encompasses 309 firms from a total of 4310 companies listed by
development of innovation activities at a 95% confidence interval and a 5% maximum error of
estimate (European Commission, 2014). Additionally, the sample’s distribution is proportional
to the universe of ICT services firms operating in Portugal in terms of classes of number of
employees [3] (INE, 2011). More specifically, the sample is mainly composed of micro
companies (86.8%), with small, medium and large companies representing 10.2%; 2.3% and
0.7%, respectively (European Commission, 2003). Regarding the date of incorporation, almost
half of these companies (48.2%) are very recent, being established between 2007 and 2012;
33.9% were established between 2000 and 2006; and 17.9% between 1980 and 1999.
The survey comprised different sets of questions focused on the period between 2010 and 2012
and regarding 1) the evolution of specific variables from the intra- and/or extra-organizational
contexts (Input variables, Table 1); 2) decision-making processes during innovation
development (Test variables 3-4, Table 1); 3) innovation activities and outputs (Test variables
5-8, Table 1); 4) perceptions of the impact of the intra- and extra-organizational contexts on
innovation activities (Test variables 9-13, Table 1) and 5)expectations for the companies’
future [4] (Test variables 14-15, Table 1).
A cluster analysis was performed to identify homogenous groups of companies according to the
evolution of the intra- and extra-organizational contexts. These clusters were then interpreted
according to their profiles relating to the different relevant dimensions using Pearson chi-square
tests to assess the independence between nominal variables and adjusted standardized residuals
to assess associations between categories of nominal variables.
Statistical analysis was performed with IBM SPSS Statistics, version 20, statistical package.
5. Results
5.1. Innovation development at the Portuguese ICT services sector: differentiating between
companies
A hierarchical cluster analysis was conducted to discriminate between groups of companies and
1) and mobilizing the squared Euclidean distance as the measure of similarity between firms.
Several clustering methods were tested and the increase of the agglomeration coefficients
suggested the presence of two clusters. For the same number of clusters a 77% to 100% degree
of convergence between tested clustering methods was found (Between-groups Average
linkage; Single linkage; Complete linkage; Centroid linkage and Median linkage lies between).
The classification of each subject on the clusters was performed with the non-hierarchical
method k-Means (Maroco, 2010). The clusters’ average profiles regarding each dimension are
presented in Figure 1.
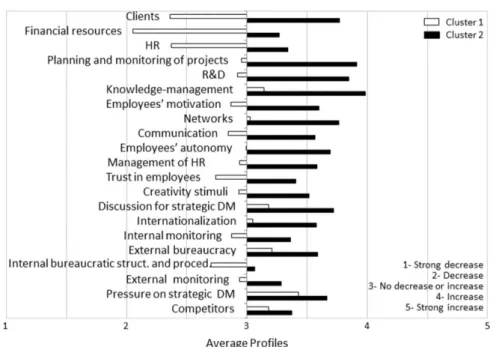
Figure 1. Profiles of ICT services firms.Average profiles of variables in clusters 1 and 2. Each
variable is ranked on a scale of 1 (strong decrease) to 5 (strong increase). Cluster 1 (white bars)
includes 38.5% of ICT firms (n=119) and cluster 2 (black bars) includes 61.5% (n=190). Struct.:
Structures; Proced.: Procedures.
The data depicted in Figure 1 clearly differentiates between clusters 1 and 2 that globally
positive evolution of the studied variables between 2010 and 2012. On the other, companies
belonging to cluster 1, have on average a negative evolution or present no changes in the studied
variables. These patterns are transversal to the intra- and/or extra-organizational contexts. These
data show that ICT services firms’ profiles are discriminated by the additive impacts of intra-
and extra-organizational contexts and suggest strong connections between the various contexts
impacting on innovation development.
In a sector of economic activities in which innovation is present in more than two thirds of
companies operating in Portugal (European Commission, 2014), it would be expected that
S&T-related activities would have a very relevant differentiating role. Still, ANOVA analysis
indicates that the two clusters are not differentiated in first place by variables directly assessing
S&T-related activities that only emerge on the second layer of variables discriminating between
the clusters (this layer includes the evolution of human resources; of planning and monitoring of
projects; of R&D and of knowledge-management). In fact, the variables “evolution of the
number clients” and “evolution of financial resources” contribute the most to discriminate ICT
services companies. More precisely, while 55.2% of firms in cluster 1 decreased the number of
clients, only 6.9% of firms in cluster 2 present decreases (25.2% decreases in all firms being
analysed). Additionally, while 71.2% of firms in cluster 1 decreased their financial resources
between 2010 and 2012, only 19.5% of firms in cluster 2 present decreases (39.3% decreases in
all firms). One final note to report that among all analysed variables, only the number of
competitors and pressure on strategic decision-making do not allow discriminating between the
clusters presenting similar patterns in both [6].
Once having identified the profiles, we will now evaluate whether these relate to the general
characteristics of the firms, i.e. size and incorporation date, and to the centralization of
procedures (Test variables 1-4, Table 1), hereby evaluated by the presence or absence of
discussion of strategic decision-making processes and well as the number of people specifically
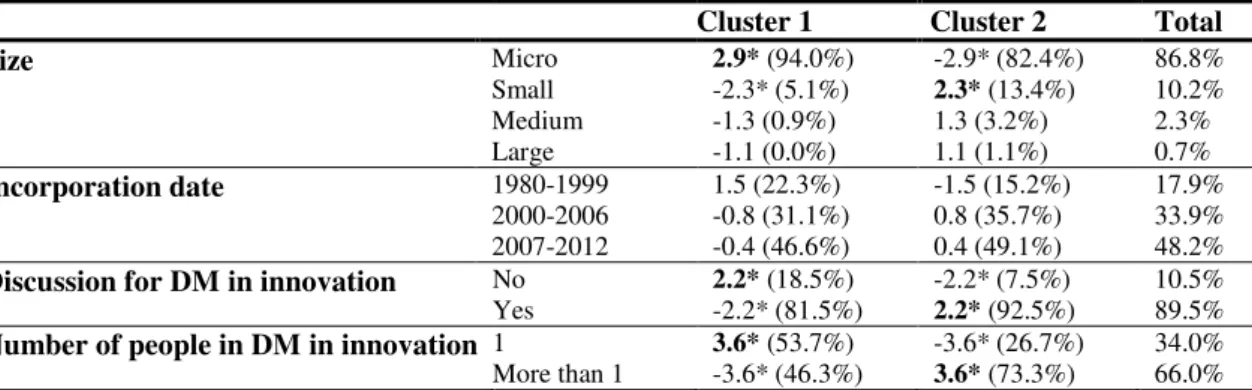
Table 2. Characterizing the ICT services clusters
Note: Values are expressed as adjusted standardized residuals and percentage within specific clusters. * Denotes statistical significance (|Z|>1.96; level of significance of 0.05); bold indicates positive significant probability of association. DM: Decision-making.
Our data show that in spite of the wide prevalence of micro companies founded after 1999, there
is a high probability of companies in cluster 1 being micro companies and of companies in
cluster 2 being small companies. Additionally, if significant differences were found in what
concerns firms’ incorporation date, relevant differences are present when analysing the course
of decision-making per se. Firstly, firms in cluster 2 present a relative high probability of
discussion for strategic decision-making. Subsequently, the process of decision-making during
innovation progression is decentralized in 73.3% of companies. In cluster 1, the frequency of
discussion is lower, and there is a balanced division between a centralized model of
decision-making (present in 53.7% of firms) and a decentralized model (46.3%). These data reflects a
more centralized model of leadership than the one present in cluster 2.
In summary, firms in cluster 1 have a more unfavourable evolution of the intra- and
extra-organizational contexts (Figure 1) than companies in cluster 2 and are mostly differentiated by
financial resources and number of clients. While firms in cluster 1 have a high probability of
being micro companies and presenting a centralized model of leadership (Table 2), companies
in cluster 2 have a high probability of presenting a decentralized model of leadership.
Having established and characterized firms’ profiles we will in the following sections evaluate
their associations with innovation development and outputs (Section 5.2) (test of hypothesis 1);
top managers perceptions (Section 5.3) (test of hypotheses 2.1 and 2.2); and expectations for the Cluster 1 Cluster 2 Total
Size Micro
Small Medium Large
2.9* (94.0%) -2.3* (5.1%) -1.3 (0.9%) -1.1 (0.0%)
-2.9* (82.4%)
2.3* (13.4%) 1.3 (3.2%) 1.1 (1.1%) 86.8% 10.2% 2.3% 0.7%
Incorporation date 1980-1999
2000-2006 2007-2012 1.5 (22.3%) -0.8 (31.1%) -0.4 (46.6%) -1.5 (15.2%) 0.8 (35.7%) 0.4 (49.1%) 17.9% 33.9% 48.2% Discussion for DM in innovation No
Yes
2.2* (18.5%) -2.2* (81.5%)
-2.2* (7.5%)
2.2* (92.5%)
10.5% 89.5% Number of people in DM in innovation 1
More than 1
3.6* (53.7%) -3.6* (46.3%)
-3.6* (26.7%)
3.6* (73.3%)
future (Section 5.4) (test of hypotheses 3.1 and 3.2). Aiming to simplify the analysis without
losing relevant information, the data will be presented on 3-point ordinal scales in which high
increases (or very favourable) and high decreases (or very unfavourable) are grouped with
increases (or favourable) and decreases (or unfavourable), respectively.
5.2. Innovation development at the ICT services sector
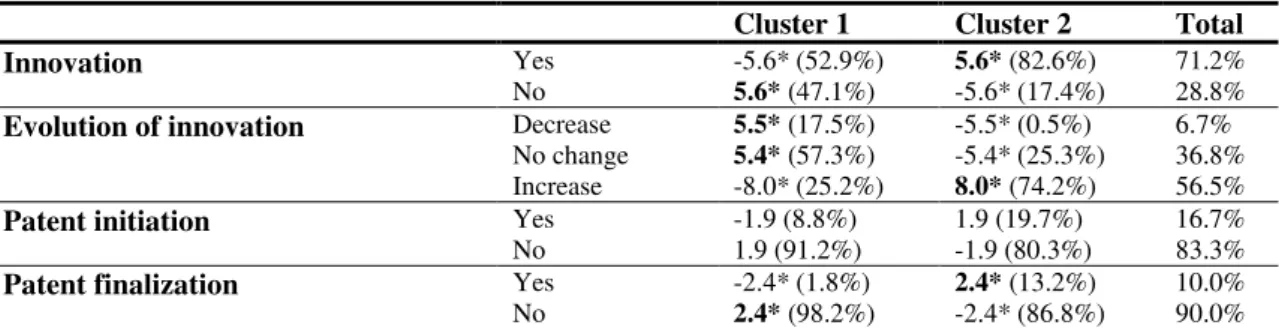
Regarding innovation outputs, between 2010 and 2012 innovation activities were developed by
71.2% of all analysed ICT services companies (Table 3, Total). In spite of these high
frequencies of innovation activities ICT services companies present low frequencies of patents
(16.7% of companies applied for patents and 10.0% finalized this process (Table 3, Total)).
These numbers should reflect 1) the low level of patenting in Portugal as compared to EU
(European Commission, 2013); and 2) that this analysis focuses on ICT services sector and that
patents are not granted for “computer programs as such”, which are (can be) protected by
copyright (European Patent Office, 2013). Secondly, the reported differences between the
application for patents and patents granted might be attributed to 1) the fact that not all
applications for patents are successfully finalized; and 2) the time lag between the two moments
(more than 18 months [7]) in a context of increasing applications (INPI, 2012; INPI, 2013).
Following, the relations between variables characterizing innovation development on ICT
services firms’ profiles were evaluated. Confirming our hypothesis 1, i.e. firms’ profiles are
innovation profiles, Pearson chi-square analysis reveals that the development of innovation
activities (χ2
(1)=31.454; p<0.001); the finalization of patents (χ2(1)=5.965; p=0.015) but not patents’ initiation (χ2
(1)=3.5450; p=0.060, with a p value close to significance); and the evolution of innovation activities (χ2
(2)=74.436; p<0.001) are not independent of ICT services firms profiles.
Additionally, the analysis of the associations between the clusters and the specific variables’
categories reveals that companies in cluster 2 are highly innovative: most companies developed
innovation activities; increased these innovation activities between 2010 and 2012 and
mildly innovative. In this cluster, and in spite of innovation activities being developed in
approximately half of the companies, there is a high probability of companies not presenting
innovation outputs and of having decreased innovation activities during the same period of time.
The data on innovation development fits nicely with the previous characterization of the ICT
services clusters, with the highly innovative companies of cluster 2 presenting increased internal
and external assets and more innovation-prone organizational environments. On the contrary,
mildly innovative companies of cluster 1 present a more negative evolution of both internal and
external assets and an organizational environment that does not favour innovation development.
Table 3. Innovation development in ICT services clusters.
Note: Values are expressed as adjusted standardized residuals and percentage within specific clusters. * Denotes statistical significance (|Z|>1.96; level of significance of 0.05); bold indicates positive significant probability of association.
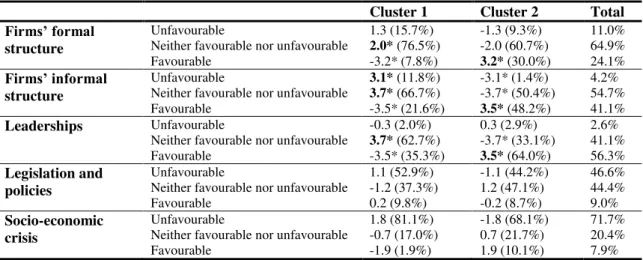
5.3. Contextual impacts on innovation development
Table 4reveals top managers’ perceptions of the (un)favourable impacts of intra- and
extra-organizational variables on innovation development. Globally, cluster 2 companies perceive that
innovation development is favourably driven by all organizational layers under study (i.e.
formal and informal structure; leaderships). In opposition, firms belonging to cluster 1 mostly
perceive that the different organizational layers are either unfavourable or are not favourable or
unfavourable for innovation development. This data indicates that the triggering or stopping of
innovation is perceived mostly as independent of the different organizational layers analysed.
Confirming this data, Pearson chi-square analysis reveals that perceptions of companies’ formal
and informal structures impacts on innovation as well as perceptions of leaderships’ impacts on Cluster 1 Cluster 2 Total
Innovation Yes
No
-5.6* (52.9%)
5.6* (47.1%)
5.6* (82.6%) -5.6* (17.4%)
71.2% 28.8% Evolution of innovation Decrease
No change Increase
5.5* (17.5%)
5.4* (57.3%) -8.0* (25.2%)
-5.5* (0.5%) -5.4* (25.3%)
8.0* (74.2%)
6.7% 36.8% 56.5%
Patent initiation Yes
No -1.9 (8.8%) 1.9 (91.2%) 1.9 (19.7%) -1.9 (80.3%) 16.7% 83.3%
Patent finalization Yes
No
-2.4* (1.8%)
2.4* (98.2%)
2.4* (13.2%) -2.4* (86.8%)
innovation are not independent of firms’ profiles. (χ2(2)=10.442; p=0.005; χ2(2)=17.707; p<0.001 and χ2
(2)=13.580; p<0.001, respectively). This confirms our hypothesis 2.1 (stating that top managers’ perceptions of the intra-organizational impacts on innovation are not independent of
firms’ profiles).
Interestingly, both clusters present similar perceptions of the impacts of the reported
extra-organizational layers (i.e. legislation/policies and crisis). In fact, the aggregated data tells us that
in spite of the previously reported support by the Portuguese government of entrepreneurial and
innovation activities in firms [8], only a very small percentage of top managers perceive current
legislation and policies as favourable for innovation progression (9.8% and 8.7%, respectively).
This scenario worsens when looking at the perceived impacts of the social-economic crisis on
innovation development. In fact, 81.1% and 68.1% of firms in clusters 1 and 2, respectively,
perceive the crisis as unfavourable for innovation development, revealing an overall dominant
negative perception among ICT services firms. This data is consistent with studies reporting
decreased propensity of firms to invest in innovation during the crisis (Archibugi and Filippetti,
2013). Moreover, Pearson chi-square analysis reveals that perceptions of the legislation and
policies impacts on innovation, as well as those of the crisis are globally independent of ICT
services firms’ profiles (χ2(2)=1.474; p=0.479; χ2(2)=4.654; p=0.098, respectively). This data refutes our hypothesis 2.2 (stating top managers’ perceptions of the extra-organizational impacts
Table 4. Perceptions of the intra- and extra-organizational impacts on innovation development
in ICT services clusters.
Note: Values are expressed as adjusted standardized residuals and percentage within specific clusters. * Denotes statistical significance (|Z|>1.96; level of significance of 0.05); bold indicates positive significant probability of association. This data reports only to companies that develop innovation activities (n=220).
In summary, cluster 1 firms, characterized by challenging internal and external scenarios, point
to the environmental context as the main responsible for the unfavourable innovation settings.
Firms in cluster 2, previously characterized by more favourable settings, perceive, similarly to
cluster 1, the unfavourable impacts of the environmental context but point to “themselves”, i.e.
to the different organizational layers, as the relevant drivers of innovation development.
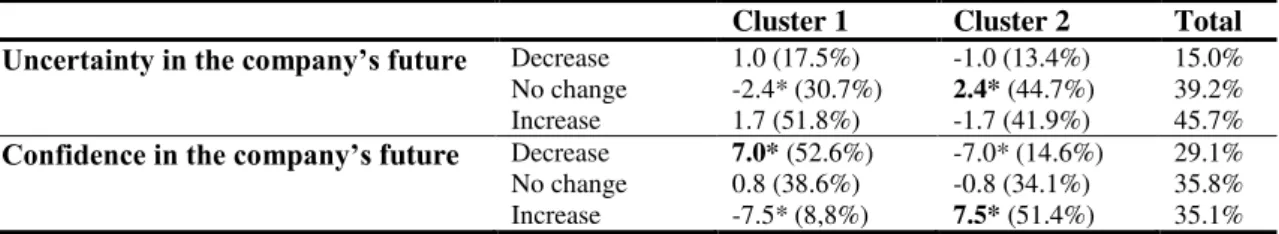
5.4. Expectations for the future: the role of uncertainty and confidence
Finally, in what concerns top managers’ perceptions of companies’ future (Table 5), the two
clusters are very different. Cluster 2 is significantly associated with no changes in uncertainty
and increased confidence in the companies’ future. In opposition, cluster 1 is characterized by a
high probability of decreased levels of confidence in the companies’ future. Additionally,
Pearson chi-square analysis reveals that while uncertainty is independent of firms’ profiles
(χ2(2)=5.746; p=0.057, with a p value close to significance), confidence in the companies’ future is not independent of ICTS firms’ profiles (χ2(2)=71.895; p<0.001). As such our hypotheses 3.1
is refutedwhile hypotheses 3.2 isconfirmed.
Cluster 1 Cluster 2 Total Firms’ formal
structure
Unfavourable
Neither favourable nor unfavourable Favourable
1.3 (15.7%)
2.0* (76.5%) -3.2* (7.8%)
-1.3 (9.3%) -2.0 (60.7%)
3.2* (30.0%)
11.0% 64.9% 24.1% Firms’ informal structure Unfavourable
Neither favourable nor unfavourable Favourable
3.1* (11.8%)
3.7* (66.7%) -3.5* (21.6%)
-3.1* (1.4%) -3.7* (50.4%)
3.5* (48.2%)
4.2% 54.7% 41.1% Leaderships Unfavourable
Neither favourable nor unfavourable Favourable
-0.3 (2.0%)
3.7* (62.7%) -3.5* (35.3%)
0.3 (2.9%) -3.7* (33.1%)
3.5* (64.0%)
2.6% 41.1% 56.3% Legislation and policies Unfavourable
Neither favourable nor unfavourable Favourable 1.1 (52.9%) -1.2 (37.3%) 0.2 (9.8%) -1.1 (44.2%) 1.2 (47.1%) -0.2 (8.7%) 46.6% 44.4% 9.0% Socio-economic crisis Unfavourable
Table 5. Evolution of future-oriented expectationsin ICT services clusters.
Note:Values are expressed as adjusted standardized residuals and percentage within specific clusters. * Denotes statistical significance (|Z|>1.96; level of significance of 0.05); bold indicates positive significant probability of association.
6. Discussion and conclusion
6.1. Innovating under the crisis: summarizing and discussing the data
This study characterizes innovation development and its contexts at ICT services firms in
Portugal between 2010 and 2012, i.e. during the social-economic crisis. For this purpose, we
completed an extensive up-to-date characterization of firms articulating the organizational
context with the wider environmental context. This characterization revealed two innovation
profiles – highly and mildly innovative firms- that are mostly discriminated by financial
resources and number of clients (Figure 1; Table 3). Additionally, these firms are characterized
by significantly different perceptions of the impact of the firms’ organizational layers on
innovation development and similar perceptions of the impacts of the extra-organizational
context. These patterns are additionally revealed in differential historically and
contextually-embedded future-oriented expectations. This is, to our knowledge, the first time that the
characterization of ICT services firms’ profiles was based on such a wide and diverse array of
indicators. This approach allowed for a detailed picture of this sector in Portugal (Figure 2). Cluster 1 Cluster 2 Total Uncertainty in the company’s future Decrease
No change Increase
1.0 (17.5%) -2.4* (30.7%) 1.7 (51.8%)
-1.0 (13.4%)
2.4* (44.7%) -1.7 (41.9%)
15.0% 39.2% 45.7% Confidence in the company’s future Decrease
No change Increase
7.0* (52.6%) 0.8 (38.6%) -7.5* (8,8%)
-7.0* (14.6%) -0.8 (34.1%)
7.5* (51.4%)
Figure 2. Profiles of innovation development at the ICT services sector.
What this study shows is that firms with more favourable conditions, with more decentralized
decision-making processes, and with higher frequencies of innovation outputs, perceive their
organization as the driver of innovation. Also, these are the companies that present relative
increased presence in networks and internationalization patterns (Figure 1). These companies
seem to follow the previously reported proactive innovation model during times of
environmental decline or recession (Hansen, 2014; Srinivasan et al., 2005). Under this scenario,
companies and their actors present confidence in their future.
In the opposite situation, companies with unfavourable conditions and more centralized
decision-making processes are more likely to perceive innovation development as hinging on
factors outside their control and to present lower frequencies of innovation outputs. These firms
seem to engage on the previously reported conservative strategies to overcome the difficulties
associated with periods of crisis (Staw et al., 1981; O'Malley et al., 2011; Hansen, 2014). These
companies present relative decreased presence in networks and internationalization patterns,
which reveals unequal access to and position in information and communication structures.
These companies are characterized by decreased confidence in their future. Such companies are
more easily trapped in a limbo of uncertainty where only short-term decisions are in place and
companies in unfavourable vicious cycles, eventually precluding innovation development.
These companies have decreasing levels of confidence in their future.
6.2. Policy implications
Between 2010 and 2012, under a crisis context that frames a severe downturn in ICT services
firms activities (INE, 2014), 71.2% of ICT services firms still developed innovation activities.
However, when one looks at the variables that mostly contribute to discriminate firms’ profiles,
i.e. financial resources and number of clients, their overall evolution is worrisome. Indeed, only
approximately a fourth of all ICTS firms increased their financial resources and number of
clients. This is expected to impact on companies’ survival and on present and future innovation
development. Additionally, the evolution of these variables is most probably contributing to the
overall negative perceptions of the crisis’ impacts on innovation development. In fact, even with
the Portuguese government endorsing entrepreneurial and innovation activities as the model for
social and economic development (Governo de Portugal, 2011a), there is a strong prevalence of
negative perceptions of legislation and policies among innovation actors. These perceptions
could be pointing to the difficulties that companies face to benefit from governmental programs
and to the inability of the government in addressing persisting structural challenges.
Previous studies have pointed out that Portugal has many structural constraints that need to be
tackled by public policies if innovation is to be promoted. Among these stand the low
educational level of the Portuguese population; the low R&D expenditures; the shortage of
companies in high technology sectors; the lack of risk capital investments and available private
credit as well as the scarce partnerships and networks between institutions of the innovation
system (Salavisa and Vali, 2011; Conceição and Heitor, 2003). As previously shown, this
reasoning remains critical during the crisis context (Filippetti and Archibugi, 2011).
The current governmental strategic program on entrepreneurship and innovation does intend to
address some of these shortcomings by endorsing the development of an entrepreneurial
society; promoting innovation activities in firms; networking mechanisms and the restructuring
strategic programme specifically target “initiatives of excellence” (Governo de Portugal, 2011b),
disregarding the clear heterogeneity of companies operating in Portugal even when one focus in
a very specific and highly innovative sector of economic activities. Knowing that the evolution
of financial resources is one of the variables that mostly contribute to distinguish between firms’
profiles, these measures are expected to have negative impacts on future innovation activities,
which were previously shown to have a significant impact on companies’ survival (Cefis and
Marsili, 2006). Indeed, these measured leave most firms “out of the game” from the very
beginning and, as such, are expected to deepen opportunity inequalities among companies.
Additionally, the program also disregards studies and recommendations suggesting that
innovation policies, particularly in small countries like Portugal, should not be confined to
institutions promoting innovation development (or their linkages with the academia), but should
additionally target institutions that affect the absorption and efficient use of innovation outputs
(Lundvall and Borras, 2006) (recalling that the number of clients is one of the variables that
mostly contribute to establish the reported innovation profiles). This reasoning is particularly
relevant in a context characterized by reduced demand of goods and services and increased
uncertainties in future demands. As such, innovation policies should not only consider the
heterogeneity of companies operating in Portugal but should additionally target both innovation
developers and innovation consumers. The application or not of this kind of policies is expected
to be critical for future innovation development and associated economic effects, an area where
Portugal continues to perform under the EU average [9] (European Commission, 2014a).
6.3. Limitations and opportunities for future research
In this study, we have sketched an over-all picture of ICT services sector in Portugal and
established firms’ innovation profiles. Still, since we have only addressed one sector of
economic activities, the gathered results and conclusions should be carefully taken before their
evaluation in other sectors of economic activities, particularly in those with similar innovation
patterns. Additionally, since we have looked at innovation processes as a “general entity”, this
contexts of radical innovation and on delineating a detailed portrait of innovation trajectories
considering the different overlapping sub-processes of innovation progression (Pavitt, 2006).
Future studies should address these issues via a qualitative approach that deepens our data while
taking into account the results previously presented by other comprehensive studies (Oliveira,
2008; Piteira, 2010). Detailed analysis of the historical and contextual backgrounds of the firms
should also be considered. Finally, in addition to surveys/interviews to top managers, an
approach that also explores the standpoint of firms’ employees should give additional avenues
of analysis. This will allow us to reach firms’ activities from different angles of observation and
thus, to have a more thorough approximation to innovation development. The presented
limitations do not however jeopardize the scientific contributions of this study.
6.4. Concluding remarks
This study suggests that the additive impacts of the intra- and extra-organizational contexts of
innovation progression have to be jointly tackled if interventions are to foster innovation
development. As this study indicates that the presence or absence of confidence in the
companies’ future is strongly associated with companies’ profiles it can be used as an indicator
of firms’ physiognomies. This study further reveals that historically- and
contextually-embedded firms’ activities frame companies’ expectations and subsequently, if these contexts
and activities aren’t shortly tackled, the future of a significant proportion of companies could be
compromised.
Acknowledgments
This work was supported by Fundação para a Ciência e a Tecnologia’s grant
SFRH/BPD/77611/2011 to Ana Ferreira; PEst-OE/SADG/UI4067/2013-2014 to CESNOVA.
The authors thank Manuel Lisboa for critical input into the design and discussion of this
References
Anderson N, Potočnik K and Zhou J. (2014) Innovation and Creativity in Organizations: A
State-of-the-Science Review, Prospective Commentary, and Guiding Framework. Journal of Management 40: 1297-1333.
Archibugi D and Filippetti A. (2013) Innovation and economic crisis: lessons and prospects from the economic downturn: Routledge.
Archibugi D, Filippetti A and Frenz M. (2013) Economic crisis and innovation: Is destruction prevailing over accumulation? Research Policy 42: 303-314.
Arranz N and Fdez. de Arroyabe JC. (2008) The choice of partners in R&D cooperation: An empirical analysis of Spanish firms. Technovation 28: 88-100.
Barbalet J. (2001) Emoção, Teoria Social e Estrutura social: uma Abordagem Macrossocial, Lisboa: Instituto Piaget.
Barbalet J. (2009a) Action Theoretic Foundations of Economic Sociology. Koelner Zeitschrift fuer Soziologie und Sozialpsychologie 49: 143 - 157.
Barbalet J. (2009b) A characterization of trust, and its consequences. Theory and Society 38: 367-382.
Becheikh N, Landry R and Amara N. (2006) Lessons from innovation empirical studies in the manufacturing sector: A systematic review of the literature from 1993–2003. Technovation 26: 644-664.
Beneito P. (2003) Choosing among alternative technological strategies: an empirical analysis of formal sources of innovation. Research Policy 32: 693-713.
Beugelsdijk S. (2008) Strategic Human Resource Practices and Product Innovation. Organization Studies 29: 821-847.
Bock AJ, Opsahl T, George G, et al. (2012) The Effects of Culture and Structure on Strategic Flexibility during Business Model Innovation. Journal of Management Studies 49: 279-305.
Borup M, Brown N, Konrad K, et al. (2006) The sociology of expectations in science and technology. Technology Analysis & Strategic Management 18: 285-298.
Brattström A, Löfsten H and Richtnér A. (2012) Creativity, trust and systematic processes in product development. Research Policy 41: 743-755.
Brower HH, Lester SW, Korsgaard MA, et al. (2009) A Closer Look at Trust Between Managers and Subordinates: Understanding the Effects of Both Trusting and Being Trusted on Subordinate Outcomes. Journal of Management 35: 327-347.
Burns RB and Burns RA. (2008) Business Research Methods and Statistics Using SPSS, London: SAGE.
Cainelli G, Evangelista R and Savona M. (2006) Innovation and economic performance in services: a firm-level analysis. Cambridge journal of economics 30: 435-458. Camelo‐Ordaz C, Fernández‐Alles MdlL and Martínez‐Fierro S. (2006) Influence of top
management team vision and work team characteristics on innovation. European Journal of Innovation Management 9: 179-201.
Camisón-Zornoza C, Lapiedra-Alcamí R, Segarra-Ciprés M, et al. (2004) A Meta-analysis of Innovation and Organizational Size. Organization Studies 25: 331-361.
Canepa A and Stoneman P. (2007) Financial constraints to innovation in the UK: evidence from CIS2 and CIS3. Oxford Economic Papers.
Cefis E and Marsili O. (2006) Survivor: The role of innovation in firms’ survival. Research Policy
35: 626-641.
Chattopadhyay P, Glick WH, Miller CC, et al. (1999) Determinants of executive beliefs:
Conceição P and Heitor MV. (2003) Systems of innovation and competence building across diversity: learning from the Portuguese path in the European context. In: Shavinina LV (ed) The International Handbook on Innovation. Oxford: Elsevier, 945-975.
Covin JG, Slevin DP and Heeley MB. (2000) Pioneers and followers: Competitive tactics, environment, and firm growth. Journal of Business Venturing 15: 175-210.
de Faria P, Lima F and Santos R. (2010) Cooperation in innovation activities: The importance of partners. Research Policy 39: 1082-1092.
de Jong JPJ and Den Hartog DN. (2007) How leaders influence employees' innovative behaviour. European Journal of Innovation Management 10: 41-64.
de Jong JPJ and Marsili O. (2006) The fruit flies of innovations: A taxonomy of innovative small firms. Research Policy 35: 213-229.
de Jong JPJ and Vermeulen PAM. (2006) Determinants of Product Innovation in Small Firms: A Comparison Across Industries. International Small Business Journal 24: 587-609. Dean JW, Jr. and Sharfman MP. (1996) Does Decision Process Matter? A Study of Strategic
Decision-Making Effectiveness. The Academy of Management Journal 39: 368-396. Denti L and Hemlin S. (2012) Leadership and Innovation in Organizations: A Systematic Review
of Factors that Mediate or Moderate the Relationship. International Journal of Innovation Management 16: 1240007.
Do TH, Mazzarol T, Volery T, et al. (2014) Predicting anticipated rent from innovation
commercialisation in SMEs. European Journal of Innovation Management 17: 183-208. Ebadi YM and Utterback JM. (1984) The Effects of Communication on Technological
Innovation. Management Science 30: 572-585.
Efrat K. (2014) The direct and indirect impact of culture on innovation. Technovation 34: 12-20. Etzkowitz H and Leydesdorff L. (2000) The dynamics of innovation: from National Systems and
“Mode 2” to a Triple Helix of university–industry–government relations. Research
Policy 29: 109-123.
European Commission. (2003) COMMISSION RECOMMENDATION of 6 May 2003 concerning the definition of micro, small and medium-sized enterprises. In: Commission E (ed). Official Journal of the European Union, L 124/136 - L 124/141.
European Commission. (2008) NACE Rev. 2 – Statistical Classification of Economic Activites in the European Community, Luxembourg: Office for Official Publications of the European Communities.
European Commission. (2013) Science, Technology and Innovation in Europe - 2013 edition Luxembourg: Publications Office of the European Union.
European Commission. (2014) Community Innovation Survey 2012.
http://ec.europa.eu/eurostat/data/database: European Commission, Eurostat. European Commission. (2014a) Innovation Union Scoreboard 2014, Belgium: European Union. European Patent Office. (2013) European Patent Convention. 15th Edition ed. Munich:
European Patent Office.
Filippetti A and Archibugi D. (2011) Innovation in times of crisis: National Systems of Innovation, structure, and demand. Research Policy 40: 179-192.
Fleming L, King I, Charles and Juda AI. (2007) Small Worlds and Regional Innovation. Organization Science 18: 938-954.
Freel M. (2006) Patterns of Technological Innovation in Knowledge‐Intensive Business Services. Industry and Innovation 13: 335-358.
Freel MS. (2005) Perceived Environmental Uncertainty and Innovation in Small Firms. Small Business Economics 25: 49-64.
Frey M, Iraldo F and Testa F. (2013) The determinants of innovation in green supply chains: evidence from an Italian sectoral study. R&D Management 43: 352-364.
Governo de Portugal PdCdM. (2011a) Programa Estratégico para o Empreendedorismo e a Inovação + E, + I. In: República Dd (ed). Lisboa, 5351-5354.
Governo de Portugal PdCdM. (2011b) Resolução do Conselho de Ministros n.º 54/2011. Diário da República: 5315-5316.
Gupta AK, Tesluk PE and Taylor SM. (2007) Innovation At and Across Multiple Levels of Analysis. Organization Science 18: 885-897.
Hair JF, Anderson RE, Tatham RL, et al. (2010) Multivariate Data Analysis, Upper Saddle River, NJ: Pearson Prentice Hall.
Hansen E. (2014) Innovativeness In The Face Of Decline: Performance Implications. International Journal of Innovation Management 18: 1450039.
Hosmer DW and Lemeshow S. (2000) Applied Logistic Regression, New York: John Wiley and Sons.
Huergo E. (2006) The role of technological management as a source of innovation: Evidence from Spanish manufacturing firms. Research Policy 35: 1377-1388.
INE. (2011) Sistema de Contas Integradas das Empresas, 2009. In: Estatística INd (ed). Lisboa: Instituto Nacional de Estatística.
INE. (2014) Empresas em Portugal 2012, Lisboa: Instituto Nacional de Estatística.
INPI. (2012) Dados Estatísticos sobre Invenções; Design; Marcas e OSDC 2011. In: Externas. DdREeAJDdR (ed). Lisboa: INPI.
INPI. (2013) Dados Estatísticos sobre Invenções; Design; Marcas e OSDC 2012. In: Externas. DdREeAJDdR (ed). Lisboa: INPI.
Jantunen A. (2005) Knowledge‐processing capabilities and innovative performance: an
empirical study. European Journal of Innovation Management 8: 336-349.
Jensen MB, Johnson B, Lorenz E, et al. (2007) Forms of knowledge and modes of innovation. Research Policy 36: 680-693.
Koberg CS, Detienne DR and Heppard KA. (2003) An empirical test of environmental,
organizational, and process factors affecting incremental and radical innovation. The Journal of High Technology Management Research 14: 21-45.
Koberg CS, Uhlenbruck N and Sarason Y. (1996) Facilitators of organizational innovation: The role of life-cycle stage. Journal of Business Venturing 11: 133-149.
Lazonick W. (2006) The Innovative Firm. In: Jan Fagerberg, David C. Mowery and Nelson RR (eds) The Oxford Handbook of Innovation. Oxford: Oxford University Press, 29-55. Luhmann N. (1979) Trust and Power: Two Works, Brisbane: Wiley.
Lumpkin GT and Dess GG. (2001) Linking two dimensions of entrepreneurial orientation to firm performance: The moderating role of environment and industry life cycle. Journal of Business Venturing 16: 429-451.
Lundvall BÅ and Borras S. (2006) Science, Technology and Innovation Policy. In: Jan Fagerberg, David C. Mowery and Nelson RR (eds) The Oxford Handbook of Innovation. Oxford: Oxford University Press, 599-631.
Madrid HP, Patterson MG, Birdi KS, et al. (2014) The role of weekly high-activated positive mood, context, and personality in innovative work behavior: A multilevel and interactional model. Journal of Organizational Behavior 35: 234-256.
Maroco J. (2010) Análise Estatística com o PASW Statistics (ex-SPSS), Lisboa: Report Number. Michie J and Sheehan M. (2003) Labour market deregulation,‘flexibility’and innovation.
Cambridge journal of economics 27: 123-143.
Murimbika M and Urban B. (2014) Strategic Innovation at the Firm Level: the Impact of Strategic Management Practices on Entrepreneurial Orientation. International Journal of Innovation Management 18: 1450016.
Nickell D, Rollins M and Hellman K. (2013) How to not only survive but thrive during recession:
a multi‐wave, discovery‐oriented study. Journal of Business & Industrial Marketing 28:
Nieto MJ and Santamaría L. (2007) The importance of diverse collaborative networks for the novelty of product innovation. Technovation 27: 367-377.
Nunes S. (2012) O Papel do Território no Processo de Inovação Empresarial. Instituto Superior de Ciências do Trabalho e da Empresa. Lisboa: Instituto Universitário de Lisboa. O'Malley L, Story V and O'Sullivan V. (2011) Marketing in a recession: retrench or invest?
Journal of Strategic Marketing 19: 285-310.
O'Regan N and Ghobadian A. (2005) Innovation in SMEs: the impact of strategic orientation and environmental perceptions. International Journal of Productivity and Performance Management 54: 81-97.
OECD. (2013) Country statistical profile: Portugal 2013/2.
OECD and Eurostat. (2005) Oslo Manual. Guidelines for Collecting and Interpreting Innovation Data, Paris: OECD Publishing.
Oliveira L. (2008) Sociologia da Inovação. A Construção Social das Técnicas e dos Mercados, Lisboa: Celta.
Oliveira L and Carvalho H. (2010) Why Firms Do Not Enrol in Socio-Technical Networks - Empirical Evidence from Portugal. Sociology of Science and Technology, Institute for the History of Science and Technology/Russian Academy of Sciences 1: 73-84.
Pandit S, Wasley CE and Zach T. (2011) The Effect of Research and Development (R&D) Inputs and Outputs on the Relation between the Uncertainty of Future Operating
Performance and R&D Expenditures. Journal of Accounting, Auditing & Finance 26: 121-144.
Papadakis V and Bourantas D. (1998) The chief executive officer as corporate champion of technological innovation: aii empirical investigation. Technology Analysis & Strategic Management 10: 89-110.
Papadakis V, Thanos I and Barwise P. (2010) Research on Strategic Decisions: Taking Stock and Looking Ahead. In: Paul C. Nutt and Wilson DC (eds) Hanbook of Decision Making. Chichester: Wiley, 31-69.
Pavitt K. (1984) Sectoral patterns of technical change: Towards a taxonomy and a theory. Research Policy 13: 343-373.
Pavitt K. (2006) Innovation Processes. In: Jan Fagerberg, David C. Mowery and Nelson RR (eds) The Oxford Handbook of Innovation. Oxford: Oxford University Press, 86-114.
Piteira MM. (2010) A construção social da inovação: estudos de caso de organizações portuguesas de base tecnológica. Instituto Superior de Economia e Gestão. Lisboa: Universidade Técnica de Lisboa.
Romijn H and Albaladejo M. (2002) Determinants of innovation capability in small electronics and software firms in southeast England. Research Policy 31: 1053-1067.
Salavisa I, Sousa C and Fontes M. (2012) Topologies of innovation networks in knowledge-intensive sectors: Sectoral differences in the access to knowledge and complementary assets through formal and informal ties. Technovation 32: 380-399.
Salavisa I and Vali C. (2011) Knowledge Intensive Sectors in Moderate Innovative Countries in Europe: Overcoming the Missing Links, Stepping over Barriers. Working Paper, DINAMIA.
Simmel G. (2011) The Philosophy of Money, London and New York: Routledge.
Souitaris V. (2001) External communication determinants of innovation in the context of a newly industrialised country: a comparison of objective and perceptual results from Greece. Technovation 21: 25-34.
Srinivasan R, Rangaswamy A and Lilien GL. (2005) Turning adversity into advantage: Does proactive marketing during a recession pay off? International Journal of Research in Marketing 22: 109-125.
Sternberg R and Arndt O. (2001) The Firm or the Region: What Determines the Innovation Behavior of European Firms? Economic Geography 77: 364-382.
Sutcliffe KM and Huber GP. (1998) Firm and industry as determinants of executive perceptions of the environment. Strategic Management Journal 19: 793.
Tabachnick BG and Fidell LS. (2007) Using Multivariate Statistics, Boston: Pearson. Taylor MZ and Wilson S. (2012) Does culture still matter?: The effects of individualism on
national innovation rates. Journal of Business Venturing 27: 234-247.
Teece DJ. (1996) Firm organization, industrial structure, and technological innovation. Journal of Economic Behavior & Organization 31: 193-224.
Tellis GJ, Prabhu JC and Chandy RK. (2009) Radical Innovation Across Nations: The Preeminence of Corporate Culture. Journal of Marketing 73: 3-23.
Uzkurt C, Kumar R, Kimzan HS, et al. (2012) The impact of environmental uncertainty dimensions on organisational innovativeness: An empirical study on SMEs. International Journal of Innovation Management 16: 1250015.
van der Panne G, van Beers C and Kleinknecht A. (2003) Success and Failure of Innovation: A Literature Review. International Journal of Innovation Management 07: 309-338. Vermeulen P, Büch R, Greenwood R, et al. (2007) The Impact of Governmental Policies in
Institutional Fields: The Case of Innovation in the Dutch Concrete Industry. Organization Studies 28: 515-540.
Walsh JP and Dewar RD. (1987) Formalization and the Organizational Life Cycle[1]. Journal of Management Studies 24: 215-231.
Webster A and Packer K. (1996) Innovation and the intellectual property system: Kluwer Law International.