MODIFICATIONS FOR THE TUKEY TEST PROCEDURE
AND EVALUATION OF THE POWER AND EFFICIENCY OF
MULTIPLE COMPARISON PROCEDURES
Armando Conagin1; Décio Barbin2*; Clarice Garcia Borges Demétrio2
1
IAC - C.P. 28 - 13001-970 - Campinas, SP - Brasil.
2
USP/ESALQ, Depto. de Ciências Exatas, C.P. 09 - 13418-900 - Piracicaba, SP - Brasil. *Corresponding author <[email protected]>
ABSTRACT: Multiple pairwise comparison tests of treatment means are of great interest in applied research. Two modifications for the Tukey test were proposed. The power of unilateral and bilateral Student, Waller-Duncan, Duncan, SNK, REGWF, REGWQ, Tukey, Bonferroni, Sidak, unilateral Dunnet statistical tests and the modified tests, Sidak, Bonferroni 1 and 2, Tukey 1 and 2, has been compared using the Monte Carlo method. Data were generated for 600 experiments with eight treatments in a randomized block design, of which 400 had four and 200 eight blocks. The differences between the treatment means in relation to the control were 30%, 20%, 15%, 10%, 5%. Two extra treatments did not differ from the control. A coefficient of variation of 10% and a probability Type I error of a = 0.05 were adopted. The power of all the tests decreased when the differences to the control, decreased. The unilateral and bilateral Student t, Waller-Duncan and Duncan tests showed greater number of significative differences, followed by unilateral Dunnett, modified Sidak, modified Bonferroni 1 and 2, modified Tukey 1, SNK, REGWF, REGWQ, modified Tukey 2, Tukey, Sidak and Bonferroni. There is great loss of efficiency for all tests in relation to the unilateral Student t test for each difference of the treatment to the control, when the differences between means decrease. The modified tests were always more efficient than their original ones.
Key words: multiple comparison statistical tests, type I errors, Monte Carlo method, power of tests
MODIFICAÇÕES NO PROCEDIMENTO PARA O TESTE DE
TUKEY E PODER E EFICIÊNCIA DE TESTES DE
COMPARAÇÕES MÚLTIPLAS
RESUMO: Testes de comparações múltiplas entre médias de tratamentos são de grande interesse na pesquisa aplicada. Duas propostas de modificação do teste de Tukey são apresentadas e, usando-se simulação pelo método Monte Carlo, foi comparado o poder dos testes estatísticos: Student unilateral e bilateral, Waller-Duncan, Duncan, SNK, REGWF, REGWQ, Tukey, Bonferroni, Sidak, Dunnet unilateral, e dos testes modificados de Sidak, Bonferroni 1 e 2 e Tukey 1 e 2. Foram gerados dados para 600 experimentos em um delineamento casualizado em blocos com oito tratamentos, sendo 400 com quatro repetições e 200 com oito repetições. Foram adotados coeficiente de variação de 10% e erro tipo I com probabilidade a = 0.05. As diferenças entre as médias dos tratamentos e o controle foram de 30%, 20%, 15%, 10%, 5%; sendo, ainda incluídos, dois tratamentos que, parametricamente, não diferiram da média do controle. Para todos os testes, o poder decresceu quando as diferenças das médias em relação à média do controle decresceram; pela ordem, t de Student unilateral, t de Student bilateral e Waller-Duncan apresentaram maior número de diferenças significativas; seguindo-se Duncan, Dunnett unilateral, Sidak modificado e Bonferroni modificados 1 e 2 e Tukey modificado 1, SNK, REGWF, REGWQ, Tukey modificado 2 e os testes de Tukey, Sidak e Bonferroni. Houve grande perda de eficiência para todos os testes em relação ao teste t de Student unilateral, usado para comparar cada tratamento com o controle, quando o valor da diferença entre médias diminui. Os testes modificados foram sempre mais eficientes do que os respectivos testes originalmente propostos.
Palavras-chave: testes estatísticos de comparações múltiplas, erro tipo I, método Monte Carlo, poder dos testes
INTRODUCTION
In applied research the evaluation of the hy-pothesis under investigation can be obtained
mul-tiple comparison procedures (Hochberg & Tamhane, 1987; Hsu, 1996). A common practice is to compare new treatments to a control. In corn or wheat breed-ing, for example, new cultivars have to be compared to the main cultivar. In animal husbandry, new feed-ing treatments have to be compared to a main treat-ment that is in use. In medical research, new promis-ing medicines have to be compared to the one adopted, before FDA in USA or ANVISA in Brazil give permis-sion for their commercialization.
The area of rejection of the global null hypoth-esis H
0 is generally chosen in such a way that the
prob-ability of a Type II error (acceptance of a wrong hy-pothesis) is as small as possible while the Type I er-ror rate is prefixed or not. For the comparison of the means, the Type I error rate may be of the comparisonwise or experimentwise types. The latter can be under global null hypothesis or partial null hy-pothesis, or maximum experimentwise error rate (MEER) which is the preferred one.
The behavior of certain statistical tests and their performance in terms of Type I error rate have been evaluated, for example, by Gabriel (1964); Boardman & Moffitt (1971); O’Neill & Wetheril (1971); Bernardson (1975); Hsu (1996) and many others but there are still many questions to be answered in this research field (Hocking, 1985).
Studies by Boardman & Moffitt (1971), re-garding the Type I error rate per comparison for ex-periments with two to eleven treatments (identical treatments), under true global null hypothesis H0, re-vealed that the Student t test maintained a frequency of rejection of the null hypothesis very near the adopted value of a = 0.05; the Duncan test had val-ues varying from near 0.05 for t = 2 to near 0.025 for t = 11; the SNK, Tukey and Scheffée tests showed values gradually smaller, from 0.05 for t = 2 to near 0.01 for t = 11, different of the adopted Type I error of 0.05.
For the experimentwise Type I error, adopt-ing a = 0.05, the t test revealed an increment of fre-quency from 0.05, for t = 2, to near 0.55, for t = 11; the Duncan test had values varying near 0.05 for t = 2 to 0.25, for t = 11; the other three tests maintained the frequencies near the nominal value a or gave smaller values. Similar results were obtained by Bernardson (1975) and Perecin & Barbosa (1988). Conagin (1998); Conagin et al. (1999); Conagin (1999) and Conagin & Gomes (2004) using different number of combinations of size, number of treatments, repli-cations and different C.Vs. compared a great number of tests. Conagin & Barbin (2006a, 2006b) evaluated the behavior of various tests and introduced the modi-fied tests Sidak, Bonferroni 1 and 2.
The aim of this study is to propose two modi-fications for the Tukey test and to evaluate the power and the efficiency of the 11 classical and five modi-fied multiple comparison tests.
MATERIAL AND METHODS
Two modifications for the statistical Tukey test are suggested and the power of unilateral and bilateral Student, Waller-Duncan, Duncan, SNK, REGWF, REGWQ, Tukey, Bonferroni, Sidak, unilateral Dunnet tests and the modified tests Sidak, Bonferroni 1 and 2, Tukey 1 and 2 have been compared using the Monte Carlo simulation method. All classical tests were cal-culated using the SAS (2003) software.
Data were generated for 600 experiments with eight treatments in a randomized block design, of which 400 had four and 200 eight blocks. The differ-ences between the treatment means in relation to the control were 30%, 20%, 15%, 10%, 5%; two extra treatments did not differ from the control. A coeffi-cient of variation of 10% and a probability Type I er-ror of a = 0.05 were adopted. The evaluation of the power of each test was made by the value of the per-centage of the number of significative differences ob-tained in relation to the number of experiments per-formed. A brief description of the modifications of the Tukey test is presented.
Modified Tukey Test 1, TuM1
If the global null hypothesis Ho (t1 = t2 = ... =
tt = 0, where ti, i = 1, …, t, is the i-th treatment ef-fect), is rejected, the greatest interest of the researcher is to know how the t treatments means differ.
The Tukey test determines for every pair of means whether they are significantly different and is based on a familywise error rate for k = t (t-1)/2 com-parisons. The procedure is to test the hypotheses: Ho:
mi = mi’, versus Ho: mi¹mi’, i ¹ i’ = 1, …, t, and Ho is rejected at an a significance level if
mi – mi’³ q s Ö 1/r or mi – mi’³ q s Ö[1/2(1/ri+ 1/ri’)],
where m
i and mi’ are the estimates of the means and ri
and ri’ are the number of replicates of treatments i and i’ and q = qt,n,a is the value of the studentized range with t means, n degrees of freedom associated to s2, the Residual Mean Square.
for BM2 and siM and determine â, an estimate of the number of significative differences a. As the null hypothesis H0 is rejected, the new H’0 should have a t – â range of ti’s = 0. The value of q is now obtained for t – â and n degrees of freedom and used to calc ulate the least significant difference (lsd = q s Ö [1/2(1/ri+ 1/ri’)]). The differences between means larger than this lsd value will be declared sta-tistically significative according to the TuM
1 test.
Modified Tukey Test 2, TuM2
The procedure to estimate a is similar to that used for TuM1 but now the â value is obtained by ap-plying the original Tukey test, which is equal to the number of significative differences (with H0, the glo-bal null hypothesis rejected) and the new H’0 hypoth-esis will have a t – â range of ti’s = 0. The value of q now is obtained for t – â and n degrees of freedom and used to calculate the lsd. The differences between means larger than this lsd value will be declared sta-tistically significative according to the TuM2 test.
The argument to accept that â is generally smaller than k is: if the treatments are ranked then the treatments that are situated far apart have differences that are probably statistically significative. Neverthe-less, two treatments that are consecutive in the ordered set, due to the size of experimental error or smaller number of replications or other causes, have
gener-ally not significative differences. It is sufficient to have at least one or more situations like this to cause â to be smaller then k in the BM2 and SiM tests.
Regarding TuM1, for which the range is t (number of treatments of the experiment), it may be possible that (when all comparisons between two means are performed) â may be larger than t. In this case and for coherence, a restriction shall be imposed: use TuM1 if â < (t-1) and use TuM2 if â > (t-1).
RESULTS AND DISCUSSION
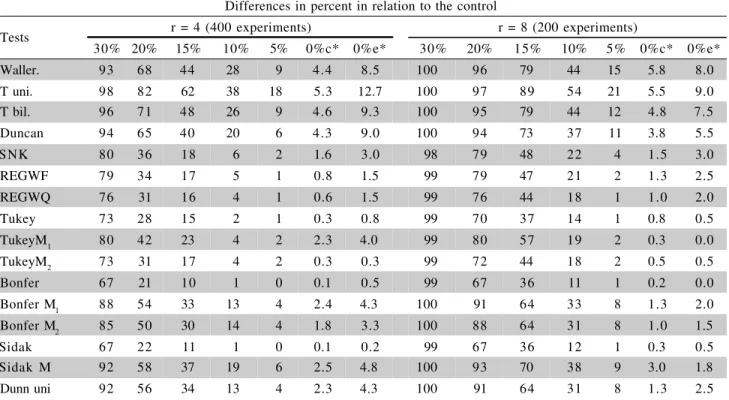
The power of each test was higher for r = 8 than for r = 4; for the larger difference (30%) the power of all tests are high, but differences occur (Table 1). When the real value of the differences de-creases, the power of each test decreases and the dif-ference of power among the different tests increases. The unilateral Student test was somewhat more pow-erful than the bilateral Student t test followed by the Waller-Duncan; Duncan, Dunnett unilateral, siM, BM1, BM2, TuM1, SNK, REGWF, REGWQ, TuM2, Tukey, Sidak and Bonferroni tests.
The new modified tests are of the MEER Type. The efficiency of each test calculated in relation to the unilateral Student t test is shown in Table 2. The dis-crepancy of their efficiency always increased as the true difference (30%, 20%, 15%, 10% and 5%)
de-Table 1 - Power of various statistical tests between treatments and the control for differences of 30%, 20%, 15%, 10%, 5% and 0% for eight treatments, four and eight replications and coefficient of variation CV = 10% (rounded values).
*The columns 0%c and 0%e shown the comparisonwise and experimentwise Type I erros, respectively. Differences in percent in relation to the control
Tests r = 4 (400 experiments) r = 8 (200 experiments)
30% 20% 15% 10% 5% 0%c* 0%e* 30% 20% 15% 10% 5% 0%c* 0%e*
Waller. 93 68 44 28 9 4.4 8.5 100 96 79 44 15 5.8 8.0
T uni. 98 82 62 38 18 5.3 12.7 100 97 89 54 21 5.5 9.0
T bil. 96 71 48 26 9 4.6 9.3 100 95 79 44 12 4.8 7.5
Duncan 94 65 40 20 6 4.3 9.0 100 94 73 37 11 3.8 5.5
SNK 80 36 18 6 2 1.6 3.0 98 79 48 22 4 1.5 3.0
REGWF 79 34 17 5 1 0.8 1.5 99 79 47 21 2 1.3 2.5
REGWQ 76 31 16 4 1 0.6 1.5 99 76 44 18 1 1.0 2.0
Tukey 73 28 15 2 1 0.3 0.8 99 70 37 14 1 0.8 0.5
TukeyM1 80 42 23 4 2 2.3 4.0 99 80 57 19 2 0.3 0.0
TukeyM2 73 31 17 4 2 0.3 0.3 99 72 44 18 2 0.5 0.5
Bonfer 67 21 10 1 0 0.1 0.5 99 67 36 11 1 0.2 0.0
Bonfer M1 88 54 33 13 4 2.4 4.3 100 91 64 33 8 1.3 2.0
Bonfer M2 85 50 30 14 4 1.8 3.3 100 88 64 31 8 1.0 1.5
Sidak 67 22 11 1 0 0.1 0.2 99 67 36 12 1 0.3 0.5
Sidak M 92 58 37 19 6 2.5 4.8 100 93 70 38 9 3.0 1.8
creased. This is very important because in breeding programs and other types of research the new aimed progress always tends to be more difficult to be ob-tained and the progress is smaller. The power and the efficiency of the various tests were always greater for r = 8 than for r = 4, and the power of the modified tests were always greater than their original ones.
The efficiency of the Bonferroni, Sidak and Tukey tests in relation to their respective modified ver-sions was always smaller than one, and their values rapidly decreased as the true differences (30%, 20%, 15%) decreased. If the error to be adopted (a = 0.05) for the comparison of two means satisfies the re-searcher, then a comparisonwise type of test such as the Student unilateral t test may be chosen. If he wants
Table 2 - Efficiency of the various statistical tests in relation to unilateral Student t test for eight treatments, four and eight replications and coefficient of variation CV = 10%.
Tests r = 4 (400 experiments) r = 8 (200 experiments)
30% 20% 15% 10% 5% 30% 20% 15% 10% 5%
Waller 0.95 0.83 0.71 0.74 0.50 1.00 0.99 0.89 0.81 0.71
T unil. 1.00 1.00 1.00 1.00 1.00 1.00 1.00 1.00 1.00 1.00
T bil. 0.98 0.87 0.77 0.68 0.50 1.00 0.98 0.89 0.81 0.57
Duncan 0.96 0.79 0.65 0.53 0.33 1.00 0.97 0.82 0.69 0.52
SNK 0.82 0.44 0.29 0.16 0.11 0.98 0.81 0.54 0.41 0.19
REGWF 0.81 0.41 0.27 0.13 0.06 0.99 0.81 0.53 0.39 0.10
REGWQ 0.78 0.38 0.26 0.11 0.06 0.99 0.78 0.49 0.33 0.05
Tukey 0.74 0.34 0.24 0.06 0.06 0.99 0.72 0.42 0.26 0.05
Bonfer. 0.68 0.26 0.16 0.03 0.00 0.99 0.69 0.40 0.20 0.05
Sidak 0.68 0.27 0.18 0.03 0.00 0.99 0.69 0.40 0.22 0.05
Dun.unil 0.94 0.68 0.55 0.34 0.22 1.00 0.94 0.72 0.57 0.38
Bonfer. M1 0.90 0.66 0.53 0.34 0.22 1.00 0.94 0.72 0.61 0.38
Bonfer. M2 0.87 0.61 0.48 0.37 0.22 1.00 0.91 0.72 0.57 0.38
Sidak M 0.94 0.71 0.60 0.50 0.33 1.00 0.96 0.79 0.70 0.42
Tukey M1 0.82 0.51 0.37 0.11 0.11 0.99 0.82 0.64 0.33 0.09
Tukey M2 0.74 0.38 0.27 0.11 0.11 0.99 0.74 0.49 0.33 0.09
Table 3 - Comparative efficiency between the original and modified Bonferroni, Sidak and Tukey tests, and modified tests in relation to unilateral Dunnett´s test for a randomized design with eight treatments, four and eight replications and for differences of 30%, 20%, 15%, 10% and 5% in relation to a control.
Efficiency r = 4 (400 experiments) r = 8 (200 experiments)
30% 20% 15% 10% 5% 30% 20% 15% 10% 5%
Bonfer./BM2 0.78 0.42 0.33 0.33 0.00 0.99 0.76 0.56 0.35 0.13
Sidak/SiM 0.73 0.40 0.30 0.30 0.00 0.99 0.72 0.51 0.32 0.08
Tukey/TuM1 0.91 0.67 0.65 0.20 0.20 1.00 0.87 0.65 0.77 0.50
Tukey/TuM
2 1.00 0.90 0.88 0.50 0.50 1.00 0.97 0.84 0.77 0.50
BM1/Dunnett 0.96 0.96 0.97 1.00 1.00 1.00 1.00 1.00 1.06 1.00
BM2/Dunnett 0.92 0.89 0.88 1.08 1.00 1.00 0.97 1.00 1.00 1.00
SiM/Dunnett 1.00 1.04 1.09 1.46 1.50 1.00 1.02 1.09 1.22 1.12
an error a for the global H0 or H’0, then he must ap-ply an experimentwise type of test. The values shown in Table 1 may help in his choice. When two means are compared, the software used generally gives the exact probability p of the test; the result helps to evalu-ate better the degree of confidence of the obtained re-sult.
ACKNOWLEDGEMENTS
To Silvio Sandoval Zocchi, for his collabora-tion on the final edicollabora-tion of the present paper.
REFERENCES
BERNARDSON, C.S. Type error rates when multiple comparison procedures follow a significant test ANOVA. Biometrics, v.31, p.229-232, 1975.
BOARDMAN, T.J.; MOFFITT, D.R. Graphical Monte Carlo type Y error rates, for multiple comparison procedures. Biometrics, v.27, p.738-744, 1971.
CARMER, S.G.; SWANSON, M.R. Evaluation of ten multiple multiple comparison procedures by Monte Carlo methods.
Journal of American Statistical Association, v.68, p.66-74, 1973.
CONAGIN, A. Discriminative power of the modified Bonferroni´s test. Revista de Agricultura, v.73, p.31-46, 1998.
CONAGIN, A. Discriminative power of the modified Bonferroni’s test under general and partial null hypothesis. Revista de
Agricultura, v.74, p.117-126, 1999.
CONAGIN, A.; BARBIN, D. Bonferroni’s modified tests. Scientia Agricola, v.63, p.70-76, 2006a.
CONAGIN, A.; BARBIN, D. Poder e eficiência dos diferentes testes e s t a t í s t i c o s p a r a c o m p a r a ç õ e s m ú l t i p l a s . Revista de
Agricultura, v.81, p.118-137, 2006b.
CONAGIN, A.; IGUE, T.; NAGAI, V. Poder discriminativo de
diferentes testes de médias. Campinas: Instituto Agronômico, 1999. (Boletim Científico, 44).
CONAGIN, A.; GOMES, F.P. Escolha adequada dos testes estatísticos para comparações múltiplas. Revista de Agricultura, v.79, p.288-295, 2004.
GABRIEL, K.R. A procedure for treating the homogeneity of all set of means in analysis of variance. Biometrics, v.20, p.459-477, 1964.
HOCHBERG, Y.; TAMHANE, A.C. Multiple comparisons procedures. New York: John Wiley, 1987. 450p.
HOCKING, R.R. The analysis of linear models. Belmont: Brooks/ Cole, 1985. 385p.
HSU, J.C. Multiple comparisons. London: Chapman and Hall, 1996. 277p.
O’NEILL, R.; WETHERIL, G.B. The present state of multiple comparison. Journal of the Royal Statistical Society, v.33, p.218-250, 1971.
PERECIN, D.; BARBOSA, J.C. Uma avaliação de seis procedimentos para comparações múltiplas. Revista de Matemática e
Estatística, v.6, p.95-103, 1988.
SAS INSTITUTE. System for Microsoft Windows, release 9.1 (TS2M0). Cary: SAS Institute, 2003. CD ROM.